. 2018 Jul 5;9(1):2616.
doi: 10.1038/s41467-018-05042-6.

Reconstructing the sediment concentration of a giant submarine gravity flow

Affiliations

Reconstructing the sediment concentration of a giant submarine gravity flow

Christopher John Stevenson et al. Nat Commun. .

Abstract

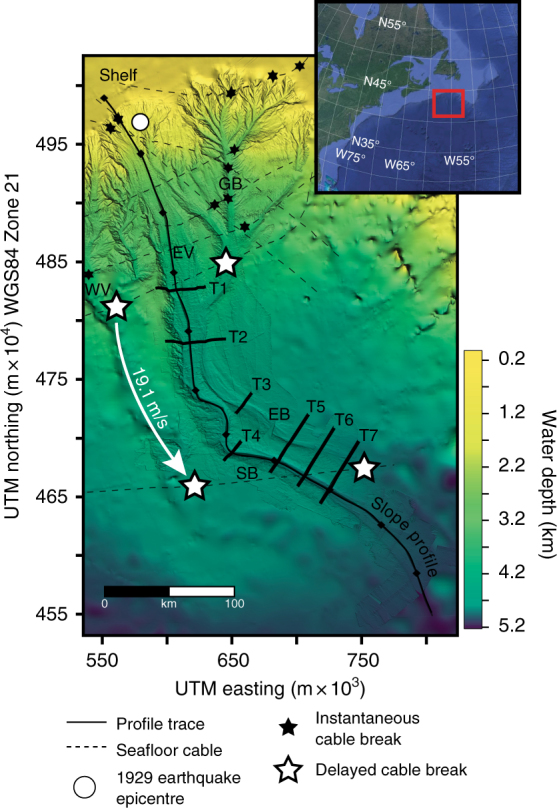
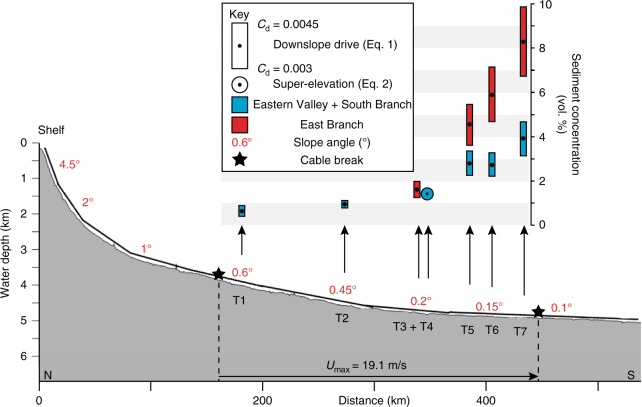
Submarine gravity flows are responsible for the largest sediment accumulations on the planet, but are notoriously difficult to measure in action. Giant flows transport 100s of km3 of sediment with run-out distances over 2000 km. Sediment concentration is a first order control on flow dynamics and deposit character. It has never been measured directly nor convincingly estimated in large submarine flows. Here we reconstruct the sediment concentration of a historic giant submarine flow, the 1929 "Grand Banks" event, using two independent approaches, each validated by estimates of flow speed from cable breaks. The calculated average bulk sediment concentration of the flow was 2.7-5.4% by volume. This is orders of magnitude higher than directly-measured smaller-volume flows in river deltas and submarine canyons. The new concentration estimate provides a test case for scaled experiments and numerical simulations, and a major step towards a quantitative understanding of these prodigious flows.


Conflict of interest statement

The authors declare no competing interests.

Figures

Fig. 1
Fig. 1
Bathymetry of the Grand Banks slope shown via a General Bathymetric Chart of the Oceans (GEBCO) base map, which is overlain by higher-resolution swath bathymetry collected aboard Cruise MSM47 in 2015. Several major channel systems were pathways for the 1929 flow: Western Valley (WV), Grand Banks Valley (GB), and Eastern Valley (EV), which splits into two smaller channels: East Branch (EB) and South Branch (SB). Delayed cable breaks provide a direct measure of flow speed (19.1 ms−1). A down slope profile (Fig. 4) runs through the Eastern Valley channel system with 7 channel cross-section profiles (T1-T7) (Fig. 3). Insert map uses satellite imagery from Google Earth ProTM
Fig. 2
Fig. 2
Acoustic backscatter from Cruise MSM47 (see 'Methods') across the lower parts of the Eastern Valley channel system with interpretation of erosional trimlines from the 1929 flow. The Eastern Valley (EV) splits into two smaller channels: East Branch (EB) and South Branch (SB). High-intensity backscatter represents rough sandy deposits whilst low-intensity represents smooth mud. Erosional trimlines are inferred from sharp boundaries in backscatter intensity running along the margins of the channels (red lines). Cores show major erosion by the 1929 flow within the channels that extends up to the elevation of the trimlines (gravels—yellow, bypass drapes—blue and bounced—orange circles). Undisturbed sediments occur above the trimline (green circles). Dive transect 1723 (squares) shows fresh outcrop and bio-erosion (yellow line) sharply changing into undisturbed sediments (green line). Channel transects shown as blue lines (T1–T7). The backscatter insert shows a more detailed picture of the super-elevated trimlines around the sharp bend in South Branch (T4)
Fig. 3
Fig. 3
Cross-section topographic profiles and trimline elevations. a Channel cross-section topographic profiles T1–T9 with erosion trimlines marked (arrows) from the backscatter bathymetry (Fig. 2). b Plot showing trimline elevations from channel floor bathymetry (colour coded to T1–T9 profiles). EV Eastern Valley, EB East Branch, SB South Branch (see Fig. 1)
Fig. 4
Fig. 4
Reconstruction of the bulk sediment concentration of the 1929 flow through the Eastern Valley channel system. Parameters from Eqs. (1) and (2) are constrained from the field data, which allows sediment concentration (C) to be back-calculated: Velocity (U) from cable breaks (Fig. 1), flow thickness (Hf) from channel trimlines (Fig. 2) and, slope gradient (sinθ) from bathymetry (Fig. 1). Slope profile trace is shown in Fig. 1. Frictional terms (Cd and Ew) in Eqs. (1) and (2) are not constrained by the field data and must be estimated (see ′Discussion′). This introduces error into the estimates of sediment concentration
Fig. 5
Fig. 5
Conceptual velocity and concentration profiles vertically within a submarine gravity flow. a Low depth-averaged sediment concentrations result in a progressive increase in concentration towards the flow base. The shape of this profile is governed by the downward settling of grains and the upward mixing of turbulence. b At higher depth-averaged concentrations the flow stratifies into a hyperconcentrated basal grain flow layer overlain by a more dilute upper layer. Turbulence is suppressed in the basal layer and particles maintained in suspension via grain collisions and hindered settling effects. Our estimates of depth-averaged concentration indicate the 1929 flow probably had a high-concentration profile

References

    1. Galy, V. et al. Efficient organic carbon burial in the Bengal fan sustained by the Himalayan erosional system. Nature450, 407–410. - PubMed
    1. Curray JR, Emmel FJ, Moore DG. The Bengal Fan: morphology, geometry, stratigraphy, history and processes. Mar. Pet. Geol. 2002;19:1191–1223. doi: 10.1016/S0264-8172(03)00035-7. - DOI
    1. Carter L, et al. Submarine cables and the oceans: connecting the world. U. Nations Environ. Program. Conserv. Monit. Cent. Biodivers. Unit., Camb., U. K. 2009;31:64.
    1. Zakeri A. A potentially devastating offshore geohazard - submarine debris flow impact on pipelines. Explor. Prod. Oil Gas. Rev. 2008;6:118–121.
    1. Talling PJ, Masson DG, Sumner EJ, Malgesini G. Subaqueous sediment density flows: Depositional processes and deposit types. Sedimentology. 2012;59:1937–2003. doi: 10.1111/j.1365-3091.2012.01353.x. - DOI

Publication types

LinkOut - more resources