. 2018 Jul 5;8(1):10163.
doi: 10.1038/s41598-018-28332-x.

DNA methylation landscape of the genes regulating D-serine and D-aspartate metabolism in post-mortem brain from controls and subjects with schizophrenia

Affiliations

DNA methylation landscape of the genes regulating D-serine and D-aspartate metabolism in post-mortem brain from controls and subjects with schizophrenia

Simona Keller et al. Sci Rep. .

Abstract

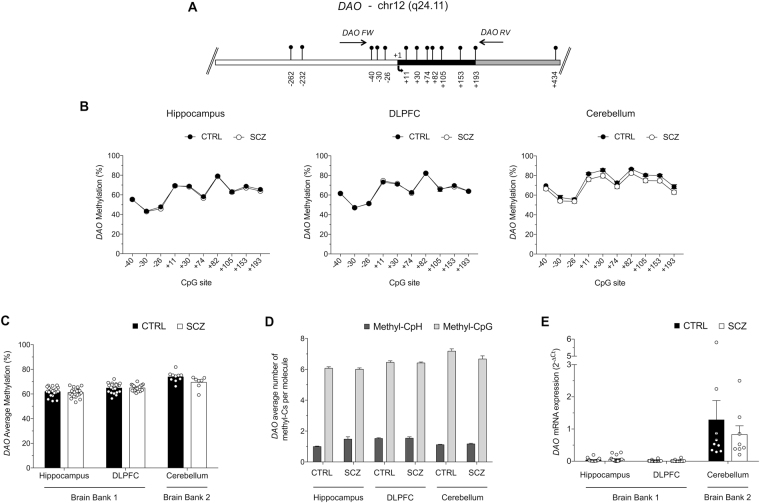
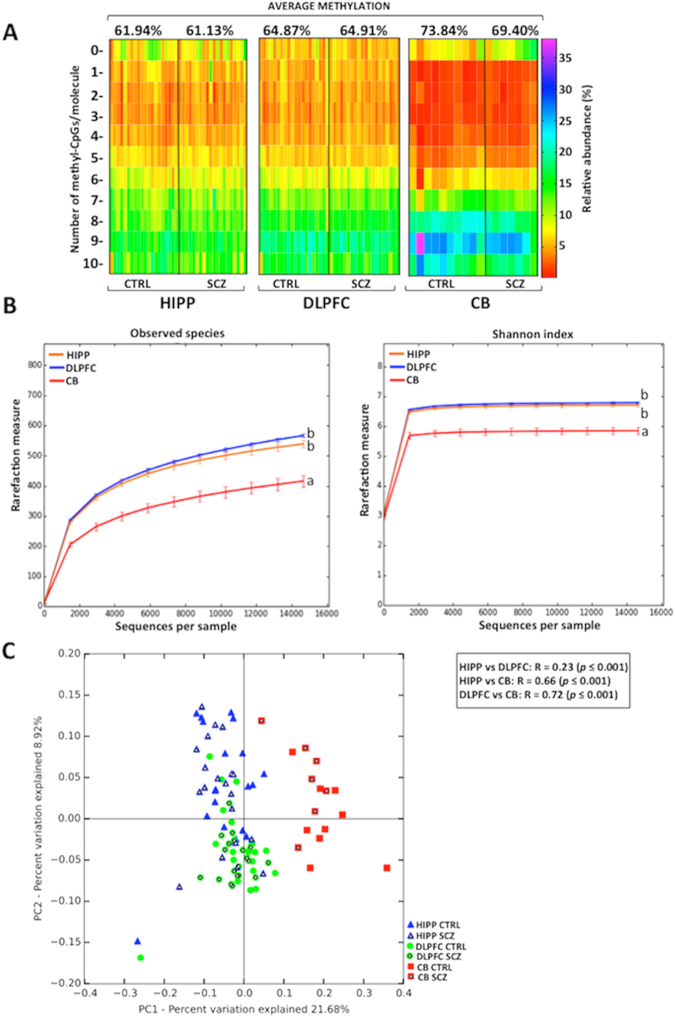
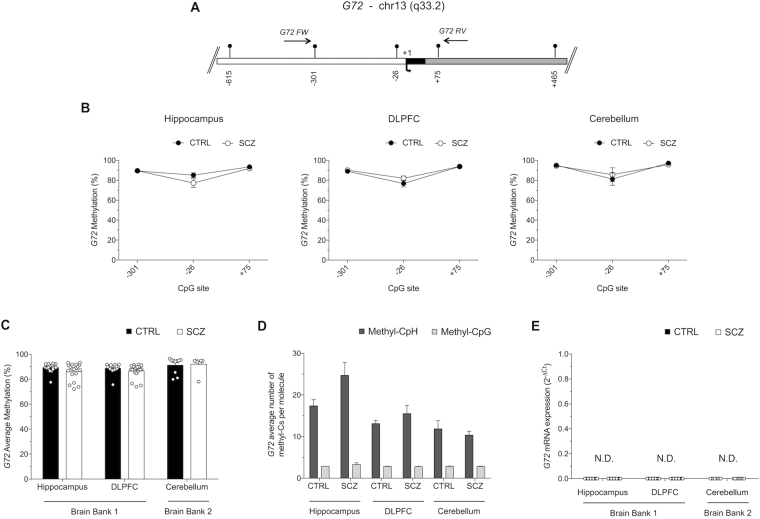
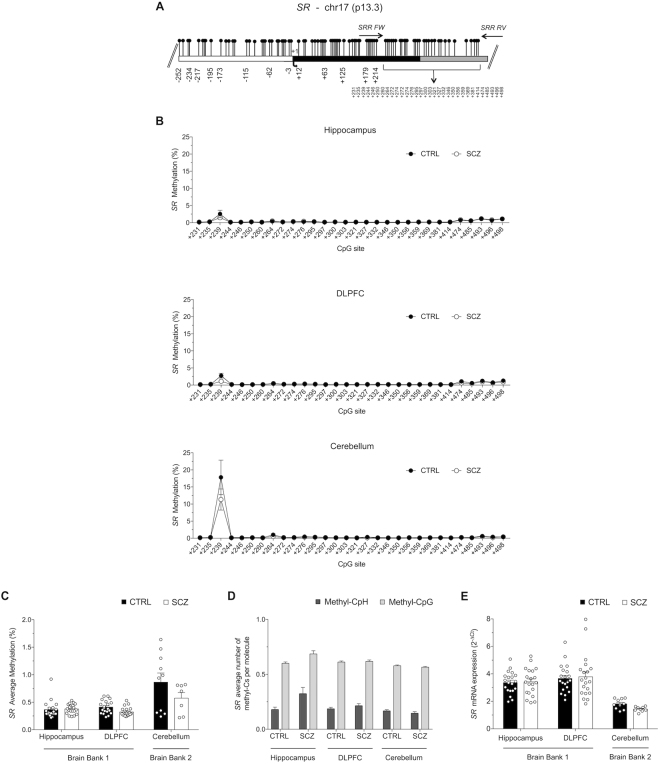
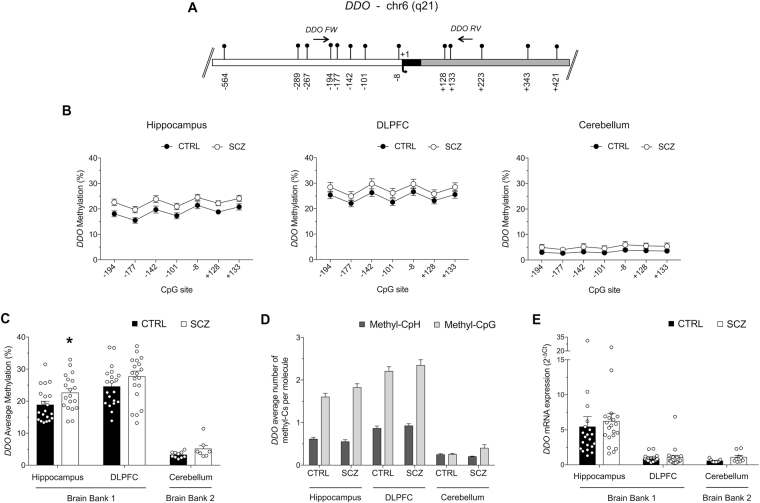
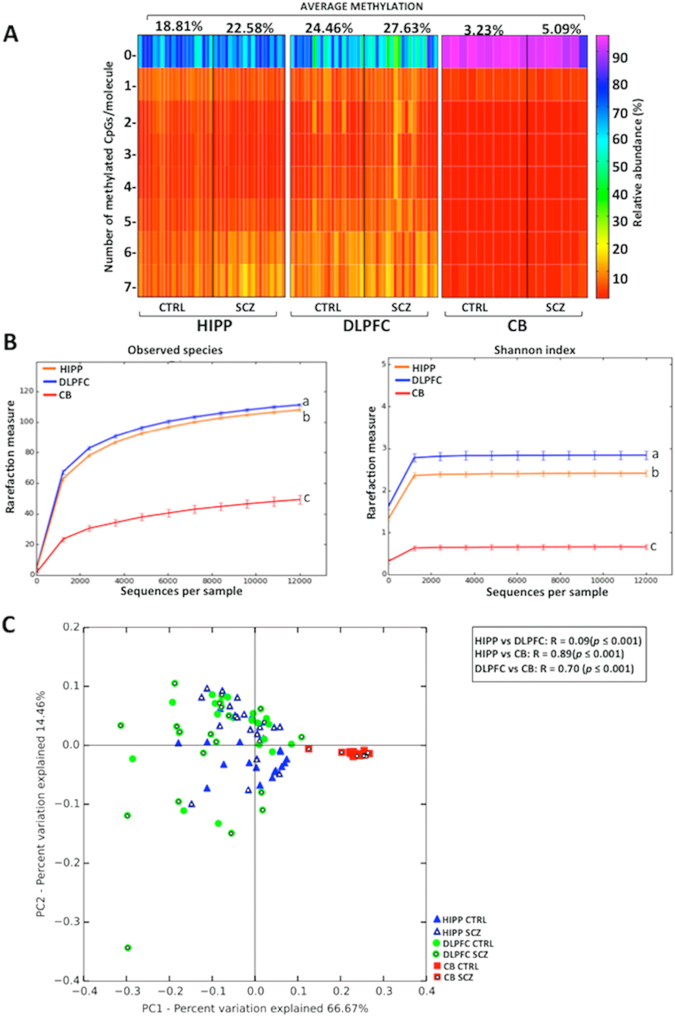
The spatio-temporal regulation of genes involved in the synthesis and degradation of D-serine and D-aspartate such as serine racemase (SR), D-amino acid oxidase (DAO), G72 and D-aspartate oxidase (DDO), play pivotal roles in determining the correct levels of these D-amino acids in the human brain. Here we provide a comprehensive analysis of mRNA expression and DNA methylation status of these genes in post-mortem samples from hippocampus, dorsolateral prefrontal cortex, and cerebellum from patients with schizophrenia and non-psychiatric controls. DNA methylation analysis was performed at an ultradeep level, measuring individual epialleles frequency by single molecule approach. Differential CpG methylation and expression was detected across different brain regions, although no significant correlations were found with diagnosis. G72 showed the highest CpG and non-CpG methylation degree, which may explain the repression of G72 transcription in the brain regions considered here. Conversely, in line with the sustained SR mRNA expression in the analyzed areas, very low methylation levels were detected at this gene's regulatory regions. Furthermore, for DAO and DDO, our single-molecule methylation approach demonstrated that analysis of epiallele distribution was able to detect differences in DNA methylation representing area-specific methylation signatures, which are likely not detectable with targeted or genome-wide classic methylation analyses.


Conflict of interest statement

The authors declare no competing interests.

Figures

Figure 1
Figure 1
Epigenetic analysis of DAO. (A) Structure of the DAO gene showing the putative regulatory upstream region (white box), exons (black box) and first intron (grey box). Transcriptional start site (+1) is indicated by an arrow. Vertical bars represent the relative position of each CpG site and the arrows indicate the primer positions. The gene sequence was retrieved by Ensemble database accession number: DAO ENSG00000110887. (B) The methylation average at each CpG site, between the two groups (CTRL: black circles; SCZ; open circles) for each region (HIPP, DLPFC and CB) is reported in the graphs. (C) The average methylation of controls (CTRL) and subjects with schizophrenia (SCZ) in hippocampus (HIPP), dorsolateral-prefrontal cortex (DLPFC) and cerebellum (CB) areas is reported in the histogram. (D) For each sample group and brain area, the number of mCpH and mCpG per molecule was calculated as described in the Materials and Methods section. The percent values of non-CpG methylation are reported in Table S2. (E) DAO mRNA expression levels in the HIPP, DLPFC and CB of control and schizophrenia patients were detected by quantitative RT-PCR and expressed as 2−ΔCt. All data are shown as the mean ± standard error (SEM).
Figure 2
Figure 2
DAO epiallelic classes and distribution analyses. (A) Heatmaps show the relative abundance of different epiallelic classes (from 0 to 10 methyl-cytosine per molecule) in each sample and in all analyzed brain regions (hippocampus = HIPP; dorsolateral prefrontal cortex = DLPFC; cerebellum = CB). The color gradient from red to violet indicates the percentage of each epiallelic class. On the top of the graph, the average methylation for non-psychiatric controls (CTRL) and schizophrenia patients (SCZ) is reported for each brain area. (B) Epiallelic heterogeneity in each brain region has been assessed employing two different alpha-diversity metrics (number of observed epialleles and shannon index) and compared using one-way analysis of variance (ANOVA) followed by Tukey’s multiple comparison post-hoc test. No statistical significance was found between CTRL and SCZ groups either for observed species or for Shannon index (data not shown). Results are represented as mean ± standard error. Different letters indicate statistically significant differences among brain areas (Observed epialleles metric: HIPP vs DLPFC p = 0.16; HIPP vs CB p = 0.003; DLPFC vs CB p = 0.003; Shannon index: HIPP vs DLPFC p = 0.69; HIPP vs CB p = 0.003; DLPFC vs CB p = 0.003). (C) DAO epiallelic composition is reported in Bray Curtis-based 2D Principal Coordinate Analysis (PCoA) plot. Analysis of similarities (ANOSIM) with 999 permutations was used to detect the statistical significant differences in epialleles distribution among brain areas, grouping together controls and patients with schizophrenia. PC1 and PC2 in PCoA plot explained the percentage of the observed variance. On the top right, p-values and R are reported. No significant differences in any brain area were observed by comparing CTRL and SCZ groups (data not shown).
Figure 3
Figure 3
Methylation analyses at the G72 promoter region. (A) G72 putative regulatory upstream region (white box), exons (black box) and first intron (grey box) is shown. Arrow with +1 denotes the transcriptional start site. Each CpG site is indicated with vertical bars and horizontal arrows represents primers position. Gene sequence was retrieved by Ensemble database accession number: DAOA ENSG00000182346. (B) Methylation average at the three analyzed CpG sites is reported as comparison between CTRL and SCZ groups in all brain regions. Data are shown as means ± standard error (SEM). (C) Average methylation in non-psychiatric controls (CTRL; black circles) and in patients with schizophrenia (SCZ; open circles) is reported for all analyzed brain areas. (D) Average number of methyl-C at non-CpG sites and at CpG sites per each molecule is reported for all areas and for both groups. The percent values of non-CpG methylation is reported in Table S2. (E) G72 mRNA expression levels in the hippocampus, DLPFC and cerebellum of control and schizophrenia patients were not detectable (N.D.) by quantitative RT-PCR (up to 45 cycles). All data are shown as the average ± standard error of the mean (SEM).
Figure 4
Figure 4
SR methylation and expression analyses. (A) CpG-rich SR gene structure is reported with the white box, black box and grey box representing the putative regulatory upstream region, first exon and first intron, respectively. Transcriptional start site is indicated by the black arrow. Gene sequence was retrieved by Ensemble database accession number: SRR ENSG00000167720. (B) Average methylation at single CpG sites for each brain region is denoted in both groups (CTRL and SCZ). (C) SR methylation levels in HIPP, DLPFC and CB areas are shown for controls and schizophrenia patients. (D) The level of methylation at non-CpG and CpG sites in each molecule is shown. The percent values of non-CpG methylation is reported in Table S2. (E) SR mRNA expression levels in the hippocampus, DLPFC and cerebellum of control and schizophrenia patients were detected by quantitative RT-PCR and expressed as 2−ΔCt. All data are shown as the average ± standard error of the mean (SEM).
Figure 5
Figure 5
Methylation and expression studies of the DDO gene. (A) DDO gene structure is reported with the indication of the putative regulatory upstream region (white box), first exon (black box), first intron (grey box) and the transcriptional start site (black arrow, +1). The relative positions of each CpG site are indicated by vertical bars. Primer positions are shown as horizontal arrows. Gene sequence was retrieved by Ensemble database accession number: DDO ENSG00000203797. (B) Methylation levels at single CpG sites in all brain regions and for controls and patients affected by schizophrenia are reported. (C) DDO average methylation in CB area is shown for CTRL and SCZ groups. Data on methylation levels in HIPP and DLPFC for CTRL and SCZ subjects, previously reported in Nuzzo et al. 2016 (ref. in this manuscript), are here shown only in order to provide a complete overview about the DDO methylation state in different brain areas. (D) The average level of methylation at non-CpG and CpG sites in each molecule is shown. The percent values of non-CpG methylation is reported in Table S2. (E) DDO mRNA expression levels in the hippocampus, DLPFC and cerebellum of control and schizophrenia patients were detected by quantitative RT-PCR and expressed as 2−ΔCt. All data are shown as the average ± standard error of the mean (SEM). *Indicates p < 0.05.
Figure 6
Figure 6
Epiallele composition analyses in DDO. (A) Heatmaps show the epiallelic classes abundance in each brain area (hippocampus = HIPP, dorso-lateral prefrontal cortex = DLPFC and cerebellum = CB) and for both groups (non-psychiatric controls = CTRL and patients with schizophrenia = SCZ). The color scale (from red to violet) indicates the frequency of each epiallelic class. On the top of the graph, the average methylation for CTRL and SCZ groups is reported for each brain area. (B) Two alpha diversity metrics, observed epialleles and Shannon index, are reported. Statistical differences, indicated by different letters, were assessed using one-way analysis of variance (ANOVA) followed by Tukey’s multiple comparison post-hoc test (Observed epialleles metric: HIPP vs DLPFC p = 0.02; HIPP vs CB p = 0.003; DLPFC vs CB p = 0.003; Shannon index metric: HIPP vs DLPFC p = 0.006; HIPP vs CB p = 0.003; DLPFC vs CB p = 0.003;). No statistically significant differences were observed between CTRL and SCZ groups (data not shown). Results are represented as mean ± standard error of the mean (SEM). (C) DDO epiallelic composition is reported in Bray Curtis-based 2D Principal Coordinate Analysis (PCoA) plot. Analysis of similarities (ANOSIM) with 999 permutations was used to detect the statistical significant differences in epialleles distribution among brain areas, grouping together controls and patients with schizophrenia. PC1 and PC2 in PCoA plot explained the percentage of the observed variance. On the top right, p-values and R are reported. No significant differences in any brain area were observed by comparing CTRL and SCZ groups (data not shown).

Similar articles

Cited by

References

    1. Errico. F, Napolitano F, Nistico R, Usiello A. New insights on the role of free D-aspartate in the mammalian brain. Amino Acids. 2012;43(5):1861–1871. doi: 10.1007/s00726-012-1356-1. - DOI - PubMed
    1. Mothet JP, Le Bail M, Billard JM. Time and space profiling of NMDA receptor co-agonist functions. J Neurochem. 2015;135:210–225. doi: 10.1111/jnc.13204. - DOI - PubMed
    1. Wolosker H, Balu DT, Coyle JT. The Rise and Fall of the d-Serine-Mediated Gliotransmission Hypothesis. Trends in neurosciences. 2016;39:712–721. doi: 10.1016/j.tins.2016.09.007. - DOI - PMC - PubMed
    1. D-Amino Acids: Physiology, Metabolism, and Application (Editors: Yoshimura, T., Nishikawa, T. & Homma H.) (Springer Japan, 2016)
    1. Hashimoto A, Oka T. Free D-aspartate and D-serine in the mammalian brain and periphery. Prog Neurobiol. 1997;52:325–353. doi: 10.1016/S0301-0082(97)00019-1. - DOI - PubMed

Publication types