. 2018 Jul 5;8(1):10160.
doi: 10.1038/s41598-018-28393-y.

Characterization and Validation of a Human 3D Cardiac Microtissue for the Assessment of Changes in Cardiac Pathology

Affiliations

Characterization and Validation of a Human 3D Cardiac Microtissue for the Assessment of Changes in Cardiac Pathology

Caroline R Archer et al. Sci Rep. .

Abstract

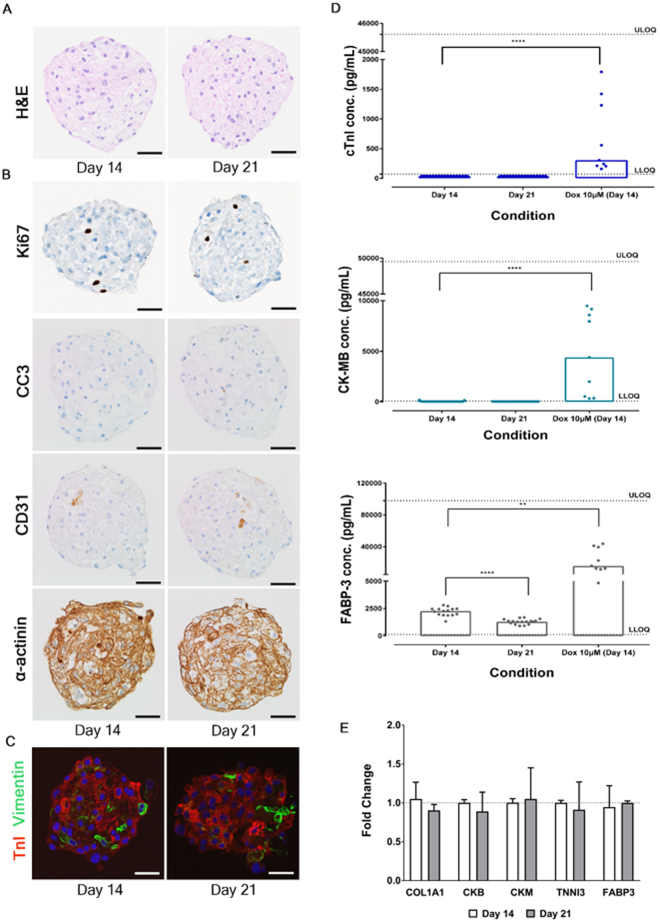
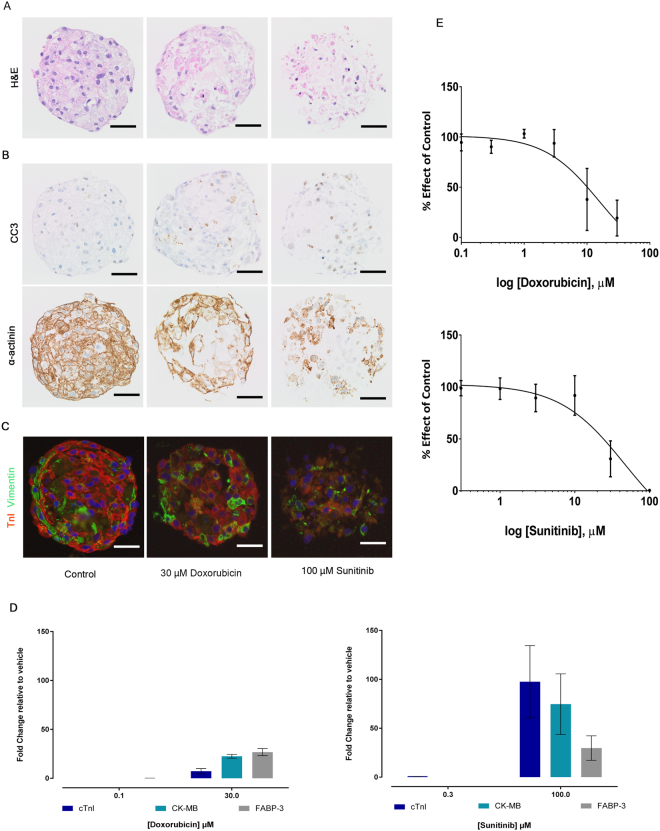
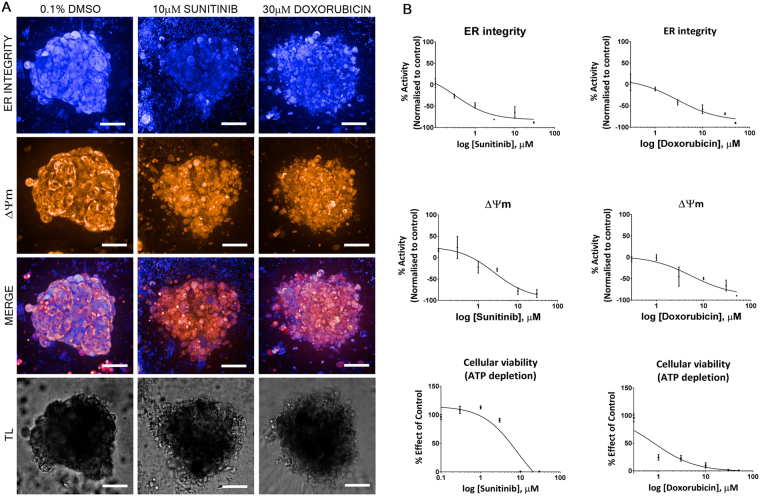
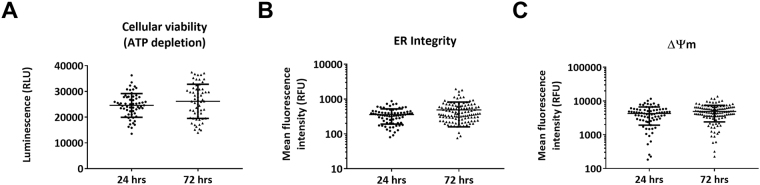
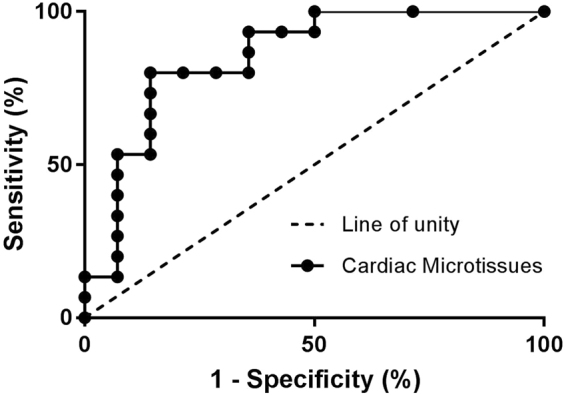
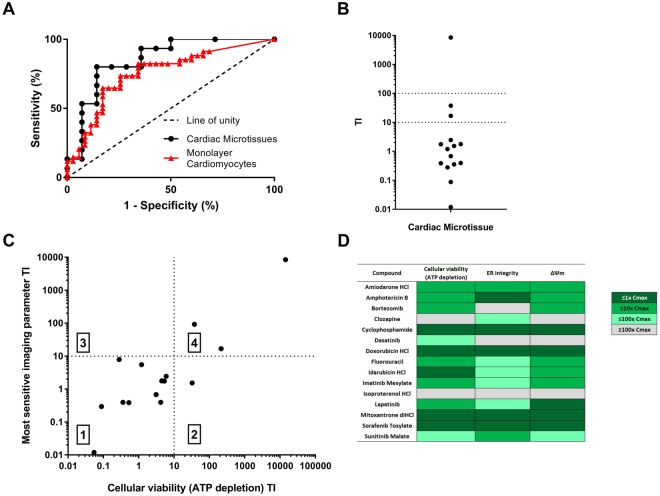
Pharmaceutical agents despite their efficacy to treat disease can cause additional unwanted cardiovascular side effects. Cardiotoxicity is characterized by changes in either the function and/or structure of the myocardium. Over recent years, functional cardiotoxicity has received much attention, however morphological damage to the myocardium and/or loss of viability still requires improved detection and mechanistic insights. A human 3D cardiac microtissue containing human induced pluripotent stem cell-derived cardiomyocytes (hiPS-CMs), cardiac endothelial cells and cardiac fibroblasts was used to assess their suitability to detect drug induced changes in cardiac structure. Histology and clinical pathology confirmed these cardiac microtissues were morphologically intact, lacked a necrotic/apoptotic core and contained all relevant cell constituents. High-throughput methods to assess mitochondrial membrane potential, endoplasmic reticulum integrity and cellular viability were developed and 15 FDA approved structural cardiotoxins and 14 FDA approved non-structural cardiotoxins were evaluated. We report that cardiac microtissues provide a high-throughput experimental model that is both able to detect changes in cardiac structure at clinically relevant concentrations and provide insights into the phenotypic mechanisms of this liability.


Conflict of interest statement

The authors declare no competing interests.

Figures

Figure 1
Figure 1
Cellular composition, morphology and cardiac biomarker expression are stable in microtissues over time at Day 14 and Day 21. (A) Representative images of haematoxylin and eosin (H&E) stained microtissues. (B) Representative immunohistochemistry (IHC) images of microtissues immunostained with Ki67, cleaved caspase-3 (CC3), CD31, and alpha-actinin (α-actinin). (C) Representative immunofluorescence (IF) images of microtissues dual labelled with troponin I (TnI) and vimentin. All morphology data evaluated a minimum of 15 microtissues per time point. Scale bar represents 50 µm. (D) Soluble biomarker data showing unstimulated basal levels and stimulated (10 µM doxorubicin) of cardiomyocyte structural proteins cardiac troponin I (cTnI), Creatine Phosphokinase-MB (CK-MB) and Fatty Acid Binding Protein-3 (FABP-3) released in media on Day 14 and Day 21. Data represents individual and median ± SEM (unstimulated: n = >34, on 3 independent cardiac microtissue preparations, stimulated: n = 3, on 3 independent cardiac microtissue preparations). (E) qRT-PCR data showing expression of cardiomyocyte biomarker genes and collagen 1 A up to Day 21 (grey bar), relative to the Day 14 (open bar) control in cardiac microtissues. Each bar represents the mean ± SEM (n = 308 on 3 independent cardiac microtissue preparations). **p < 0.01, ****p < 0.0001, LLOQ; lower level of quantification, ULOQ; upper level of quantification, dox; doxorubicin.
Figure 2
Figure 2
Treatment with known structural cardiotoxins for 24 hours results in significant histopathological changes and loss of key structural proteins. (A) Representative images of H&E stained microtissues showing degenerative histopathological changes. (B) Representative IHC images showing an increase in CC3 expression and reduced expression of the cardiomyocyte structural protein α-actinin in drug treated microtissues. (C) Representative IF images of microtissues dual labelled with troponin I (TnI) and vimentin showing the reduced expression. All morphology data evaluated a minimum of 15 microtissues per treatment. (D) Soluble biomarker data (blue: cTnI, green: CK-MB and grey: FABP-3) following 0.3 and 100 µM sunitinib and 0.1 and 30 µM doxorubicin (n = 3 on 3 independent cardiac microtissue preparations, mean ± SD). (E) Concentration-effect curves showing the effect of sunitinib and doxorubicin on cell viability (ATP depletion) in cardiac microtissues after 24 hours (n = 8 on 4 independent cardiac microtissue preparations, mean ± SEM). Scale bar represents 50 µm.
Figure 3
Figure 3
Development of high-throughput imaging and cellular viability assays for the detection of structural cardiotoxicity. (A) Representative transmitted light and fluorescent image of cardiac microtissues treated with vehicle (0.1% DMSO (v/v)), 10 µM sunitinib or 30 µM doxorubicin for 72 hours. Cardiac microtissues stained with ER tracker (ER integrity) or TMRM (ΔΨm). Scale bar represents 100 µm (n = 4 on 3 independent cardiac microtissue preparations). (B) Typical non-cumulative concentration-effect curves generated for ER Integrity, ΔΨm and cellular viability (ATP depletion) of cardiac microtissues treated with either sunitinib or doxorubicin (n = 4 on 3 independent cardiac microtissue preparations, mean ± SEM). TL; transmitted light, ΔΨm; mitochondrial membrane potential.
Figure 4
Figure 4
Imaging and cellular viability parameters are stable over 72 hours. Comparison of (A) Cellular viability (ATP depletion), (B) ER integrity or (C) ΔΨm average fluorescence intensity at Day 14 + 24 hours versus Day 14 + 72 hours in cardiac microtissues (n ≥ 20 on >3 independent cardiac microtissue preparations, mean ± SD). Statistics by two-tailed t-test, no statistical significance observed for cellular viability and ΔΨm (P > 0.05). A significant difference between time points was observed for ER integrity parameter (P ≤ 0.01). ΔΨm; mitochondrial membrane potential.
Figure 5
Figure 5
Cardiac microtissues are predictive of structural cardiotoxicity. The lowest geometric mean obtained (IC50) for cellular viability (ATP depletion), ER integrity or ΔΨm were subjected to ROC curve analysis. The dashed line of unity shows the results of random assignments of structural cardiotoxicity (n > 4 on 3 independent cardiac microtissue preparations).
Figure 6
Figure 6
Imaging and cellular viability parameters allow structural cardiotoxicity to be detected at therapeutically relevant concentrations and facilitates molecular phenotypic insights. (A) The lowest geometric mean obtained (IC50) for cellular viability (ATP depletion), ER integrity or ΔΨm was subjected to ROC analysis. Black circles: cardiac microtissues, red triangles: monolayer cardiomyocytes. The dashed line shows the results of random assignments of structural cardiotoxicity (n > 4 on 3 independent cardiac microtissue preparations). (B) Potency values (n > 4 on 3 independent cardiac microtissue preparations) obtained in cardiac microtissues were normalized to the total Cmax of each compound and expressed as a ratio (TI). A value of one or below indicates the IC50 for an assay was either at or below Cmax concentrations, whereas a value >1 indicates the IC50 for an assay was above Cmax concentrations. The plot shows the TI which compounds were detected at. The dotted lines represent hundred times and ten times Cmax. (C) Distribution maps between cellular viability (ATP depletion) and imaging parameters in cardiac microtissues. The geometric mean IC50 (n > 4 on 3 independent cardiac microtissue preparations) obtained in either ATP depletion or an imaging parameter (ER integrity or ΔΨm) were normalized to Cmax (TI). The plot shows the number of compounds detected by both, ATP depletion and an imaging parameter, quadrant 1, an imaging parameter alone, quadrant 2, ATP depletion alone, quadrant 3, or compounds not detected at or below ten times Cmax concentrations, quadrant 4. (D) Classification of compounds into thematic mechanisms. Compounds were classified into categories based on the pattern of response in each assay in relation to the Cmax concentration. This allowed compound effects to be separated into those occurring at 1, 10, and 100 times Cmax concentrations.

References

    1. Roth GA, et al. Global and regional patterns in cardiovascular mortality from 1990 to 2013. Circulation. 2015;132:1667–1678. doi: 10.1161/CIRCULATIONAHA.114.008720. - DOI - PubMed
    1. Cook D, et al. Lessons learned from the fate of AstraZeneca’s drug pipeline: a five-dimensional framework. Nat Rev Drug Discov. 2014;13:419–431. doi: 10.1038/nrd4309. - DOI - PubMed
    1. Kawecka-Jaszcz K, Bednarek A. The management of cancer patients with heart disease. Przegl Lek. 2012;69:82–86. - PubMed
    1. Waring MJ, et al. An analysis of the attrition of drug candidates from four major pharmaceutical companies. Nat Rev Drug Discov. 2015;14:475–486. doi: 10.1038/nrd4609. - DOI - PubMed
    1. Albini A, et al. Cardiotoxicity of anticancer drugs: the need for cardio-oncology and cardio-oncological prevention. J Natl Cancer Inst. 2010;102:14–25. doi: 10.1093/jnci/djp440. - DOI - PMC - PubMed

Publication types

MeSH terms