. 2018 Nov;25(10):1808-1822.
doi: 10.1038/s41418-018-0149-9. Epub 2018 Jul 5.

BMP9 counteracts the tumorigenic and pro-angiogenic potential of glioblastoma

Affiliations

BMP9 counteracts the tumorigenic and pro-angiogenic potential of glioblastoma

Elena Porcù et al. Cell Death Differ. 2018 Nov.

Abstract

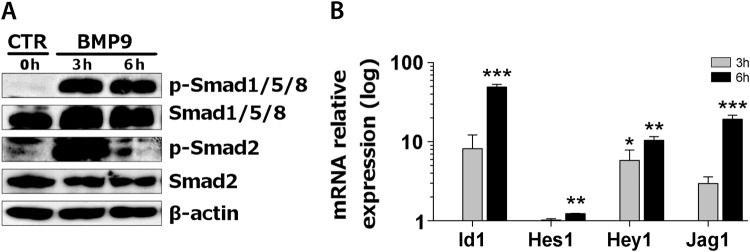
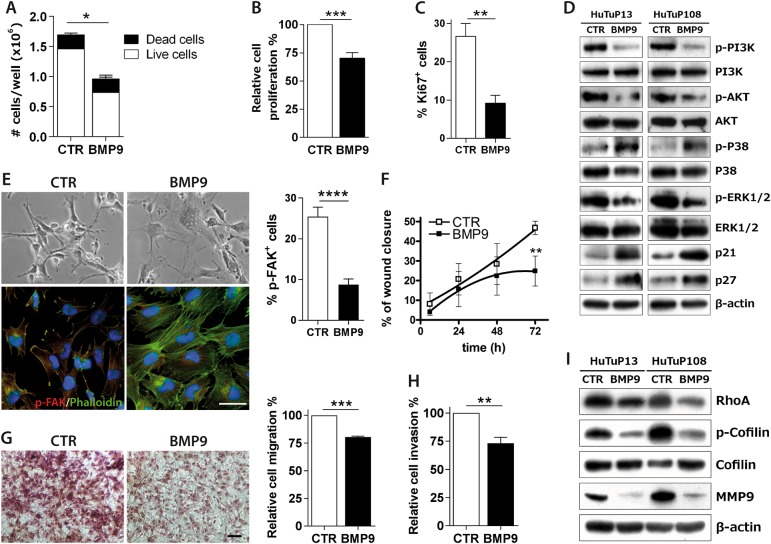
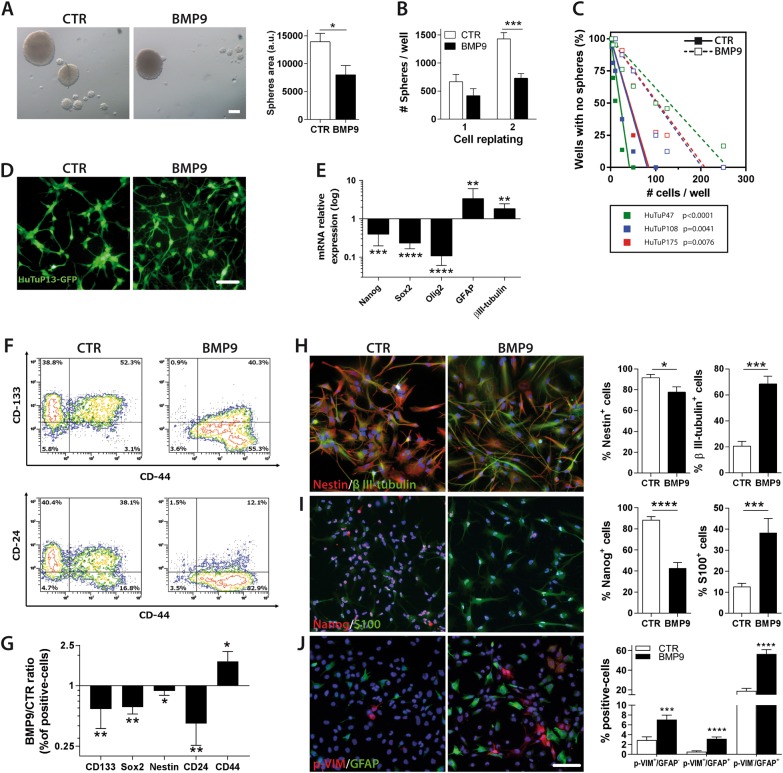
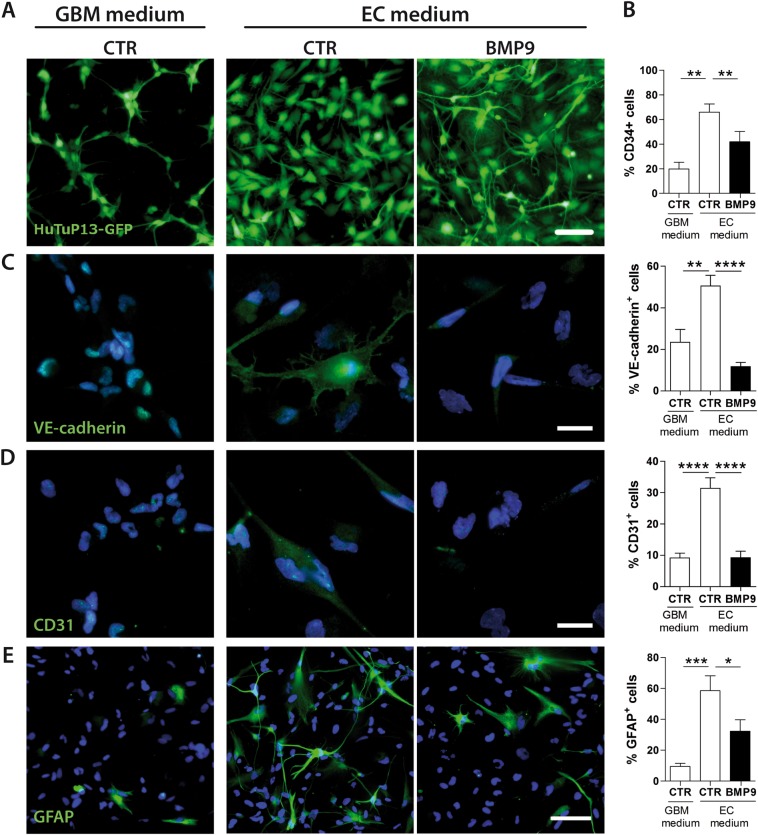
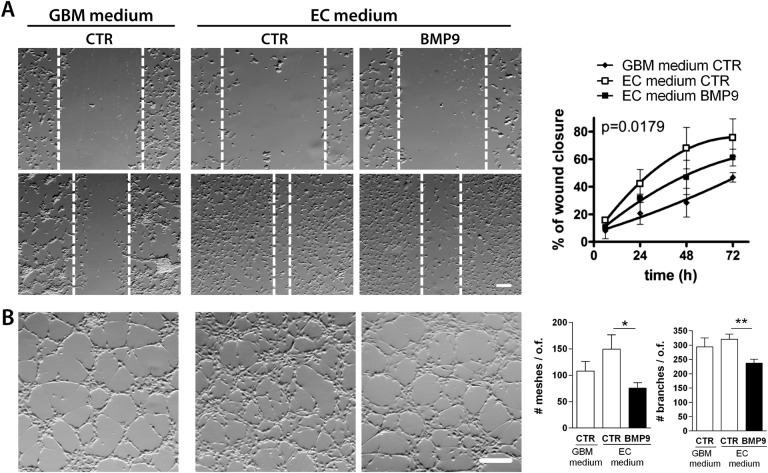
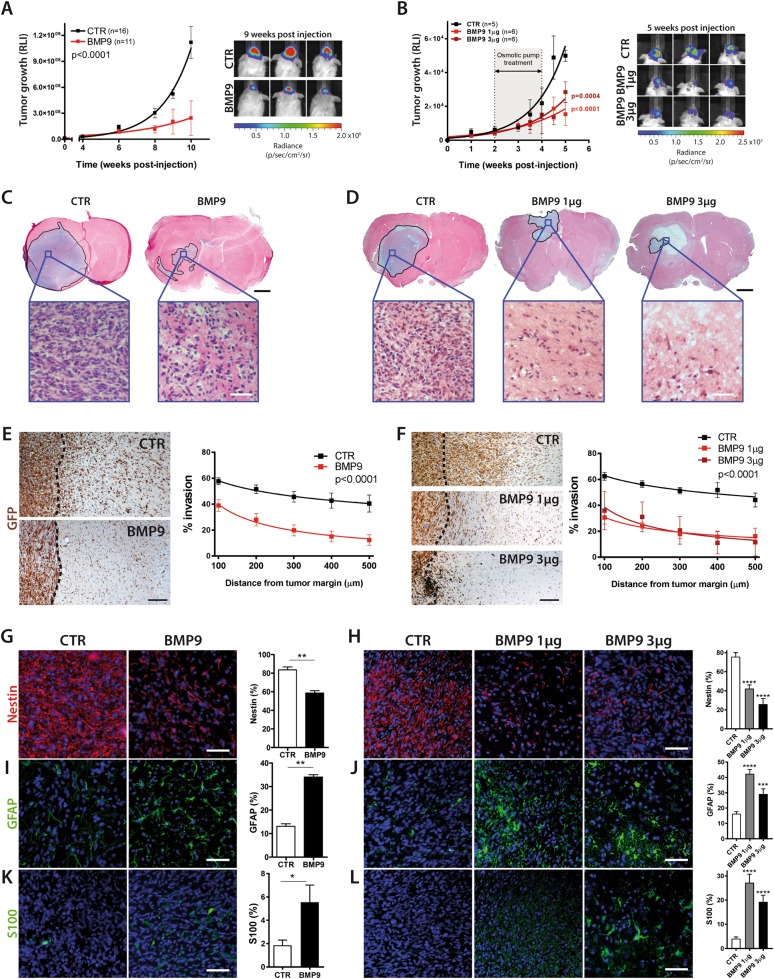
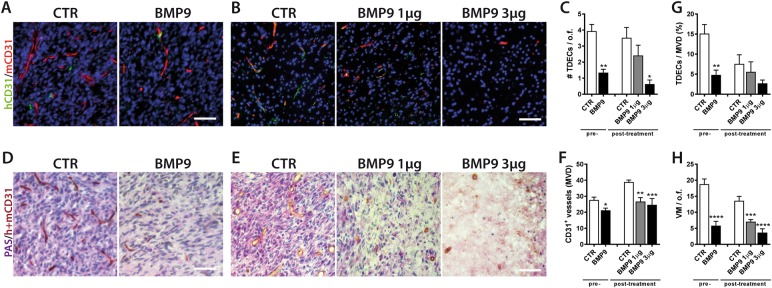
Glioblastoma multiforme (GBM) is a highly vascularized and aggressive brain tumor, with a strong ability to disseminate and invade the surrounding parenchyma. In addition, a subpopulation of GBM stem cells has been reported to possess the ability to transdifferentiate into tumor-derived endothelial cells (TDECs), supporting the resistance to anti-angiogenic treatments of newly formed blood vessels. Bone Morphogenetic Protein 9 (BMP9) is critically involved in the processes of cancer cell differentiation, invasion and metastasis, representing a potential tool in order to impair the intrinsic GBM aggressiveness. Here we demonstrate that BMP9 is able to trigger the activation of SMADs in patient-derived GBM cells, and to strongly inhibit proliferation and invasion by reducing the activation of PI3K/AKT/MAPK and RhoA/Cofilin pathways, respectively. Intriguingly, BMP9 treatment is sufficient to induce a strong differentiation of GBM stem-like cells and to significantly counteract the already reported process of GBM cell transdifferentiation into TDECs not only in in vitro mimicked TDEC models, but also in vivo in orthotopic xenografts in mice. Additionally, we describe a strong BMP9-mediated inhibition of the whole angiogenic process engaged during GBM tumor formation. Based on these results, we believe that BMP9, by acting at multiple levels against GBM cell aggressiveness, can be considered a promising candidate, to be further developed, for the future therapeutic management of GBM.


Conflict of interest statement

The authors declare that they have no conflict of interest.

Figures

Fig. 1
Fig. 1
Molecular signaling activated by BMP9 treatment in GBM primary cells. Immunoblotting of indicated proteins following 3–6 h of BMP9 treatment at 30 ng/ml (HuTuP175). a Relative mRNA expression of SMADs target genes relative to untreated cells (0 h) (HuTuP108/175). Data are presented as mean ± S.E.M of N = 3 independent experiments (b). *p < 0.05; **p < 0.01; ***p < 0.001 by paired t-test
Fig. 2
Fig. 2
BMP9 effects on GBM invasiveness in vitro. Trypan blue count after BMP9 treatment at 30 ng/ml every other day for 10 days (HuTuP82/83/187) (a). Cell proliferation evaluated by MTT assay, after further 72 h of BMP9 treatment at 30 ng/ml added to previous 10 day exposure (HuTuP82/83) (b). Quantification of the percentage of Ki67+ cells treated with BMP9 30 ng/ml every other day for 10 days (HuTuP83/108) (c). Immunoblotting of indicated proteins following 24 h of BMP9 treatment at 30 ng/ml (HuTuP13/108) (d). Representative images of HuTuP13 cells treated with BMP9 30 ng/ml every other day for 10 days, captured by optical microscope (original magnification 10×, scale bar = 100μm, upper panel) and marked with phalloidin-FITC (green) and p-FAK antibody (red). Cell nuclei have been counterstained with DAPI (blue) (original magnification 20×, scale bar = 50μm, lower panel). Relative quantification of p-FAK+ cells (right graph) (e). Quantification of wound closure of control or BMP9-treated 30 ng/ml during time (HuTuP10/83). Statistical significance by paired t-test at 72 h (f). Transwell migration assay of GBM primary cells (HuTuP83/13/82/175) treated with BMP9 30 ng/mL for 24 h, and stained with Crystal violet. Representative images (original magnification 10×, scale bar = 100 μm, left) and relative quantification of the absorbance at 560 nm of solubilized Crystal Violet (right) (g). Percentage of cell invasion (HuTuP10/13) measured by the Cultrex transwell assay, after 48 h of treatment (h). Immunoblotting of indicated proteins following 10 days of BMP9 treatment at 30 ng/ml (HuTuP13/108) (i). Data are presented as mean ± S.E.M. of N ≥ 3 independent experiments. *p < 0.05; **p < 0.01; ***p < 0.001; ****p < 0.0001 by t-test
Fig. 3
Fig. 3
Effects of BMP9 on GBM cell stemness and differentiation. Representative images of neurospheres formed by GBM cells plated as single cells after BMP9 30 ng/ml pre-treatment every other day and controls, (original magnification 4×, scale bar = 20 μm, left), and relative measurement of sphere areas (HuTuP82/83/174, right; a.u. = arbitrary units) (a). Quantification of the number of spheres generated after the first and the second re-plating of control and treated GBM cells (HuTuP83/187) (b). Limiting dilution analysis of the frequency of control (solid lines) and BMP9-treated (dotted lines) GBM cells able to generate neurospheres (HuTuP47: f = 1/24 versus f = 1/163 in control and BMP9 treated cells, respectively; HuTuP108: f = 1/47 versus f = 1/122; HuTuP175: f = 1/49 versus f = 1/123) (c). Changes in cell morphology induced by BMP9 treatment for 10 days are highlighted by representative images of GFP-transduced cells (HuTuP13) (original magnification 10×, scale bar = 100 μm) (d). Relative mRNA expression of stem cell and differentiation markers after 10 days of BMP9 treatment at 30 ng/ml every other day, respect to control cells (HuTuP10/13/82/83/175) (e). Representative contour plots of GBM cells treated with BMP9 at 30 ng/ml every other day for 10 days and analyzed by flow cytometry (HuTuP47) (f). Percentage of CD133+, Sox2+, Nestin+, CD24+ or CD44+ cell subpopulations detected after 10 days of treatment at 30 ng/ml every other day and expressed as the ratio between BMP9-treated and control samples (HuTuP10/47/82/83/174) (g). Representative immunofluorescence staining of GBM cells for Nestin/β III-tubulin (red and green respectively, h), Nanog/S100 (red and green respectively, i), p-VIM/GFAP (red and green respectively, j), and relative quantifications (right panels), after 10 days of BMP9 treatment at 30 ng/ml every other day (original magnification 20×, scale bar = 50 μm) (HuTuP13/47/83/108/174). Cell nuclei have been counterstained with DAPI (blue). Data are presented as mean ± S.E.M. of N ≥ 3 independent experiments. *p < 0.05; **p < 0.01; ***p < 0.001; ****p < 0.0001, by paired t-test
Fig. 4
Fig. 4
Endothelial commitment is impaired by BMP9. Representative images showing cell morphology of GFP-transduced cells (HuTuP13) affected by EC medium and BMP9 treatment at 30 ng/ml every other day for 10 days (original magnification 10×, scale bar = 100 μm) (a). Flow cytometry analysis of CD34+ after 10 days of treatment with BMP9 at 30 ng/ml every other day (HuTuP13/83/108/175) (b). Representative images (HuTuP174) of immunofluorescence staining for VE-cadherin (green, c), CD31 (green, d), GFAP (green, e) and relative quantifications (right panels), after 10 days of treatment at 30 ng/ml every other day (original magnification 20×, scale bar = 50 μm). Data are presented as mean ± S.E.M. of N ≥ 3 independent experiments. *p < 0.05; **p < 0.01; ***p < 0.001; ****p < 0.001 by paired t-test or One-way ANOVA
Fig. 5
Fig. 5
BMP9 affects endothelial properties of GBM-TDECs. Representative images of wound assay (7× magnification, scale bar = 150 μm, left) and relative quantification (HuTuP10/83, right) of BMP-treated (30 ng/ml) EC-transdifferentiated GBM cells (a). Representative images (7× magnification, scale bar = 150 μm, left) and relative quantification of the number of meshes and branches (right panels) of BMP9 treated (30 ng/mL) EC-transdifferentiated GBM cells (HuTuP13/175) seeded on Matrigel to allow the generation of vascular-like structures (b). o.f. = optical field. Data are presented as mean ± S.E.M. of N ≥ 3 independent experiments. *p < 0.05; **p < 0.01 by paired t-test or One-way ANOVA
Fig. 6
Fig. 6
BMP9 effects on GBM growth and stemness in orthotopic murine xenografts. Tumor growth represented by bioluminescence quantification for N = 16 control versus N = 11 BMP9 pre-treated mice (left panel) and representative images (3 mice/experimental group) of the bioluminescence signals generated by human GBM tumors growing in NOD/SCID mice orthotopically injected with GFP-LUC transduced primary cells (HuTuP83). The figure shows mice injected with cells pre-treated with BMP9 for 10 days in vitro versus control cells (right panel). (a) Bioluminescence quantification for control established tumors (N = 5) versus N = 6 BMP9 1 µg and N = 6 BMP9 3 µg treated mice with osmotic pumps (left panel). Representative images of brain bioluminescence in control tumors versus BMP9-treated mice (right panel) (b). Hematoxylin and Eosin staining of total brain sections of human GBM xenografts. The selected regions represent the tumor area (upper images, original magnification 1×, scale bar = 50 μm), with insets showing a 40× magnification (lower, scale bar = 25 μm) (c and d for pre-treatment and post-treatment, respectively). Representative immunohistochemical images of GBM xenograft sections stained for GFP (brown) (original magnification 10×, scale bar = 50 μm) and relative quantification of the % of cells invading adjacent tissues (right panels) (e and f for pre-treatment and post-treatment, respectively). GBM xenograft sections stained for Nestin (red, gh), GFAP (green, ij), S100 (green, kl) (original magnification 20×, scale bar = 50μ m) and relative quantification (right panels) (g, i, k and h, j, l for pre-treatment and post-treatment, respectively). Data are presented as mean ± S.E.M. *p < 0.05; **p < 0.01; ***p < 0.001; ****p < 0.001 by paired t-test or One-way ANOVA
Fig. 7
Fig. 7
BMP9 negatively affects TDEC formation and tumor angiogenesis in vivo. Representative immunofluorescence stainings of tumor sections for human CD31 (hCD31, green) and mouse CD31 (mCD31, red) (original magnification 20×, scale bar = 50 μm), in pre-treated (a) and post-treated (b) mice. Measurement of the number of TDECs/optical field (c). Representative immunohistochemical images of human and murine CD31+ vessels (brown) combined with PAS staining (purple) (original magnification 40×, scale bar = 25 μm) (d and e for pre-treatment and post-treatment, respectively) and relative quantification of the microvascular density (MVD) (f). Bar graph reporting the percentage of TDECs on the total number of microvessels (g). Quantification of vascular mimicry expressed as number of PAS+/CD31- microvessels/optical field (h). o.f. = optical field. Data are presented as mean ± S.E.M. *p < 0.05; **p < 0.01; ***p < 0.001; ****p < 0.001 by paired t-test or One-way ANOVA

References

    1. Blumenthal DT, Gorlia T, Gilbert MR, Kim MM, Burt Nabors L, Mason WP, et al. Is more better? The impact of extended adjuvant temozolomide in newly diagnosed glioblastoma: a secondary analysis of EORTC and NRG Oncology/RTOG. Neuro Oncol. 2017;19:1119–26. doi: 10.1093/neuonc/nox025. - DOI - PMC - PubMed
    1. Qazi MA, Vora P, Venugopal C, Sidhu SS, Moffat J, Swanton C, et al. Intratumoral heterogeneity: pathways to treatment resistance and relapse in human glioblastoma. Ann Oncol J Eur Soc Med Oncol. 2017;28:1448–56. doi: 10.1093/annonc/mdx169. - DOI - PubMed
    1. Beier D, Schulz JB, Beier CP. Chemoresistance of glioblastoma cancer stem cells—much more complex than expected. Mol Cancer. 2011;10:128. doi: 10.1186/1476-4598-10-128. - DOI - PMC - PubMed
    1. Li H, Liu Y, Jiao Y, Guo A, Xu X, Qu X, et al. Resveratrol sensitizes glioblastoma-initiating cells to temozolomide by inducing cell apoptosis and promoting differentiation. Oncol Rep. 2015;35:343–51. doi: 10.3892/or.2015.4346. - DOI - PubMed
    1. Persano L, Pistollato F, Rampazzo E, Della Puppa A, Abbadi S, Frasson C, et al. BMP2 sensitizes glioblastoma stem-like cells to Temozolomide by affecting HIF-1α stability and MGMT expression. Cell Death Dis. 2012;3:e412. doi: 10.1038/cddis.2012.153. - DOI - PMC - PubMed

Publication types

MeSH terms

Substances

LinkOut - more resources