. 2018 Jul 5;8(1):10204.
doi: 10.1038/s41598-018-28161-y.

Spontaneous reactivation of latent HIV-1 promoters is linked to the cell cycle as revealed by a genetic-insulators-containing dual-fluorescence HIV-1-based vector

Affiliations

Spontaneous reactivation of latent HIV-1 promoters is linked to the cell cycle as revealed by a genetic-insulators-containing dual-fluorescence HIV-1-based vector

Yik Lim Kok et al. Sci Rep. .

Abstract

Long-lived latently HIV-1-infected cells represent a barrier to cure. We developed a dual-fluorescence HIV-1-based vector containing a pair of genetic insulators flanking a constitutive fluorescent reporter gene to study HIV-1 latency. The protective effects of these genetic insulators are demonstrated through long-term (up to 394 days) stable fluorescence profiles in transduced SUP-T1 cells. Analysis of 1,941 vector integration sites confirmed reproduction of HIV-1 integration patterns. We sorted monoclonal cells representing latent HIV-1 infections and found that both vector integration sites and integrity of the vector genomes influence the reactivation potentials of latent HIV-1 promoters. Interestingly, some latent monoclonal cells exhibited a small cell subpopulation with a spontaneously reactivated HIV-1 promoter. Higher expression levels of genes involved in cell cycle progression are observed in these cell subpopulations compared to their counterparts with HIV-1 promoters that remained latent. Consistently, larger fractions of spontaneously reactivated cells are in the S and G2 phases of the cell cycle. Furthermore, genistein and nocodazole treatments of these cell clones, which halted cells in the G2 phase, resulted in a 1.4-2.9-fold increase in spontaneous reactivation. Taken together, our HIV-1 latency model reveals that the spontaneous reactivation of latent HIV-1 promoters is linked to the cell cycle.


Conflict of interest statement

K.J.M. has received travel grants and honoraria from Gilead Sciences, Roche Diagnostics, Tibotec, Bristol-Myers Squibb, and Abbott; the University of Zurich has received research grants from Gilead, Roche, and Merck Sharp & Dohme for studies that K.J.M. serves as principal investigator, and advisory board honoraria from Gilead Sciences. All other authors declare no competing interests.

Figures

Figure 1
Figure 1
Transduction of SUP-T1 cells with LTatC[M], a dual-fluorescence HIV-1-based vector. (a) Schematic diagram of LTatC[M]. The expression of Cerulean is driven by HIV-1 5′ long terminal repeat (LTR) and supported by HIV-1 transactivator of transcription (Tat) via a positive feedback loop. The expression of mCherry is driven by the constitutive human elongation initiation factor 4A1 (heIF4A1) promoter and the entire cassette is protected from position-effect variegation by a pair of genetic insulators: two copies of the chicken hypersensitive site 4 core (cHS4) and eight copies of synthetic matrix attachment region (sMAR). ψ: HIV-1 packaging signal; RRE; HIV-1 Rev response element; IRES: Internal ribosomal entry site; TetO: Tet operator; WPRE: Woodchuck hepatitis virus post-transcriptional regulatory element. (b) Flow cytometric sorting strategy and purity of transduced SUP-T1 cell populations. SUP-T1 cells transduced with LTatC[M] were sorted 10 days post transduction into four cell populations: single Cerulean positive (C+), double positive (DP), single mCherry positive (M+), and double negative (DN). DP cells were divided equally and cultured in two flasks. A portion of M+ cells was expanded in culture for 39 days and then activated with TNF-α and SAHA for one day prior to sorting into cell populations that became Cerulean+ (MTSC+) and that remained Cerulean (MTSC−). (c) Fluorescence profiles of the four cell populations that arose from transduction of SUP-T1 cells with LTatC[M]: DN, M+, DP, and C+, were measured with flow cytometry daily for 10 days. Each datapoint represents the mean of two independent transductions (n = 2) and error bars depict standard error means. Some error bars are within datapoints. (d) DN, C+, and M+ cell populations sorted from LTatC[M]-tranduced SUP-T1 cells were treated with TNF-α and SAHA for one day and the induction of DP cells from these cell populations was measured with flow cytometry. In the case of DN cell population, the induction of C+ and M+ cells was also measured but not distinguished from DP cell induction. The means of two independent measurements (n = 2) are indicated by the heights of the bars and standard error means are indicated by the error bars.
Figure 2
Figure 2
Longitudinal fluorescence profiles of transduced SUP-T1 cell populations. (a) SUP-T1 cells were transduced with LTatC[M] (squares) or a vector variant with no genetic insulators in the mCherry cassette (LTatCM) (triangles). Double positive (DP), single mCherry positive (M+), and double negative (DN) cell populations were sorted 10 days post transduction and their fluorescence profiles were measured with flow cytometry for 191 days post transduction. Shaded symbols depict percentages of cells with the fluorescence initially sorted for whereas open symbols depict percentages of cells that became DN and M+. Each datapoint of the DP data set represents the mean of duplicate cultures (n = 2) and error bars depict standard error means. Some error bars are within datapoints. (b) Longitudinal fluorescence profiles of sorted SUP-T1 cell populations up to 394 days post transduction in a second transduction experiment.
Figure 3
Figure 3
Integration site patterns of LTatC[M] in various SUP-T1 cell populations. (a) Genomic distributions of integrated LTatC[M]. (b) Consensus sequences of 20 nucleotides upstream of 5′LTR. Double negative (DN) is not shown due to low number of integration sites. (c) Transcription orientations of intragenic LTatC[M] relative to its host genes. DP1: double positive replicate 1; DP2: double positive replicate 2; C+: single Cerulean; MTSC+: TNF-α and SAHA-responsive single mCherry positive; MTSC−: TNF-α and SAHA-non-responsive single mCherry positive.
Figure 4
Figure 4
Factors influencing reactivation potentials of latent HIV-1 promoters in TNF-α and SAHA-responsive single mCherry positive (MTSC+) cell clones. (a) Reactivation potentials of latent HIV-1 promoters in TNF-α and SAHA-responsive single mCherry positive (MTSC+) cell clones with different LTatC[M] integration sites were reactivated with TNF-α and SAHA 54–106 days post sorting. The means of at least two independent measurements (n = 2–22) are indicated by the heights of the bars and standard error means are indicated by the error bars. Two-tailed Mann-Whitney U test with 95% confidence level was used to test for statistical significance; *P < 0.05; **P < 0.01. Subscripts 1 and 2 indicate two independent transduction and sorting experiments from which the cell clones were derived. DP: double positive. (b) Gene expression patterns in SUP-T1 cells during the first 24 hours upon infection with an HIV-1-based vector. Median log2 fold changes in expression of genes into which LTatC[M] was found integrated in different MTSC+ cell clones are shown. The majority of the HIV-1 integration process are defined as complete at 18 hours post infection. + and − indicate significant (P < 0.01) upregulation and downregulation in gene expression, respectively, whereas 0 indicates no significant changes in gene expression compared to data at time point 0 hour. Data were obtained from the Patterns of Expression and Analysis of Clusters of HIV/Host interactions (PEACHi) database. Subscripts 1 and 2 indicate two independent transduction and sorting experiments from which the cell clones were derived. (c) Predicted RNA secondary structure of HIV-1 transactivation response element. The RNA secondary structures of HIV-1 transactivation response (TAR) element found in cell clone MTSC1+12 (top) and in the original vector LTatC[M] (bottom) were predicted using CLC Main Workbench 7. Red circle indicates the mutation in the TAR element of MTSC1+12.
Figure 5
Figure 5
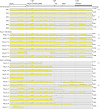
Mutational analysis of Cerulean cassettes of double positive (DP), TNF-α and SAHA-responsive single mCherry positive (MTSC+), and TNF-α and SAHA-non-responsive single mCherry positive (MTSC−) cell clones. Cerulean cassettes of double positive (DP), TNF-α and SAHA-responsive single mCherry positive (MTSC+), and TNF-α and SAHA-non-responsive single mCherry positive (MTSC−) cell clones were amplified and sequenced with the Illumina MiSeq next-generation sequencing technology. The schematic diagram of the LTatC[M] Cerulean cassette is shown on top and sequence coverages are depicted as yellow peaks with the range for each cell clone shown on the right. Point mutations are denoted by red asterisks. The numbers of cell clones with the same integration sites and mutation patterns analysed are shown next to the sequence coverage ranges. Subscripts 1 and 2 indicate two independent transduction and sorting experiments from which the cell clones were derived.
Figure 6
Figure 6
Longitudinal fluorescence profiles of spontaneous double positive (MspC+) cell subpopulations and their counterparts that remained single mCherry positive (MrC−) sorted from TNF-α and SAHA-responsive single mCherry positive (MTSC+) cell clones. TNF-α and SAHA-responsive single mCherry positive (MTSC+) cell clones that exhibited a small subpopulation of spontaneous double positive (MspC+) cells without treatment with activators were sorted by flow cytometry for MspC+ cells and single mCherry cells that did not spontaneously become DP, i.e. non-spontaneous M+ (MrC−). (a) Representative flow cytometric sorting strategy and purity of MspC+ and MrC− cell subpopulations from MTSC1+8 cell clone. (b) Number of genes that had a higher expression level in MspC+ (top) and MrC− (bottom) cell subpopulations and were common between three MTSC+ cell clones with LTatC[M] integrated into EHBP1 and two MTSC+ cell clones with LTatC[M] integrated into CTNND1. (c) Longitudinal percentages of MspC+ cell subpopulations remaining and emerging from sorted MspC+ (shaded circles) and MrC− (open circles), respectively. Solid and dashed horizontal lines indicate the means and ranges of at least five independent measurements (n ≥ 5) of percentages of MspC+ cells in the unsorted parental cell clones. The top three cell clones had the same LTatC[M] integration site in EHBP1 whereas the bottom two cell clones had the same LTatC[M] integration site in CTNND1. Subscripts 1 and 2 indicate two independent transduction and sorting experiments from which the cell clones were derived.
Figure 7
Figure 7
Spontaneous reactivation of latent HIV-1 promoters is linked to the cell cycle. (a) Ratio of percentages of cells in the various phases of the cell cycle in spontaneous double positive (MspC+) to non-spontaneous M+ (MrC−) cell subpopulations. The means of at least four independent measurements (n ≥ 4) are indicated by the heights of the bars and standard error means are indicated by the error bars. (b) Percentages of MspC+ cells upon treatment with genistein (left) and nocodazole (right) in comparison to equally diluted DMSO control (−). The means of five independent measurements (n = 5) are indicated by the heights of the bars and standard error means are indicated by the error bars. Two-tailed Mann-Whitney U test with 95% confidence level was used to test for statistical significance; *P < 0.05; **P < 0.01. Subscripts 1 and 2 indicate two independent transduction and sorting experiments from which the cell clones were derived. MTSC+: TNF-α and SAHA-responsive single mCherry positive.

Similar articles

Cited by

References

    1. Greene WC, Peterlin BM. Charting HIV’s remarkable voyage through the cell: Basic science as a passport to future therapy. Nat. Med. 2002;8:673–680. doi: 10.1038/nm0702-673. - DOI - PubMed
    1. Archin NM, Sung JM, Garrido C, Soriano-Sarabia N, Margolis DM. Eradicating HIV-1 infection: seeking to clear a persistent pathogen. Nat. Rev. Microbiol. 2014;12:750–764. doi: 10.1038/nrmicro3352. - DOI - PMC - PubMed
    1. Laskey SB, Siliciano RF. A mechanistic theory to explain the efficacy of antiretroviral therapy. Nat. Rev. Microbiol. 2014;12:772–780. doi: 10.1038/nrmicro3351. - DOI - PubMed
    1. Ho YC, et al. Replication-competent noninduced proviruses in the latent reservoir increase barrier to HIV-1 cure. Cell. 2013;155:540–551. doi: 10.1016/j.cell.2013.09.020. - DOI - PMC - PubMed
    1. Eriksson S, et al. Comparative analysis of measures of viral reservoirs in HIV-1 eradication studies. PLoS Pathog. 2013;9:e1003174. doi: 10.1371/journal.ppat.1003174. - DOI - PMC - PubMed

Publication types