. 2018 Jun 21:9:336.
doi: 10.3389/fendo.2018.00336. eCollection 2018.

Mechanisms Underlying the Synergistic Action of Insulin and Growth Hormone on IGF-I and -II Expression in Grass Carp Hepatocytes

Affiliations

Mechanisms Underlying the Synergistic Action of Insulin and Growth Hormone on IGF-I and -II Expression in Grass Carp Hepatocytes

Quan Jiang et al. Front Endocrinol (Lausanne). .

Abstract

In mammals, insulin is known to modify growth hormone (GH)-induced IGF-I expression at the hepatic level, which also contributes to the functional crosstalk between energy homeostasis and somatotropic axis. However, the studies on the comparative aspects of this phenomenon are limited and the mechanisms involved have not been fully characterized. Using a serum-free culture of grass carp hepatoctyes, the functional interaction between GH and insulin on hepatic expression of IGF-I and -II was examined in a fish model. In carp hepatocytes, GH could up-regulate IGF-I and -II mRNA expression via the JAK2/STAT5, MEK/ERK and PI3K/Akt pathways. These stimulatory effects were mimicked by insulin via activation of the PI3K/Akt but not MEK/ERK and P38 MAPK cascades. Although insulin did not activate JAK2 and STAT5 at hepatocyte level, insulin-induced IGF-I and -II mRNA expression were highly dependent on the normal functioning of JAK2/STAT5 pathway. In parallel experiments, insulin co-treatment was found to markedly enhance IGF-I and -II responses induced by GH and these potentiating effects were mediated by insulin receptor (InsR) but not IGF-I receptor. Interestingly, co-treatment with GH also enhanced insulin-induced InsR phosphorylation with a current elevation in protein:protein interaction between GH receptor and phosphorylated InsR and these stimulatory effects were noted with further enhancement in STAT5, ERK1/2 and Akt phosphorylation at hepatocyte level. Consistent with these findings, the potentiating effects of GH and insulin co-treatment on IGF-I and -II mRNA expression were found to be suppressed/abolished by inhibiting JAK2/STAT5, MEK/ERK and PI3K/Akt but not P38 MAPK pathways. These results, as a whole, suggest that insulin and GH can act in a synergistic manner in the carp liver to up-regulate IGF-I and -II expression through protein:protein interaction at the receptor level followed by potentiation in post-receptor signaling.

Keywords: grass carp; growth hormone; growth hormone receptor; hepatocytes; insulin; insulin receptor; insulin-like growth factor; signal transduction.


Figures
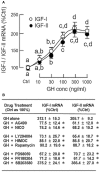
Figure 1
Figure 1
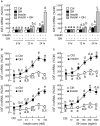
Regulation of IGF-I and -II expression by GH in grass carp hepatocytes. (A) Effects of increasing doses of GH treatment (10–1,000 ng/ml) on IGF-I and -II mRNA expression. (B) JAK2/STAT5, MAPK, and PI3K/Akt pathways in IGF-I and -II mRNA expression induced by GH. For dose dependence experiment, static incubation of hepatocytes was conducted for 24 h with increasing levels of GH as indicated. For parallel experiments to examine the signal transduction involved in GH actions, hepatocytes were treated for 24 h with GH (300 ng/ml) in the presence of the JAK2 inhibitor AG490 (20 μM), STAT5 inhibitor NICO (20 μM), PI3K inhibitor LY294004 (10 μM), Akt inhibitor HIMOC (10 μM), mTOR inhibitor rapamycin (20 nM), MEK1/2 inhibitor PD98059 (10 μM), ERK1/2 inhibitor FR180204 (2 μM), and P38 MAPK inhibitor SB203580 (5 μM), respectively. After treatment, total RNA was extracted from the cell culture and subjected to real-time PCR with primers specific for grass carp IGF-I and -II, respectively. Parallel real-time PCR for 18S RNA was also conducted to serve as the internal control. For IGF data presented (Mean ± SEM), the groups denoted by different letters (for dose dependence) or with asterisks (for signal transduction) represent a significant difference at P < 0.05.
Figure 2
Figure 2
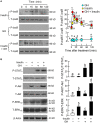
Regulation of IGF-I and -II expression by insulin in grass carp hepatocytes. (A) Effects of increasing doses of insulin treatment (0.01–100 nM) on IGF-I and -II mRNA expression. (B) Insulin stimulation on protein phosphorylation of MEK1/2, ERK1/2, P38 MAPK, and Akt in carp hepatocytes. (C) PI3K/Akt, MAPK, and JAK2/STAT5 pathways in IGF-I and -II mRNA expression induced by insulin. For dose dependence study, hepatocytes were challenged for 24 h with increasing levels of GH as indicated. For parallel experiments to unveil the signal transduction for insulin actions, hepatocytes were treated for 24 h with insulin (10 nM) in the presence of the PI3K inhibitor LY294004 (10 μM), Akt inhibitor HIMOC (10 μM), mTOR inhibitor rapamycin (20 nM), MEK1/2 inhibitor PD98059 (10 μM), ERK1/2 inhibitor FR180204 (2 μM), P38 MAPK inhibitor SB203580 (5 μM), JAK2 inhibitor AG490 (20 μM), and STAT5 inhibitor NICO (20 μM), respectively. For protein phosphorylation, cell lysate was prepared from carp hepatocytes after 15-min treatment with insulin (10 nM) and subjected to Western blot using specific antibodies for the phosphorylated form (P-form) and total protein (T-form) of MEK1/2, ERK1/2, P38 MAPK, and Akt, respectively. The signals for the two forms of target proteins were then quantitated by Image J and expressed as a ratio of P-form/T-form in the bar graphs on the right. In these experiments, parallel blotting of β actin was used as the loading control. For the data presented, the groups denoted by different letters or asterisks represent a significant difference at P < 0.05.
Figure 3
Figure 3
Synergistic action of GH and insulin on IGF-I and -II expression in carp hepatocytes. (A) Time course of GH alone (300 ng/ml), insulin alone (10 nM) and co-treatment with GH (300 ng/ml) and insulin (10 nM) on IGF-I and -II mRNA expression. (B) Dose dependence of increasing levels of insulin (0.01–100 nM) on IGF-I and -II mRNA expression induced by GH treatment (300 ng/ml). (C) As a reciprocal experiment, increasing levels of GH treatment (10–1000 ng/ml) on IGF-I and -II mRNA expression induced by insulin (10 nM) was also tested in carp hepatocytes. In dose-response studies, the duration of drug treatment was fixed at 24 h. In these experiments, total RNA was isolated from hepatocytes after drug treatment and used for real-time PCR for IGF-I and -II mRNA measurement. IGF data for individual groups denoted by different letters represent a significant difference at P < 0.05.
Figure 4
Figure 4
Receptor specificity for insulin potentiation of GH-induced IGF-I and -II expression in carp hepatocytes. (A) RT-PCR for InsRa, InsRb, and IGF1R expression in carp hepatocytes. PCR with primers for respective gene targets was performed in total RNA isolated from carp hepatocytes with (+RT) or without reverse transcription (-RT). Parallel PCR for the same targets in total RNA prepared from the carp pituitary (with reverse transcription) was used as positive control while PCR for β actin was used as the internal control. (M: Size markers for PCR products) (B) Insulin treatment on protein phosphorylation of InsR in carp hepatocytes. Cell lysate was prepared from hepatocytes after 15-min treatment with insulin (10 nM) and used in Western blot with antibodies for the phosphorylate form (P-form) and total protein (T-form) of InsR. The signals for the two forms of InsR were quantitated by Image J and expressed as a ratio of P-form/T-form in the bar graphs on the right. In this experiment, parallel blotting with α actin was used as the loading control. (C) Blockade of InsR activation on insulin potentiation of GH-induced IGF-I and -II mRNA expression in carp hepatocytes. Hepatocytes were incubated for 24 h with GH alone (300 ng/ml), insulin alone (10 nM) or co-treatment of GH (300 ng/ml) and insulin (10 nM) in the presence of HNMPA (10 μM), an inhibitor for InsR activation. After that, total RNA was isolated and used for real-time PCR measurement of IGF-I and -II mRNA. For the data presented, the groups denoted by different letters represent a significant difference at P < 0.05.
Figure 5
Figure 5
Synergistic effect of GH and insulin on InsR, STAT5, Akt, and ERK1/2 activation in carp hepatocytes. (A) GH enhancement of InsR phosphorylation induced by insulin treatment. (B) Insulin potentiation of STAT5, Akt, and ERK1/2 phosphorylation induced by GH treatment. In these experiments, hepatocytes were exposed to insulin alone (10 nM), GH alone (300 ng/ml) or co-treatment of GH (300 ng/ml) and insulin (10 nM) for the duration as indicated for InsR phosphorylation. For STAT5, Akt, and ERK1/2 phosphorylation, the duration of drug treatment was reduced to 15 min. After treatment, cell lysate was prepared and used for Western blot with antibodies for phosphorylated form (P-form) and total protein (T-form) of the respective targets. The signals for the two forms of target proteins were then quantitated by Image J and expressed as a ratio of P-form/T-form in the bar graphs on the right. In these experiments, parallel blotting of β actin was also conducted to serve as the loading control.
Figure 6
Figure 6
Protein:protein interaction of GHR and InsR expressed in carp hepatocytes. Membrane protein extract was prepared from hepatocyte after challenged for 15-min with insulin alone (10 nM), GH alone (300 ng/ml) or co-treatment with GH (300 ng/ml) and insulin (10 nM) and used in immunoprecipitation (IP) with antibody for GHR or total protein of InsR (A). For protein samples pulled down by IP against GHR, size-fractionation by SDS-PAGE was conducted followed by immunoblotting (IB) with antibodies for phosphorylated form (P-InsR) and total protein of InsR (T-InsR). For protein samples pulled down by IP against total protein of InsR, similar SDS-PAGE coupled with IB using the antibody for GHR was also performed. The IB signals for the two forms of InsR and GHR were quantitated by Image J and presented in the bar graphs below the IB results. In this study, IP with mouse IgG followed by IB for the respective targets was used as the negative control (B). Parallel IB using the protein extract prior to IP was used as the input control while the corresponding blotting for β actin in whole cell lysate was also conducted to serve as the loading control (C).
Figure 7
Figure 7
Functional role of JAK2/STAT5 pathway in the synergistic effect of GH and insulin on IGF-I and -II expression in carp hepatocytes. (A) JAK2 blockade or (B) STAT5 inactivation on insulin potentiation of GH-induced IGF-I and -II mRNA expression at the hepatic level. In this study, hepatocytes were challenged for 24 h with insulin alone (10 nM), GH alone (300 ng/ml) or co-treatment with GH (300 ng/ml) and insulin (10 nM) in the presence of the JAK2 inhibitor AG490 (20 μM) or STAT5 inactivator NICO (20 μM). After treatment, total RNA was isolated and used for real-time PCR for IGF-I and -II mRNA. For IGF data presented, the groups denoted by different letters represent a significant difference at P < 0.05.
Figure 8
Figure 8
Functional role of MEK1/2/ERK1/2 pathway in the synergistic effect of GH and insulin on IGF-I and -II expression in carp hepatocytes. (A) MEK1/2 blockade or (B) ERK1/2 inhibition on insulin potentiation of GH-induced IGF-I and -II mRNA expression at the hepatic level. In this study, hepatocytes were challenged for 24 h with insulin alone (10 nM), GH alone (300 ng/ml) or co-treatment of GH (300 ng/ml) and insulin (10 nM) in the presence of the MEK1/2 inhibitor PD98059 (10 μM) or ERK1/2 inhibitor FR180204 (2 μM). After that, total RNA was isolated and used for real-time PCR for IGF-I and -II mRNA. For IGF data presented, the groups denoted by different letters represent a significant difference at P < 0.05.
Figure 9
Figure 9
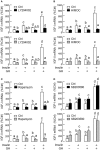
Functional role of P38 MAPK and PI3K/Akt pathways in the synergistic effect of GH and insulin on IGF-I and -II expression in carp hepatocytes. Effects of inhibiting (A) PI3K, (B) Akt, (C) mTOR and (D) P38 MAPK on insulin potentiation of GH-induced IGF-I and -II mRNA expression at the hepatic level. Hepatocytes were incubated for 24 h with insulin alone (10 nM), GH alone (300 ng/ml) or co-treatment with GH (300 ng/ml) and insulin (10 nM) in the presence of the PI3K inhibitor LY294002 (10 μM), Akt inhibitor HIMOC (10 μM), mTOR inhibitor rapamycin (20 nM) and P38 MAPK inhibitor SB203580 (5 μM), respectively. After that, total RNA was isolated and used for real-time PCR for IGF-I and -II mRNA. For IGF data presented, the groups denoted by different letters represent a significant difference at P < 0.05.
Figure 10
Figure 10
Working model proposed for the synergistic action of GH and insulin on IGF-I and -II expression in the carp liver. In carp hepatocytes, IGF-I and -II mRNA expression can be up-regulated by GH via the JAK2/STAT5, MEK1/2/ERK1/2, and PI3K/Akt/mTOR cascades. Insulin also has similar effects on IGF-I and -II gene expression but these actions are mediated via PI3K/Akt/mTOR but not JAK2/STAT5 and MEK1/2/ERK1/2 pathways. At the hepatic level, IGF-I and -II responses induced by GH can be markedly enhanced with insulin co-treatment. This potentiating effect can be observed with protein:protein interaction of GHR and InsR at the membrane level together with notable enhancement in InsR phosphorylation. Meanwhile, the levels of STAT5, ERK1/2, and Akt phosphorylation can also be potentiated by GH and insulin co-treatment. The aggravation in JAK2/STAT5, MEK1/2/ERK1/2 and PI3K/Akt signaling caused by simultaneous activation of GHR and InsR probably can contribute to the synergist effect on IGF-I and -II expression. Of note, MEK1/2 and ERK1/2 activation can also be induced by insulin but the pathway is not involved in insulin-induced IGF-I and -II expression. However, the functional role of MEK1/2/ERK1/2 activation by insulin in the potentiating effects caused by GH and insulin co-treatment should not be excluded. In carp model, P38 MAPK of MAPK cascades is not involved in the synergistic action of GH and insulin. P38 MAPK may play a role in signal termination for the IGF responses induced by GH or insulin respectively, and interestingly, its inhibitory effect can be nullified by co-treatment with GH and insulin but the mechanisms involved have yet to be elucidated.

Similar articles

Cited by

References

    1. Kaplan SA, Cohen P. The somatomedin hypothesis 2007: 50 years later. J Clin Endocrinol Metab. (2007) 92:4529–35. 10.1210/jc.2007-0526 - DOI - PubMed
    1. Le Roith D. The insulin-like growth factor system. Exp Diabesity Res. (2003) 4:205–12. 10.1155/EDR.2003.205 - DOI - PMC - PubMed
    1. Dehkhoda F, Lee CMM, Medina J, Brooks AJ. The growth hormone receptor: mechanism of receptor activation, cell signaling, and physiological aspects. Front Endocrinol. (2018) 9:35. 10.3389/fendo.2018.00035 - DOI - PMC - PubMed
    1. Randhawa R, Cohen P. The role of the insulin-like growth factor system in prenatal growth. Mol Genet Metab. (2005) 86:84–90. 10.1016/j.ymgme.2005.07.028 - DOI - PubMed
    1. Roberts CT, Owens JA, Sferruzzi-Perri AN. Distinct actions of insulin-like growth factors (IGFs) on placental development and fetal growth: lessons from mice and guinea pigs. Placenta (2008) 29(Suppl. A):S42–7. 10.1016/j.placenta.2007.12.002 - DOI - PubMed