

Concurrent Overexpression of OsGS1;1 and OsGS2 Genes in Transgenic Rice (Oryza sativa L.): Impact on Tolerance to Abiotic Stresses
- PMID: 29977247
- PMCID: PMC6021690
- DOI: 10.3389/fpls.2018.00786
Concurrent Overexpression of OsGS1;1 and OsGS2 Genes in Transgenic Rice (Oryza sativa L.): Impact on Tolerance to Abiotic Stresses
Abstract
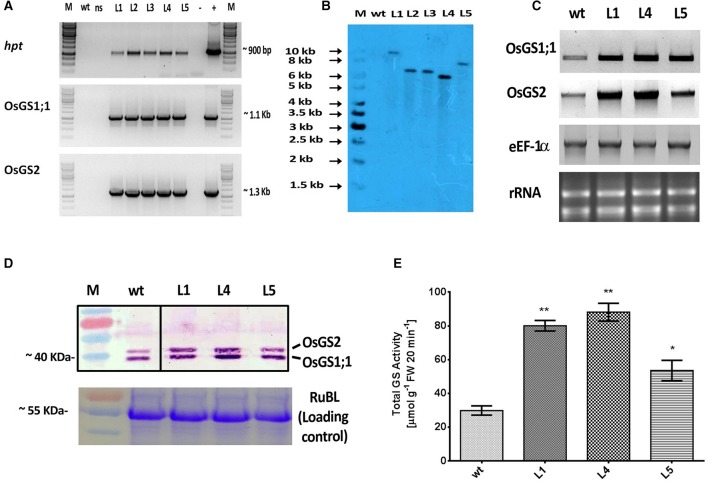
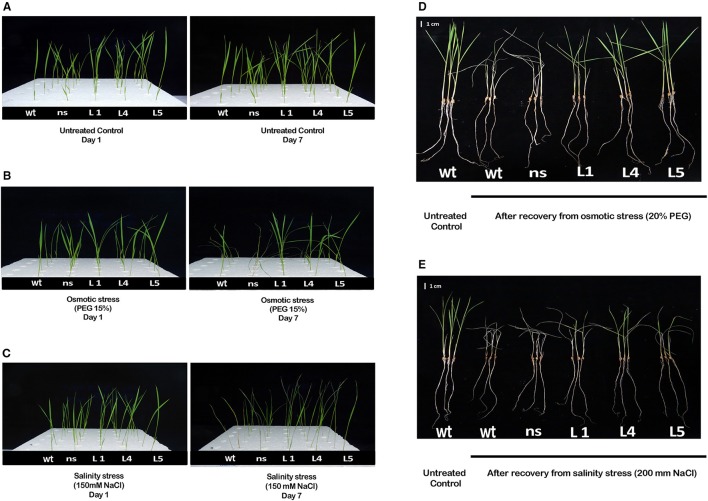
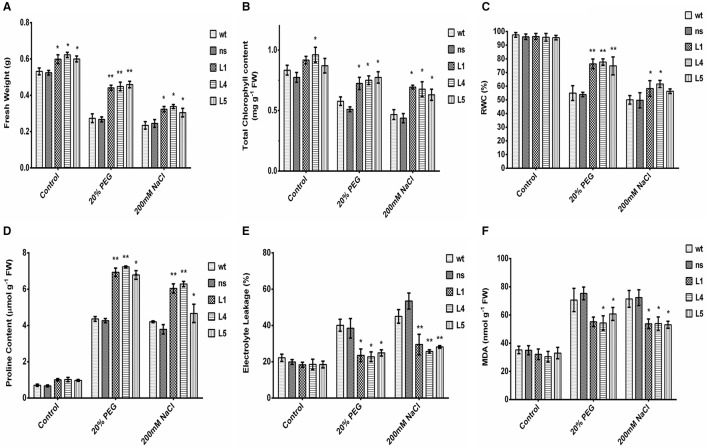
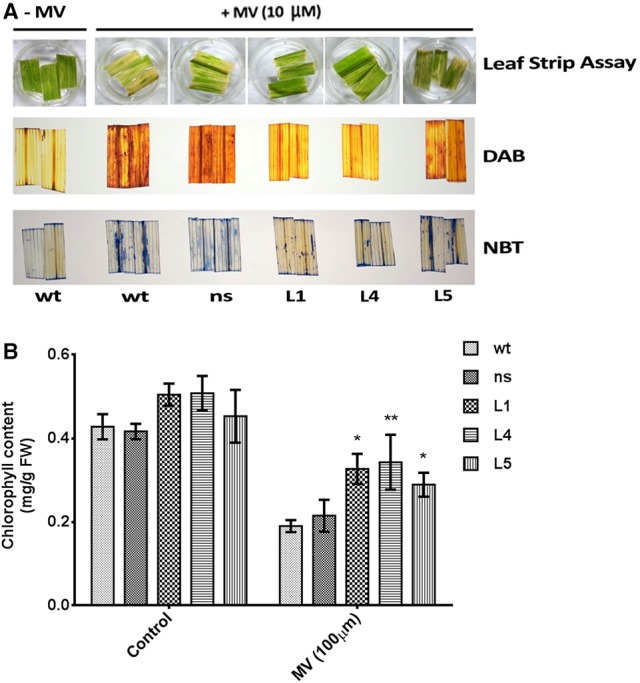
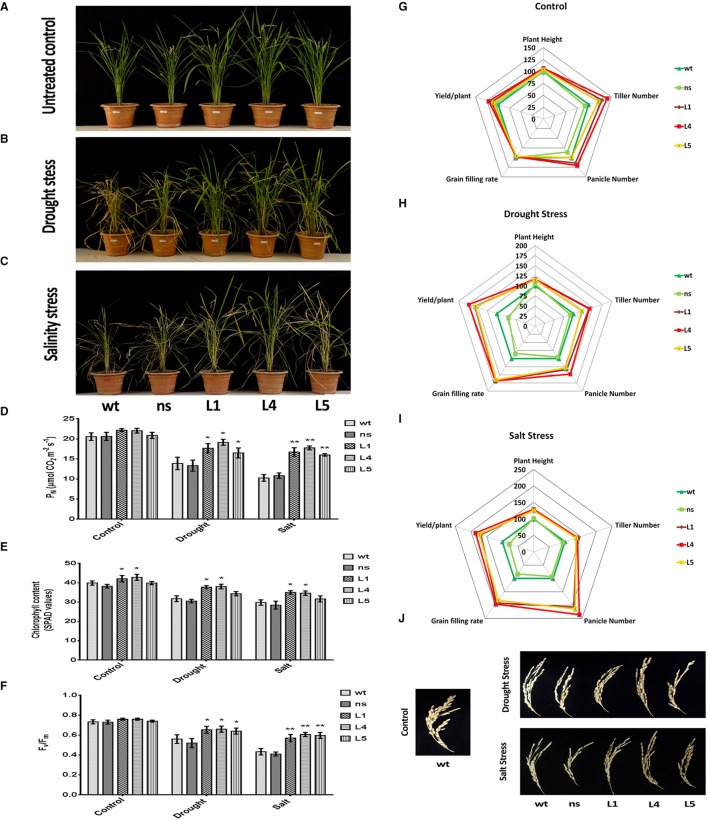
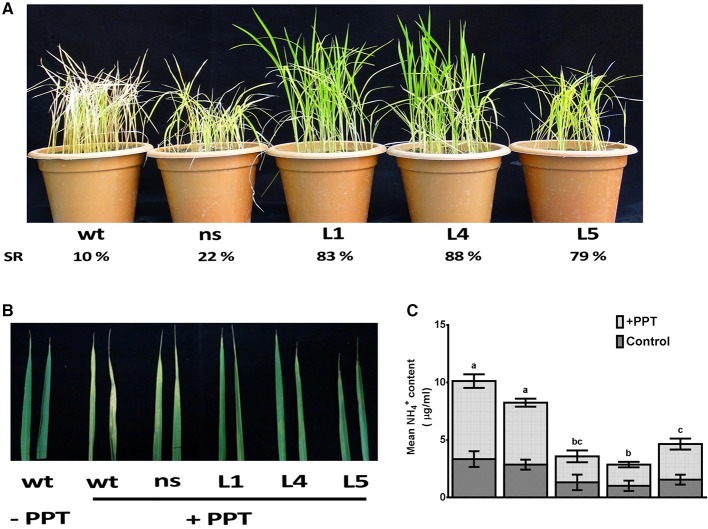
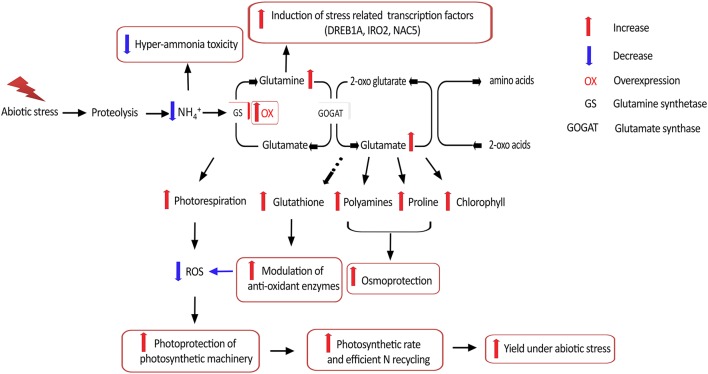
Glutamine synthetase (GS) is a key enzyme involved in the nitrogen metabolism of higher plants. Abiotic stresses have adverse effects on crop production and pose a serious threat to global food security. GS activity and expression is known to be significantly modulated by various abiotic stresses. However, very few transgenic overexpression studies of GS have studied its impact on abiotic stress tolerance. GS is also the target enzyme of the broad spectrum herbicide Glufosinate (active ingredient: phosphinothricin). In this study, we investigated the effect of concurrent overexpression of the rice cytosolic GS1 (OsGS1;1) and chloroplastic GS2 (OsGS2) genes in transgenic rice on its tolerance to abiotic stresses and the herbicide Glufosinate. Our results demonstrate that the co-overexpression of OsGS1;1 and OsGS2 isoforms in transgenic rice plants enhanced its tolerance to osmotic and salinity stress at the seedling stage. The transgenic lines maintained significantly higher fresh weight, chlorophyll content, and relative water content than wild type (wt) and null segregant (ns) controls, under both osmotic and salinity stress. The OsGS1;1/OsGS2 co-overexpressing transgenic plants accumulated higher levels of proline but showed lower electrolyte leakage and had lower malondialdehyde (MDA) content under the stress treatments. The transgenic lines showed considerably enhanced photosynthetic and agronomic performance under drought and salinity stress imposed during the reproductive stage, as compared to wt and ns control plants. The grain filling rates of the transgenic rice plants under reproductive stage drought stress (64.6 ± 4.7%) and salinity stress (58.2 ± 4.5%) were significantly higher than control plants, thereby leading to higher yields under these abiotic stress conditions. Preliminary analysis also revealed that the transgenic lines had improved tolerance to methyl viologen induced photo-oxidative stress. Taken together, our results demonstrate that the concurrent overexpression of OsGS1;1 and OsGS2 isoforms in rice enhanced physiological tolerance and agronomic performance under adverse abiotic stress conditions, apparently acting through multiple mechanistic routes. The transgenic rice plants also showed limited tolerance to the herbicide Glufosinate. The advantages and limitations of glutamine synthetase overexpression in crop plants, along with future strategies to overcome these limitations for utilization in crop improvement have also been discussed briefly.
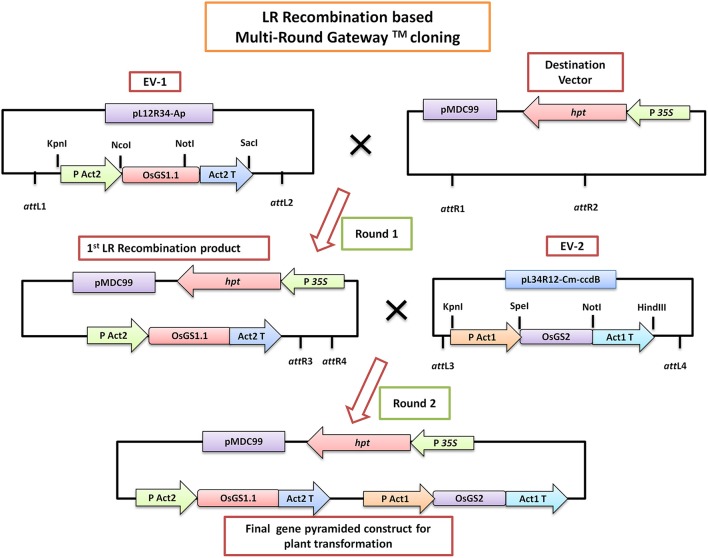
Keywords: Glufosinate; Multi-Round Gateway technology; abiotic stress; glutamine synthetase; herbicide tolerance; in vitro gene pyramiding.
Figures
Similar articles
-
Regulation of glutamine synthetase isoforms in two differentially drought-tolerant rice (Oryza sativa L.) cultivars under water deficit conditions.Plant Cell Rep. 2013 Feb;32(2):183-93. doi: 10.1007/s00299-012-1353-6. Epub 2012 Oct 16. Plant Cell Rep. 2013. PMID: 23070303
-
Loss of OsSPL8 Function Confers Improved Resistance to Glufosinate and Abiotic Stresses in Rice.Plant Cell Environ. 2025 Jan;48(1):682-698. doi: 10.1111/pce.15168. Epub 2024 Sep 25. Plant Cell Environ. 2025. PMID: 39323026
-
Pyramiding of transcription factor, PgHSF4, and stress-responsive genes of p68, Pg47, and PsAKR1 impart multiple abiotic stress tolerance in rice (Oryza sativa L.).Front Plant Sci. 2023 Aug 25;14:1233248. doi: 10.3389/fpls.2023.1233248. eCollection 2023. Front Plant Sci. 2023. PMID: 37692421 Free PMC article.
-
Stacking for future: Pyramiding genes to improve drought and salinity tolerance in rice.Physiol Plant. 2021 Jun;172(2):1352-1362. doi: 10.1111/ppl.13270. Epub 2020 Nov 21. Physiol Plant. 2021. PMID: 33180968 Review.
-
Evidence supporting distinct functions of three cytosolic glutamine synthetases and two NADH-glutamate synthases in rice.J Exp Bot. 2014 Oct;65(19):5519-25. doi: 10.1093/jxb/eru103. Epub 2014 Mar 14. J Exp Bot. 2014. PMID: 24634487 Review.
Cited by
-
Genetic manipulation for abiotic stress resistance traits in crops.Front Plant Sci. 2022 Sep 21;13:1011985. doi: 10.3389/fpls.2022.1011985. eCollection 2022. Front Plant Sci. 2022. PMID: 36212298 Free PMC article. Review.
-
Physio-biochemical responses and expressional profiling analysis of drought tolerant genes in new promising rice genotype.PLoS One. 2022 Mar 29;17(3):e0266087. doi: 10.1371/journal.pone.0266087. eCollection 2022. PLoS One. 2022. Retraction in: PLoS One. 2022 Aug 17;17(8):e0272395. doi: 10.1371/journal.pone.0272395. PMID: 35349595 Free PMC article. Retracted.
-
Genetic Diversity in Nitrogen Fertiliser Responses and N Gas Emission in Modern Wheat.Front Plant Sci. 2022 May 4;13:816475. doi: 10.3389/fpls.2022.816475. eCollection 2022. Front Plant Sci. 2022. PMID: 35646002 Free PMC article.
-
Concurrent activation of OsAMT1;2 and OsGOGAT1 in rice leads to enhanced nitrogen use efficiency under nitrogen limitation.Plant J. 2020 Jul;103(1):7-20. doi: 10.1111/tpj.14794. Epub 2020 May 27. Plant J. 2020. PMID: 32369636 Free PMC article.
-
Integrative Transcriptomic and Proteomic Analysis Reveals an Alternative Molecular Network of Glutamine Synthetase 2 Corresponding to Nitrogen Deficiency in Rice (Oryza sativa L.).Int J Mol Sci. 2021 Jul 18;22(14):7674. doi: 10.3390/ijms22147674. Int J Mol Sci. 2021. PMID: 34299294 Free PMC article.
References
-
- Bajji M., Kinet J. M., Lutts S. (2002). The use of the electrolyte leakage method for assessing cell membrane stability as a water stress tolerance test in durum wheat. Plant Growth Regul. 36, 61–70. 10.1023/A:1014732714549 - DOI
-
- Barrs H., Weatherley P. (1962). A re-examination of the relative turgidity technique for estimating water deficits in leaves. Aust. J. Biol. Sci. 15:413 10.1071/BI9620413 - DOI
-
- Bates L. S., Waldren R. P., Teare I. D. (1973). Rapid determination of free proline for water-stress studies. Plant Soil 39, 205–207. 10.1007/BF00018060 - DOI
LinkOut - more resources
Full Text Sources
Other Literature Sources
Miscellaneous