. 2018 Jul 1:4:24.
doi: 10.1038/s41540-018-0061-4. eCollection 2018.

A network of epigenomic and transcriptional cooperation encompassing an epigenomic master regulator in cancer

Affiliations

A network of epigenomic and transcriptional cooperation encompassing an epigenomic master regulator in cancer

Stephen Wilson et al. NPJ Syst Biol Appl. .

Abstract

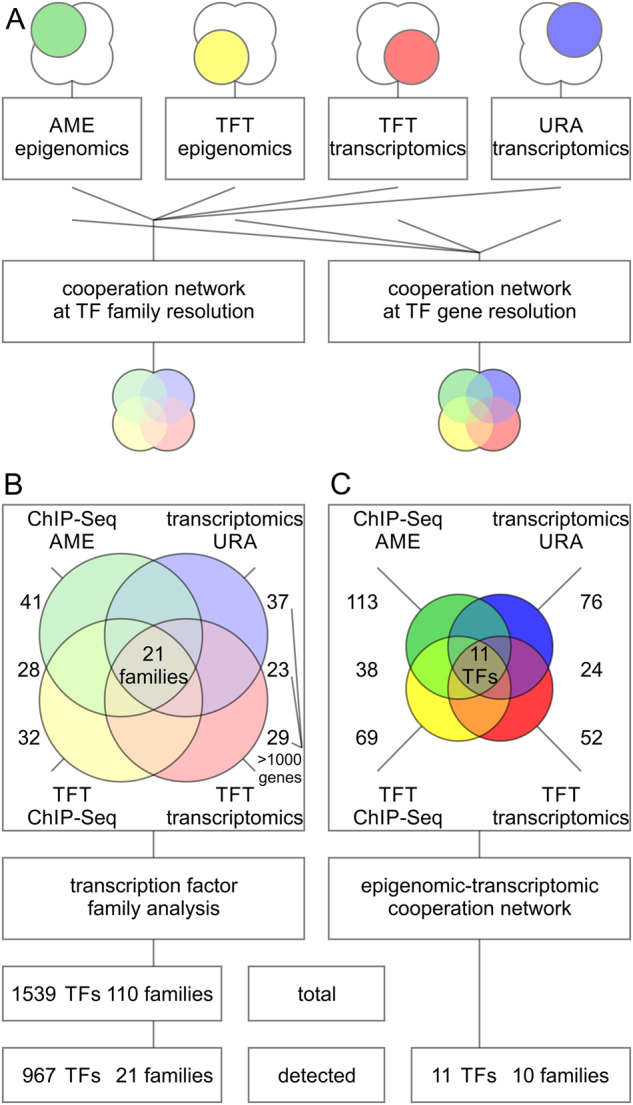
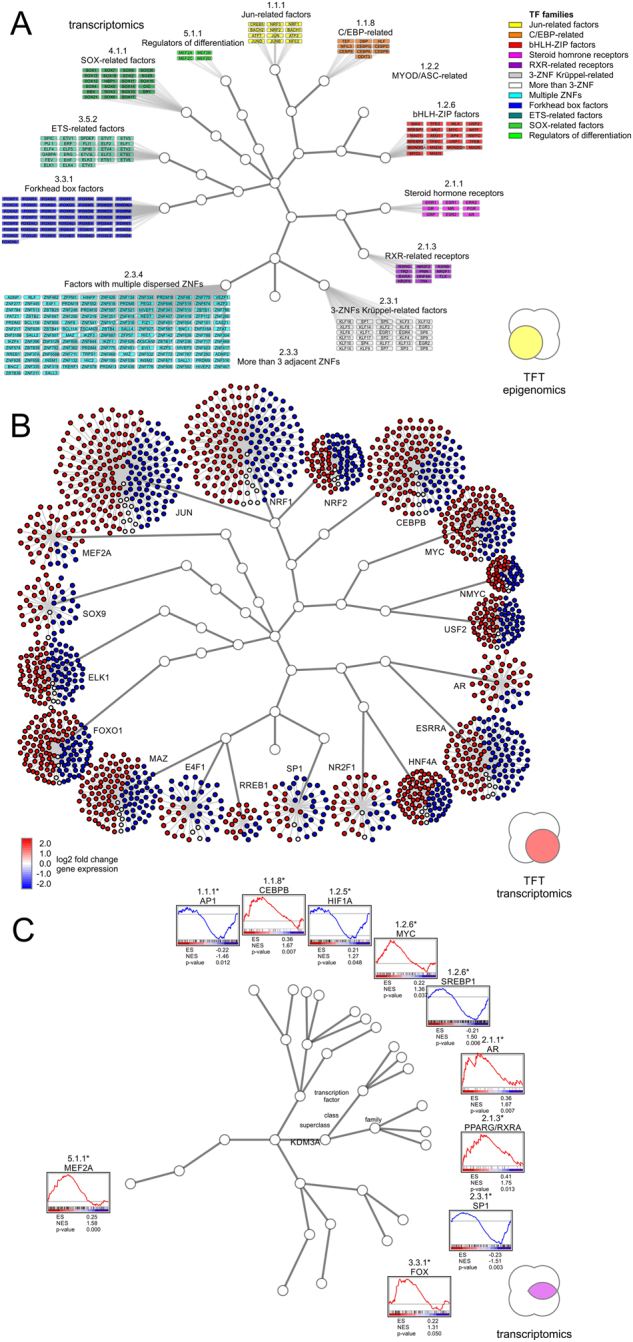
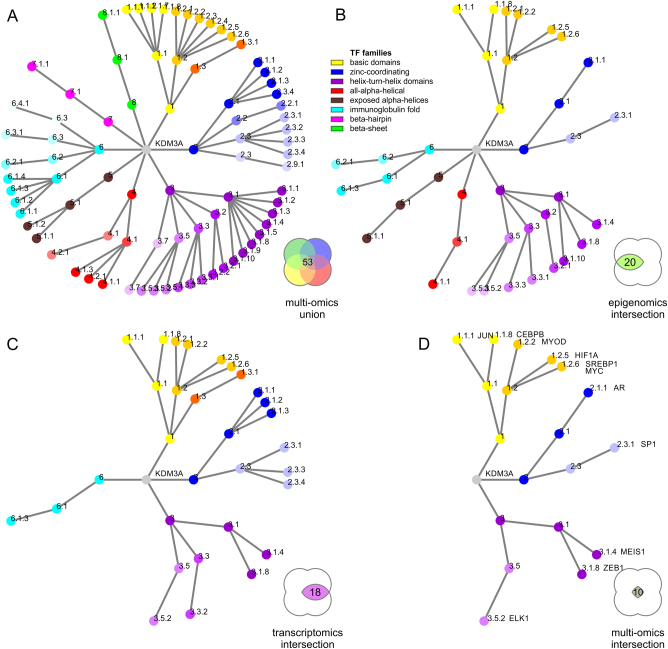
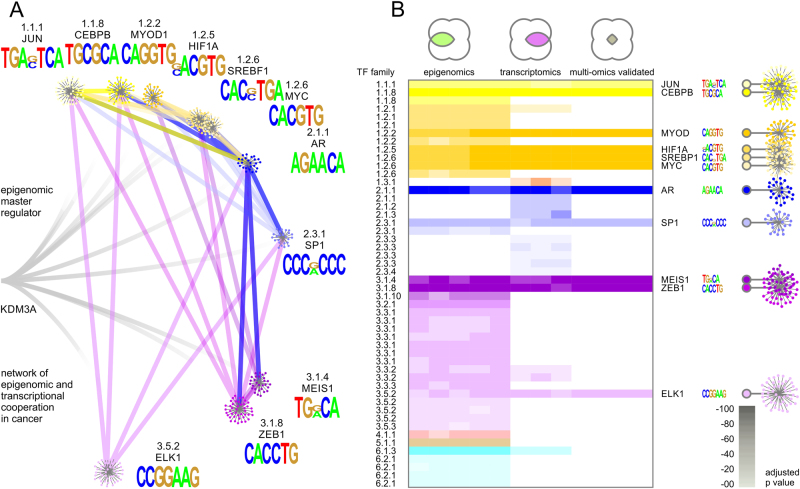
Coordinated experiments focused on transcriptional responses and chromatin states are well-equipped to capture different epigenomic and transcriptomic levels governing the circuitry of a regulatory network. We propose a workflow for the genome-wide identification of epigenomic and transcriptional cooperation to elucidate transcriptional networks in cancer. Gene promoter annotation in combination with network analysis and sequence-resolution of enriched transcriptional motifs in epigenomic data reveals transcription factor families that act synergistically with epigenomic master regulators. By investigating complementary omics levels, a close teamwork of the transcriptional and epigenomic machinery was discovered. The discovered network is tightly connected and surrounds the histone lysine demethylase KDM3A, basic helix-loop-helix factors MYC, HIF1A, and SREBF1, as well as differentiation factors AP1, MYOD1, SP1, MEIS1, ZEB1, and ELK1. In such a cooperative network, one component opens the chromatin, another one recognizes gene-specific DNA motifs, others scaffold between histones, cofactors, and the transcriptional complex. In cancer, due to the ability to team up with transcription factors, epigenetic factors concert mitogenic and metabolic gene networks, claiming the role of a cancer master regulators or epioncogenes. Significantly, specific histone modification patterns are commonly associated with open or closed chromatin states, and are linked to distinct biological outcomes by transcriptional activation or repression. Disruption of patterns of histone modifications is associated with the loss of proliferative control and cancer. There is tremendous therapeutic potential in understanding and targeting histone modification pathways. Thus, investigating cooperation of chromatin remodelers and the transcriptional machinery is not only important for elucidating fundamental mechanisms of chromatin regulation, but also necessary for the design of targeted therapeutics.


Conflict of interest statement

The authors declare no competing interests.All experimental protocols were approved by the Institutional Review Boards at the University of California Merced. The study was carried out as part of IRB UCM13-0025 of the University of California Merced and as part of dbGap ID 5094 for study accession phs000178.v9.p8 on somatic mutations in cancer and conducted in accordance with the Helsinki Declaration of 1975.

Figures

Fig. 1
Fig. 1
Universal workflow for computational elucidation of regulatory cooperation networks. a By conjoining epigenomics and transcriptomics data, it is possible to define an effector network comprised of target genes affected by epigenomic regulation. The epigenomic effector network is regulated by chromatin binding or chromatin modification events resulting in gene expression changes. b Concerted analysis of chromatin immunoprecipitation ChIP-Seq and RNA-Seq data (or similar data) enables identification of epigenomic and transcriptomic master regulators and transcription factor networks. c By elucidating transcription factors associated with an epigenomic event or regulator, it is possible to identify a well-defined epigenomic-transcriptomic cooperation network supported by complementary multi-omics data. A color scheme denoting, both data types and systems biology analyses, is maintained throughout the entire document. Each color represents a specific analysis technique executed on either genome-wide epigenome and transcriptome profiles. The genome-wide intersection of epigenomic target regions (light green) with differentially expressed (DE) transcripts (purple) results in the effector network of regulated target genes. The intersection of analysis of motif enrichment (AME) and transcription factor target (TFT), and upstream regulator analysis (URA) approaches provides insights into cooperative networks of transcription factors associated with epigenomic regulators. Importantly, such genome-wide information can be accessed at the sequence or gene level providing different level of depth and resolution. ChIP-Seq data from AME (green) is enhanced by position site-specific matrix (PSSM) models of transcription factor motifs. TFT analysis can be performed on gene target sets derived from ChIP-Seq (yellow) or transcriptomics data (red). Furthermore, gene expression data contains valuable directional information indicated by arrows next to the gene expression data utilized by URA (blue), which incorporates hierarchical systems biology networks. The core analysis of the workflow includes multi-omics data integration between chromatin binding and differential gene expression events
Fig. 2
Fig. 2
Transcription factor enrichment associated with activity of an epigenetic modifier is assessed by complementary multi-omics platforms and resolved at the family and gene level. a Transcription factor (TF) enrichment associated with epigenomic activity is quantified using complementary omics platforms. ChIP-Seq data provides sequence-based insights on motifs (green) and genomic coordinates (yellow) of epigenomic activity. Transcriptomics data provides functional insight into regulated gene networks (red) and the direction of response (blue). The data was analyzed using analysis of motif enrichment (AME), transcription factor target analysis (TFT), or up-stream regulator analysis (URA). b On the one hand, the analysis is carried out at the level of transcription factor families based on position-specific matrix-assisted searches of structural motifs of transcription factor site recognition. This approach is sequence-based and considers the possibility that multiple, homologous members of transcription factor families have the ability to recognize the same transcription factor site. c On the other hand, the analysis is conducted at the transcript level with gene-specific insight into transcription factors and their expression levels. This approach takes advantage of regulatory networks, which are assigned to specific isoforms of homologous members of transcription factor families, and includes direction of regulation. The later approach yields a set of transcriptional coactivators that is about two orders of magnitude smaller and more specific than the transcription factor family-based approach
Fig. 3
Fig. 3
Visualization of epigenomic and transcriptional cooperation illustrates redundancy and complexity of a target network. a Hierarchical trees of human transcription factors correspond to transcription factor superclass, class, and family from inward out. Transcription factor motifs often get recognized by multiple members of the same transcription factor family due to structural homology of DNA binding domains. The transcription factor target analysis (TFT) is carried out on sequence-specific epigenomics data. b Size of the transcriptional effector network and the direction of response are key parameters when evaluating target genes in epigenomic cooperation. The TFT analysis is based on differentially expressed transcripts with transcriptomic up and down response in red and blue, respectively. c Transcription factor target networks provide insight into enrichment and direction of the response. Identified cooperating transcription factors show agreement between complementary data of expression levels, direction of regulation, target sets, and hierarchical linkage
Fig. 4
Fig. 4
Network of transcriptional cooperation of an epigenomic master regulator visualized by transcription factor family trees. a A network of transcription factors is detected using complementary epigenomic and transcriptomic data. The realm of potentially relevant transcription factor families is large yet many data points are not mirrored or validated by different platforms. b, c Confidence and mutual data support increases by integrating analysis of motif enrichment (AME), transcription factor target analysis (TFT), or up-stream regulator analysis (URA). For each data source B chromatin modifications or c differential expression of target genes detected transcription factors supported by at least two complementary techniques, AME and TFT for epigenomics data, and URA and TFT for transcriptomics. d High-confidence target network of transcription factors validated by four different omics platforms integrating ChIP-Seq based motifs and transcriptional networks. Legends of colored areas in Venn diagrams illustrate intersections of complementary datasets and analysis platforms with numbers of identified transcription factor families, respectively. The numbers next to individual nodes of the hierarchical family tree indicate transcription factor superclass, class, and family from inward out
Fig. 5
Fig. 5
The network of networks convoluted in epigenomic and transcriptional cooperation by an epigenomic master regulator displays specificity yet redundancy and hyperconnectivity. a A highly specific effector network is accomplished by epigenomic and transcriptional cooperation. Key features of the network are hyperconnectivity of utilized nodes and targeting of effector genes by multiple cooperating transcription factors. b Each identified node of the transcription factor network comprising epigenomic cooperation is supported by complementary epigenomic and transcriptomic data. Each cooperating transcription factor supports the epigenomic factor—in this case KDM3A—by contributing motif-specific recognition, by directing chromatin accessibility, and by controlling transcriptional coactivation

Similar articles

Cited by

References

    1. Dawson MA. The cancer epigenome: concepts, challenges, and therapeutic opportunities. Science. 2017;355:1147–1152. doi: 10.1126/science.aam7304. - DOI - PubMed
    1. Leung JK, Sadar MD. Non-genomic actions of the androgen receptor in prostate cancer. Front. Endocrinol. 2017;8:2. doi: 10.3389/fendo.2017.00002. - DOI - PMC - PubMed
    1. Filipp FV. Crosstalk between epigenetics and metabolism-Yin and Yang of histone demethylases and methyltransferases in cancer. Brief. Funct. Genom. 2017;16:320–325. doi: 10.1093/bfgp/elx001. - DOI - PMC - PubMed
    1. Filipp FV. Epioncogenes in cancer—identification of epigenomic and transcriptomic cooperation networks by multi-omics integration of ChIP-Seq and RNA-Seq data. Syst. Biol. Methods Mol. Biol. 2019;1800:101–121.
    1. Wilson S, Fan L, Sahgal N, Qi J, Filipp FV. The histone demethylase KDM3A regulates the transcriptional program of the androgen receptor in prostate cancer cells. Oncotarget. 2017;8:30328–30343. - PMC - PubMed