. 2018 Jun 28:3:20.
doi: 10.1038/s41541-018-0058-4. eCollection 2018.

Activation of the endoplasmic reticulum stress sensor IRE1α by the vaccine adjuvant AS03 contributes to its immunostimulatory properties

Affiliations

Activation of the endoplasmic reticulum stress sensor IRE1α by the vaccine adjuvant AS03 contributes to its immunostimulatory properties

Charlotte Givord et al. NPJ Vaccines. .

Abstract

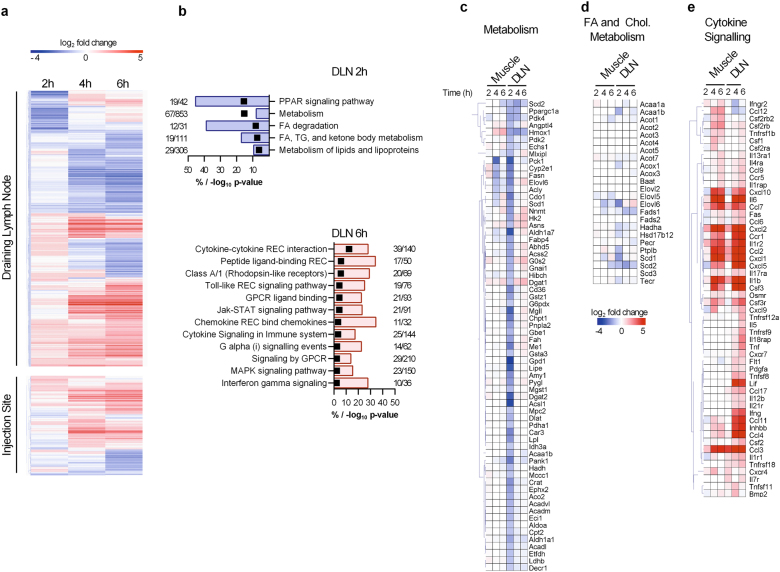
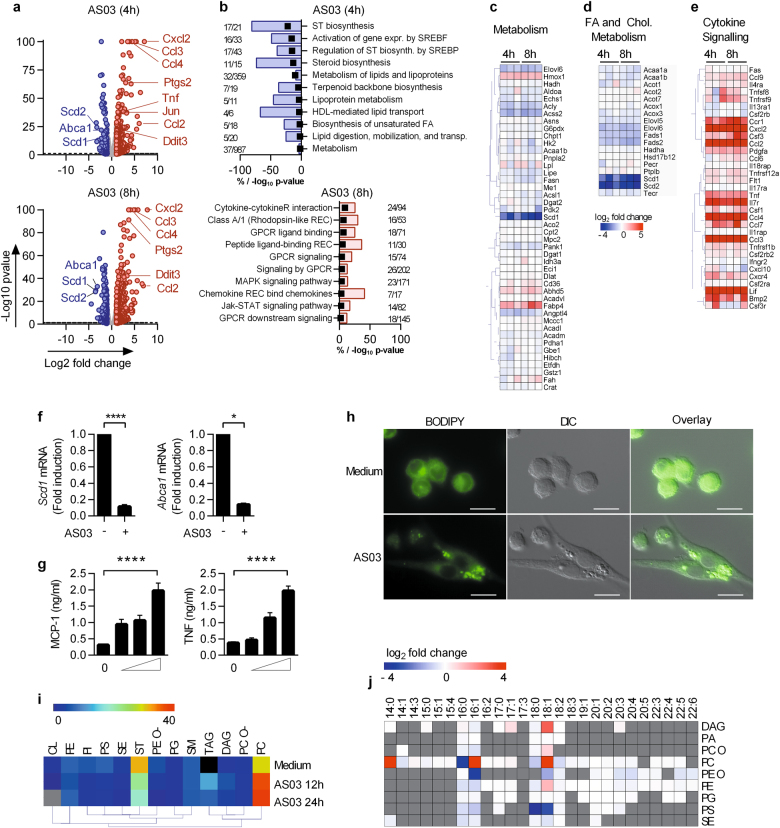
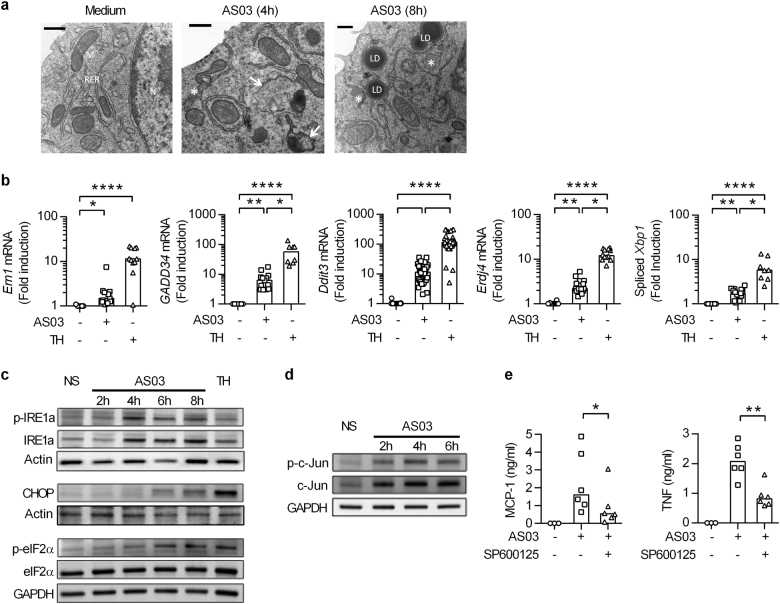
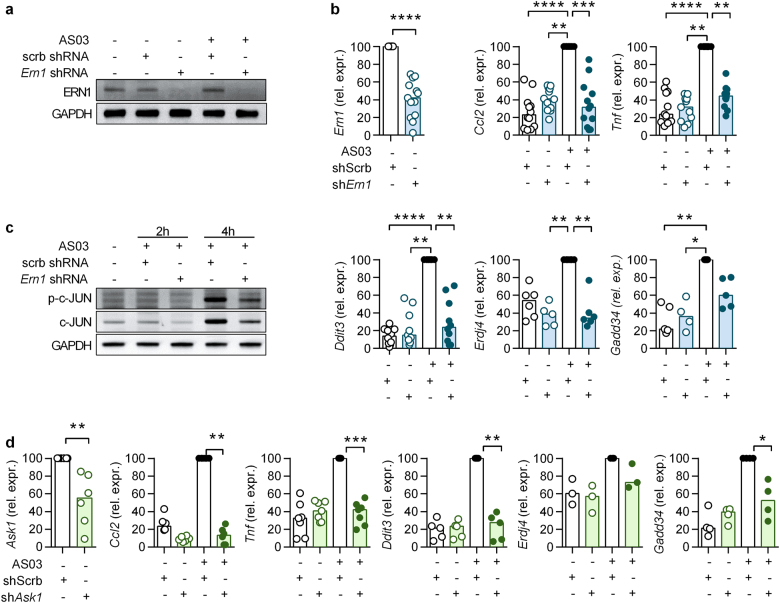
The oil-in-water emulsion Adjuvant System 03 (AS03) is one of the few adjuvants used in licensed vaccines. Previous work indicates that AS03 induces a local and transient inflammatory response that contributes to its adjuvant effect. However, the molecular mechanisms involved in its immunostimulatory properties are ill-defined. Upon intramuscular injection in mice, AS03 elicited a rapid and transient downregulation of lipid metabolism-related genes in the draining lymph node. In vitro, these modifications were associated with profound changes in lipid composition, alteration of endoplasmic reticulum (ER) morphology and activation of the unfolded protein response pathway. In vivo, treatment with a chemical chaperone or deletion of the ER stress sensor kinase IRE1α in myeloid cells decreased AS03-induced cytokine production and its capacity to elicit high affinity antigen-specific antibodies. In summary, our results indicate that IRE1α is a sensor for the metabolic changes induced by AS03 in monocytic cells and may constitute a canonical pathway that could be exploited for the design of novel vaccine adjuvants.


Conflict of interest statement

All authors have declared the following interests: R.G., C.C. and A.D. are employees of the GSK group of companies. A.M.D. reports ownership of GSK shares. The remaining authors declare no competing interests.

Figures

Fig. 1
Fig. 1
AS03 induces alterations in gene expression in the draining lymph node. Mice received an intramuscular injection of AS03 and the iliac dLN and injection site (muscle) were recovered after 2, 4 or 6 h. a Heatmap representation of hierarchically clustered differentially expressed genes (Log2 fold changes vs PBS > 1 or <1 and p-value < 0.05) in the dLN or injection site at 2, 4 and 6 h. b Overrepresented pathways encompassing significantly downregulated genes (p-value < 0.05 and fold change < 0.5) at 2 h and significantly upregulated genes (p-value < 0.05 and fold change > 2) at 6 h in the draining lymph node. The bars represent the percentage of down- or upregulated genes and the black boxes represent –log10 (p-value). C-E) Heatmap representation of genes belonging to the metabolism (c), fatty acid metabolism (d) and cytokine-cytokine receptor interaction (e) pathways. Each condition represents data obtained from three pools of two mice
Fig. 2
Fig. 2
AS03 promotes rapid modifications of gene expression and lipid content in RAW 264.7 macrophages. ae RAW 264.7 cells were stimulated with AS03 for 4 or 8 h, and gene expression was assessed by RNA sequencing (a) Volcano plot of RNA sequencing data. Each point represents one gene plotted by log2 fold change (FC) vs medium against –log10 of the p-value (average of triplicates). The horizontal bar represents a p-value of 0.05. The light grey points represent genes with FC < 2 and FC > 0.5, blue points represent FC < 0.5 and red points FC > 2. b Overrepresented pathways representing significantly downregulated genes (p-value < 0.05 and fold change < 0.5) at 4 h and significantly upregulated genes (p-value < 0.05 and fold change > 2) at 8 h. The bars represent the percentage of down- or upregulated genes and the black boxes represent –log10 (p-value). c–e Heatmap representation of genes previously identified as differentially regulated in vivo, related to the metabolism (c), biosynthesis of unsaturated fatty acid (d) and cytokine-cytokine receptor interaction pathways (e). The colour-coded scale representing fold change vs medium (blue = downregulated vs medium, red = upregulated vs medium) is shown below. f mRNA levels for SCD1 and ABCA1 in the RAW cells in response to AS03 (1/30) (normalized with β-actin housekeeping gene, fold change vs unstimulated). *p < 0.05 determined by Mann–Whitney test. g MCP-1 and TNF production after stimulation of RAW cells with increasing doses of AS03 (1/500, 1/100, 1/30; mean ± SEM, n > 3). *p < 0.05 determined by Mann-Whitney test on medium vs AS03 1/30. The data is representative of at least 6 independent experiments performed in triplicates. h Neutral lipid stain (BODIPY 493/503) on RAW 264.7 cells analysed by fluorescence microscopy after 6 h of incubation with medium alone, or AS03 (1/30), scale bar: 20 µm). One representative experiment out of 3. i Heatmap depicting the proportion (in percentage of total lipid content) of different lipid classes in RAW cells stimulated 12 or 24 h with medium and AS03. Cardiolipid (CL), phosphatidylethanolamine (PE), phosphatidylinositol (PI), phosphatidylserine (PS), Sterol esters (SE), cholesterol (ST), phosphatidylethanolamine–ether (PE O–), phosphatidylglycerol (PG), sphingomyelin (SM), triacylglycerol (TAG), diacylglycerol (DAG), phosphatidylcholine–ether (PC 0–), phosphatidylcholine (PC). Grey box: below detection level. j Heatmap representation of significant (p < 0.05) AS03-induced alterations in lipid saturation for each main lipid class (log2 FC AS03 vs medium). The data represents the mean values obtained from three independent samples for each time point
Fig. 3
Fig. 3
AS03 induces activation of the ER stress pathway. a RAW cells were treated as indicated, fixed and processed for TEM. Arrows, mitophagy; asterisks, swollen ER; M mitochondrion, N nucleus, LD lipid droplets. (Scale bars: 500 nm). One representative experiment out of three. b Expression of Ern1 and Gadd34, Ddit3, Erdj4 and spliced Xbp1 in RAW cells in response to AS03 (1/30) and thapsigargin as a positive control (TH; 10 μM) at 6 and 4 h respectively and measured by qPCR (normalized to β-actin and expressed as a fold change vs medium). Statistical significance was determined by a Kruskal-Wallis test followed by Dunn’s multiple comparisons. The data is representative of at least 6 independent experiments performed in triplicates. c Immunoblot detection of the ER stress markers p-IRE1α, p-eIF2α and CHOP in RAW cells in response to AS03 (1/30; 2–8 h) or Thapsigargin (TH; 10 μM; 4 h). d Detection of phosphorylated c-Jun by Western Blot in RAW cells in response to AS03 (1/30; 2–6 h). The data is representative of three independent experiments (e) ELISA detection of MCP-1 and TNF-α production by RAW cells 24 h after AS03 stimulation (1/30) with or without the JNK inhibitor SP600125 (10 μM, n = 6 independent experiments). Statistical significance was determined by Wilcoxon paired test
Fig. 4
Fig. 4
IRE1α and ASK1 are required for cytokine production and ER stress activation for the response to AS03 in RAW cells. a Immunoblot detection of IRE1α/Ern1 after AS03 stimulation and IRE1α/Ern1 knockdown. Representative of two independent experiments. b Expression of Ern1, Mcp1, Tnf and the ER stress markers Ddit3/Chop, Erdj4 and Gadd34 mRNAs in RAW cells in response to AS03 (1/30, 6 h) after IRE1α/Ern1 knockdown. Statistical significance was determined by either a Mann–Whitney test or by a Kruskal-Wallis followed by Dunn’s multiple comparison test. c Immunoblot detection of total and phosphorylated c-Jun (S63) after AS03 stimulation and IRE1α/Ern1 knockdown Representative of two independent experiments. d Expression of Ask1, Mcp1, Tnf and the ER stress markers Ddit3/Chop, Erdj4, and Gadd34 mRNAs in RAW cells in response to AS03 (1/30, 6 h) after Ask1 knockdown. *p < 0.05 determined by Mann–Whitney. Each dot represents the mean value of an individual experiment performed in triplicates
Fig. 5
Fig. 5
4-PBA inhibition of ER-stress in vivo affects antibody avidity. a MCP-1 and TNF secretion 24 h after stimulation with AS03 (1/30) or MPL (10 μg/ml), with 4PBA (3 mM) treatment 1 h prior stimulation. *p < 0.05 determined by Mann–Whitney test on AS03 1/30 vs AS03 + 4PBA. Each dot represents the mean value of independent experiments performed in triplicates and the horizontal bars represent the medians. b Expression of Ddit3/Chop mRNA in peritoneal cells 6 h after AS03 i.p. injection. c Serum cytokine levels 6 h after i.p. injection of AS03, following 3 days of 4PBA-IP injection (2 mg/mouse). Each point represent a single mouse and the horizontal bar represents the median. *p < 0.05 determined by Mann–Whitney. The data is representative of at least two independent experiments. d Serum anti-HBs IgG1 and IgG2c titres were measured by ELISA on day 21 (7 days post second immunization). Statistical significance was determined by Kruskal–Wallis followed by Dunn’s multiple comparison test. Each dot represents a single mouse and the horizontal bar represents the median. Data were obtained from two independent experiments. e The avidity of the HBs-specific IgG1 and IgG2c antibodies was measured by ELISA with serial dilutions of a chaotropic agent (NaSCN), and represented as both the median and interquartile range of normalized optical density values (0 M NaSCN = 100%) and the concentration of NaSCN required to dissociate 50% of bound antibodies. Statistical significance was determined by Kruskal–Wallis followed by Dunn’s multiple comparison test
Fig. 6
Fig. 6
IRE1α expression by myeloid cells is required for optimal response to AS03 adjuvant. a Ern1flox/+ and Ern1ΔM mice were injected i.m. with PBS or AS03. 6 h later, serum was collected and cytokine (IL-6, MCP-1, KC, G-GSF) production was measured by ELISA. Each point represents a single mice and the horizontal bar represents the median. *p < 0.05 determined by Mann–Whitney. Data is representative of two independent experiments. b Ern1flox/+ and Ern1ΔM mice were immunized with HBsAg or HBsAg + AS03 and the DLNs were recovered on day 7 and analysed for Tfh markers or stimulated with PMA/ionomycin in the presence of brefeldin A and stained for Ki67 and IL-21 expression (c) Ern1flox/+ and Ern1ΔM mice were immunized with HBsAg or HBsAg + AS03 (d0) and a boost was performed on day 14. Serum anti-HBs IgG1 and IgG2c titres were measured by ELISA on day 21. Statistical significance was determined by Kruskal-Wallis followed by Dunn’s multiple comparison test. Each dot represents a single mouse and the horizontal bar represents the median. Data were obtained from two independent experiments. d The avidity of the HBs-IgG1 and IgG2c was measured by ELISA with serial dilutions of a chaotropic agent (NaSCN) and represented as both the median and interquartile range of normalized optical density values (0 M NaSCN = 100%) and the concentration of NaSCN required to dissociate 50% of bound antibodies. Statistical significance was determined by Kruskal–Wallis followed by Dunn’s multiple comparison test

References

    1. Coffman RL, Sher A, Seder RA. Vaccine adjuvants: putting innate immunity to work. Immunity. 2010;33:492–503. doi: 10.1016/j.immuni.2010.10.002. - DOI - PMC - PubMed
    1. Kool M, et al. Alum adjuvant boosts adaptive immunity by inducing uric acid and activating inflammatory dendritic cells. J. Exp. Med. 2008;205:869–882. doi: 10.1084/jem.20071087. - DOI - PMC - PubMed
    1. Marichal T, et al. DNA released from dying host cells mediates aluminum adjuvant activity. Nat. Med. 2011;17:996–1003. doi: 10.1038/nm.2403. - DOI - PubMed
    1. Vono M, et al. The adjuvant MF59 induces ATP release from muscle that potentiates response to vaccination. Proc. Natl. Acad. Sci. U. S. A. 2013;110:21095–21100. doi: 10.1073/pnas.1319784110. - DOI - PMC - PubMed
    1. Detienne S, et al. Central role of CD169 + lymph node resident macrophages in the adjuvanticity of the QS-21 component of AS01. Sci. Rep. 2016;6:39475. doi: 10.1038/srep39475. - DOI - PMC - PubMed

LinkOut - more resources