. 2018 Jun 11:5:2374289518777463.
doi: 10.1177/2374289518777463. eCollection 2018 Jan-Dec.

The Evolution of Earned, Transparent, and Quantifiable Faculty Salary Compensation: The Johns Hopkins Pathology Experience

Affiliations

The Evolution of Earned, Transparent, and Quantifiable Faculty Salary Compensation: The Johns Hopkins Pathology Experience

Kathleen H Burns et al. Acad Pathol. .

Abstract

Faculty value equitable and transparent policies for determining salaries and expect their compensation to compare favorably to the marketplace. Academic institutions use compensation to recruit and retain talented faculty as well as to reward accomplishment. Institutions are therefore working to decrease salary disparities that appear arbitrary or reflect long-standing biases and to identify metrics for merit-based remuneration. Ours is a large academic pathology department with 97 tenure-track faculty. Faculty salaries are comprised of 3 parts (A + B + C). Part A is determined by the type of appointment and years at rank; part B recognizes defined administrative, educational, or clinical roles; and part C is a bonus to reward and incentivize activities that forward the missions of the department and medical school. A policy for part C allocations was first codified and approved by department faculty in 1993. It rewarded performance using a semiquantitative scale, based on subjective evaluations of the department director (chair) in consultation with deputy directors (vice chairs) and division directors. Faculty could not directly calculate their part C, and distributions data were not widely disclosed. Over the last 2 years (2015-2017), we have implemented a more objective formula for quantifying an earned part C, which is primarily designed to recognize scholarship in the form of research productivity, educational excellence, and clinical quality improvement. Here, we share our experience with this approach, reviewing part C calculations as made for individual faculty members, providing a global view of the resulting allocations, and considering how the process and outcomes reflect our values.

Keywords: Bonus/Supplement/Incentive (BSI) component; academic relative value unit (RVU); faculty salary; performance-based incentive compensation (PBIC); research RVU (rRVU).


Conflict of interest statement

Declaration of Conflicting Interests: The author(s) declared no potential conflicts of interest with respect to the research, authorship, and/or publication of this article.

Figures

Figure 1.
Figure 1.
Base salary (part A) analysis. A, Base salaries for MD-trained, clinical faculty are shown. Faculty salaries are plotted in dollars on the y-axis versus years at rank on the x-axis. These are color coded as 3 groups corresponding to academic rank: assistant professors (light blue), associate professors (medium blue), and professors (dark blue). For each group, a linear regression shows the relationship between salary and years at rank. B, Residual amounts by gender. For each point, the distance between actual salary and salary predicted by the corresponding linear regression (ie, the residual) was determined. The density plot shows the frequency of residual amounts by gender (men, blue; women, red). A vertical line is drawn at zero; faculty paid exactly what would be predicted by their academic rank and years at rank contribute to area under the curve at this mark. Most residual variations in salary are less than ±$5000/year. Outliers on the right side of the plot are paid more than predicted; outliers on the left are paid less than predicted. These include 1 woman (residual more than +$5000) and 4 men (2 residuals less than −$5000; 2 residuals more than +$5000). The 4 men are professors with more than 15 years at rank.
Figure 2.
Figure 2.
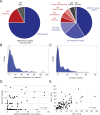
Bonus (part C) analysis by activity. Note that some activities, including clinical productivity, are not recognized with part C points. A, Part C points allocated over 2 years, 2015 to 2017. About 3 quarters of points were awarded for research activities (blue, 4236 points, 75.3%) with the remainder recognizing educational (963, 17.1%) and other (425) contributions. These categories are further subdivided in the pie chart on the right. Research is subdivided as: (1) points for first and last author publications (2328, 55.0% of research points), (2) points for research grant funding (1204, 28.4%), and (3) points for other authorships including middle authorships (704, 16.6%). Education is subdivided as: (1) points for in-house teaching (310, 32.2% of education points), (2) points for presentations outside of Johns Hopkins (346, 35.9%), (3) points for books and iPad applications (262, 27.2%), and (4) points for faculty development activities (45, 4.7%). Other includes 325 points awarded for quality assurance and quality improvement projects (5.8% of total) and 100 points for contributions to promote trainee and faculty diversity in the department (1.8% of total). B, Density plots showing the distribution of faculty receiving points for research publications (x-axis) each year. A vertical line is drawn at the origin. Most faculty received some points for first and last author publications. Data for 2015 to 2016 and 2016 to 2017 are superimposed. C, Density plots showing the distribution of faculty receiving points for research funding (x-axis) each year. D, Pairwise comparison of points for first and last author publications versus points for research funding, 2016 to 2017. Correlation coefficient (r2) = 0.45. E, Pairwise comparison of total part C points for 2015 to 2016 versus 2016 to 2017 (r2 = 0.33).
Figure 3.
Figure 3.
Bonus (part C) analysis by gender. A, Pie charts show part C point allocations for men (blue) and women (red) in 2015 to 2016 (left) and 2016 to 2017 (right). Total part C points were divided by numbers of faculty. Women made up 38% to 39% of faculty and earned 33% of part C points in 2015 to 2016 (943/2895) and 37% of part C points in 2016 to 2017 (1004/2729). B, Density plots showing the distribution of faculty receiving points for first and last author research publications (x-axis) each year by gender. In 2015 to 2016, the first and last author research publications subcategory contributed most to the gender difference. Both men and women are represented among “outliers” (>50 points, vertical line) for first and last author research publications in both years. C. Density plots showing the distribution of faculty receiving points for research funding (x-axis) each year by gender. Both men and women are represented among “outliers” (>30 points, vertical line) in both years. D, Density plots showing the distribution of points for education each year by gender.
Figure 4.
Figure 4.
Bonus (part C) analysis by academic rank. A, Pie charts show part C point allocations for different academic ranks, assistant professors (light blue), associate professors (medium blue), and professors (dark blue) in 2015 to 2016 (left) and 2016 to 2017 (right). Total part C points were divided by numbers of faculty. In 2016 to 2017, assistant professors made up 30% of faculty and received 23.5% of total part C points (634/2694), associate professors made up 31% of faculty and received 32.5% of points (875), and professors made up 39% of faculty and received 44% of points (1185). B, Plots showing points for first and last author publications for faculty subdivided by academic rank. Data for 2015 to 2016 are plotted on the left; 2016 to 2017 on the right. Horizontal, colored lines show average (mean) points earned, and colors correspond to academic ranks; gray boxes demarcate boundaries of the first (lower) and third (upper) quartiles of faculty; vertical (T shape) bars extend upward to show the standard deviation. C, Plots showing points earned for research funding, as in B. More senior faculty tend to earn more points in both subcategories, and professors are overrepresented among high-earning “outliers” in both years.

References

    1. McHugh PR. A “letter of experience” about faculty promotion in medical schools. Acad Med. 1994;69:877–881. - PubMed
    1. Overview of Medicare Parts A-D. J Oncol Pract. 2009;5:86–90. - PMC - PubMed
    1. Rand C, Fivush B, Ishii L, Clements J. Final Report and Actions 2014: Johns Hopkins School of Medicine Faculty Satisfaction Survey, 2013. Baltimore, MD: Johns Hopkins University School of Medicine; 2014.
    1. McArthur J, Kang S, Clements J, et al. Johns Hopkins Medicine—School of Medicine Taskforce on Improving Faculty Compensation Report to Dean Paul Rothman, Baltimore, MD: Johns Hopkins University School of Medicine; 2015.
    1. Reece EA, Nugent O, Wheeler RP, Smith CW, Hough AJ, Winter C. Adapting industry-style business model to academia in a system of performance-based incentive compensation. Acad Med. 2008;83:76–84. - PubMed

LinkOut - more resources