. 2018 May;2(3):235-243.
doi: 10.1109/TRPMS.2017.2771490. Epub 2017 Nov 9.

MR-Guided Kernel EM Reconstruction for Reduced Dose PET Imaging

Affiliations

MR-Guided Kernel EM Reconstruction for Reduced Dose PET Imaging

James Bland et al. IEEE Trans Radiat Plasma Med Sci. 2018 May.

Abstract

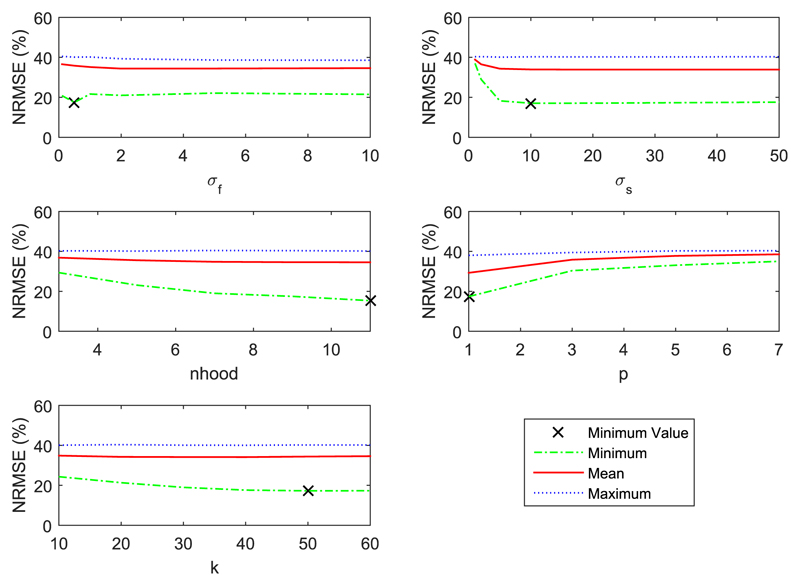
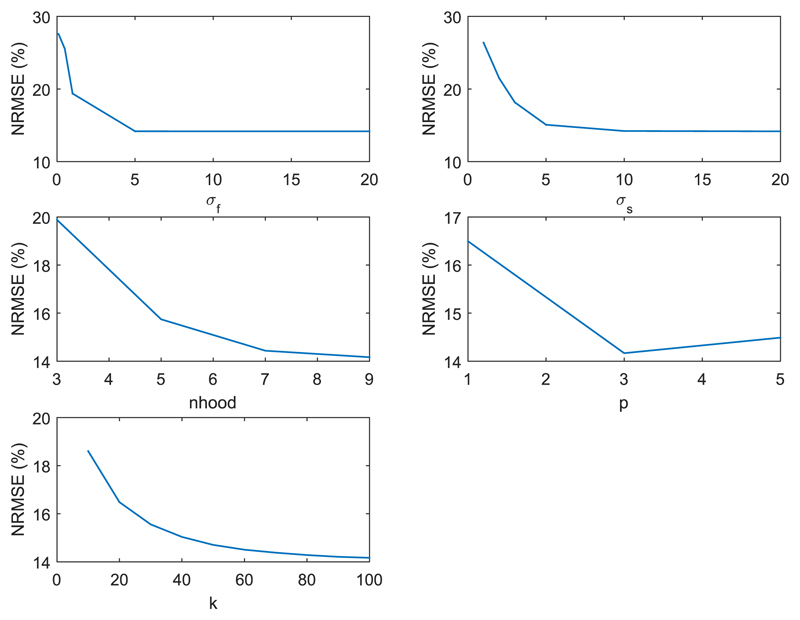
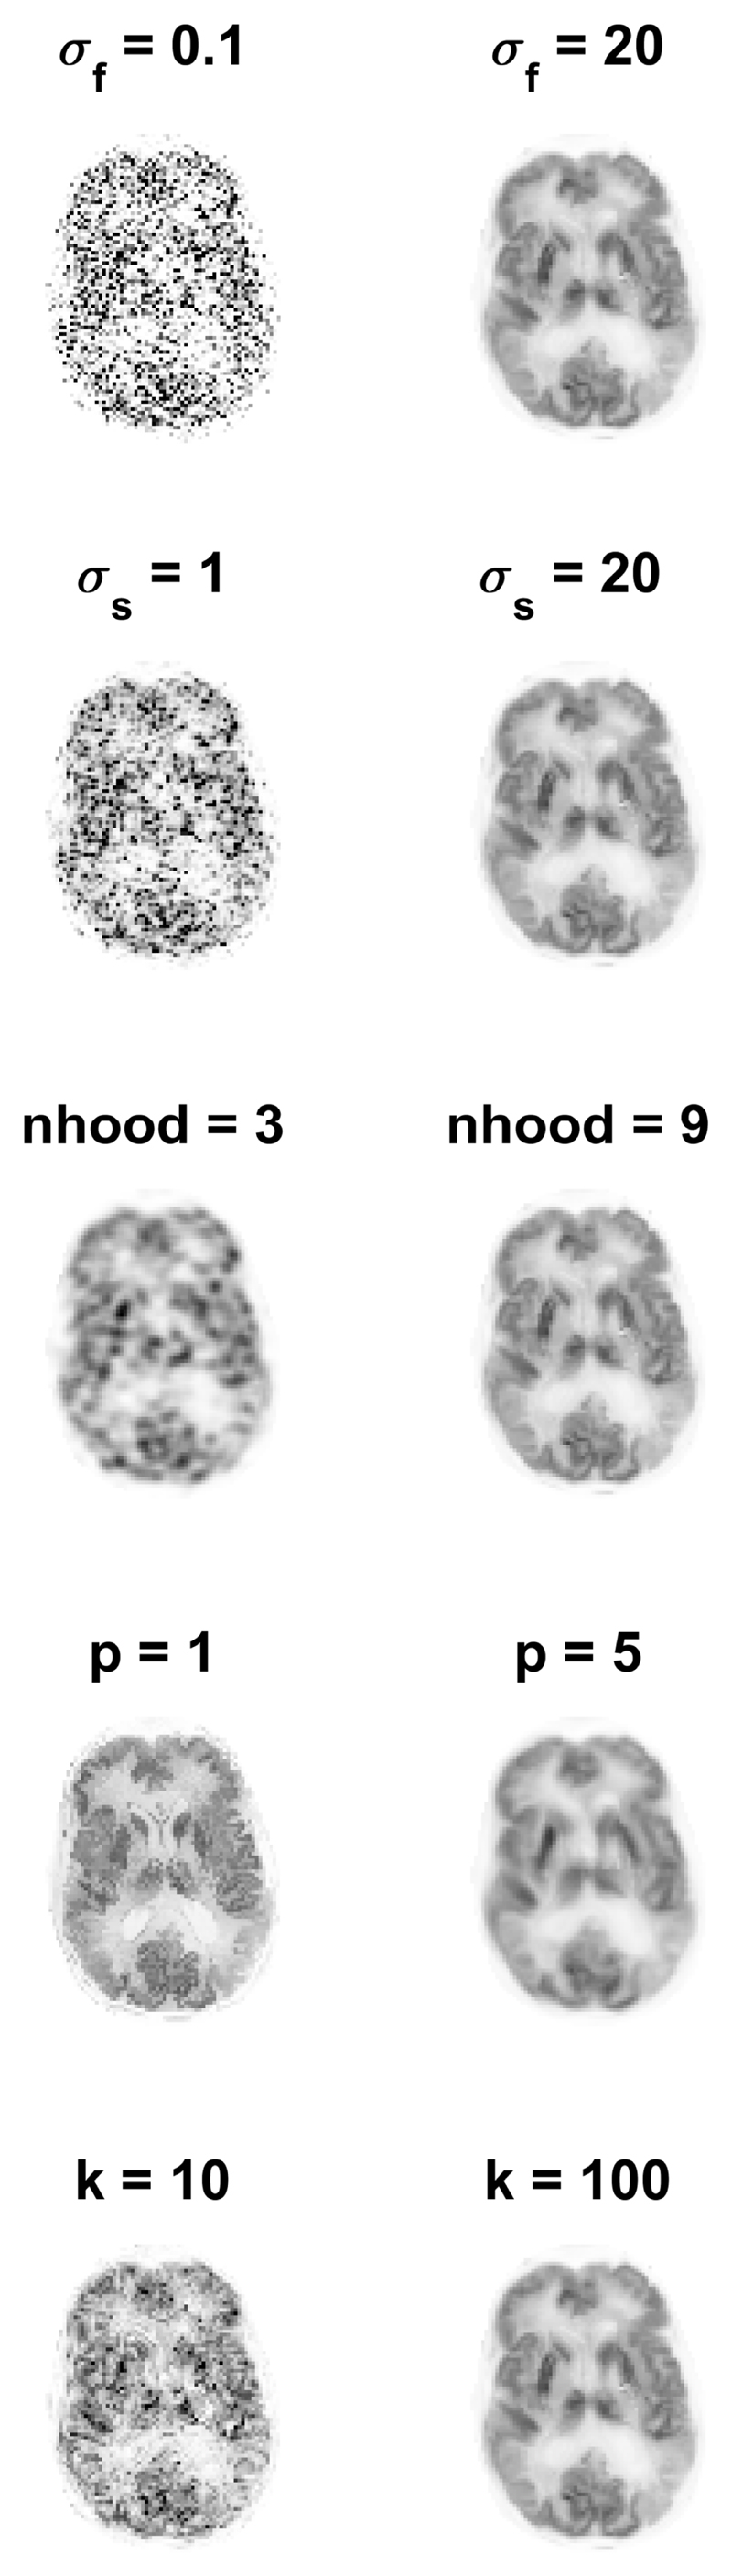
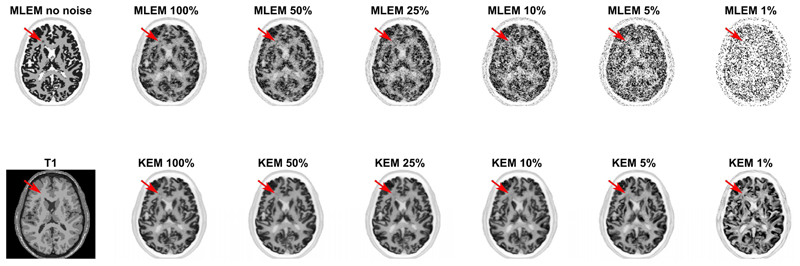
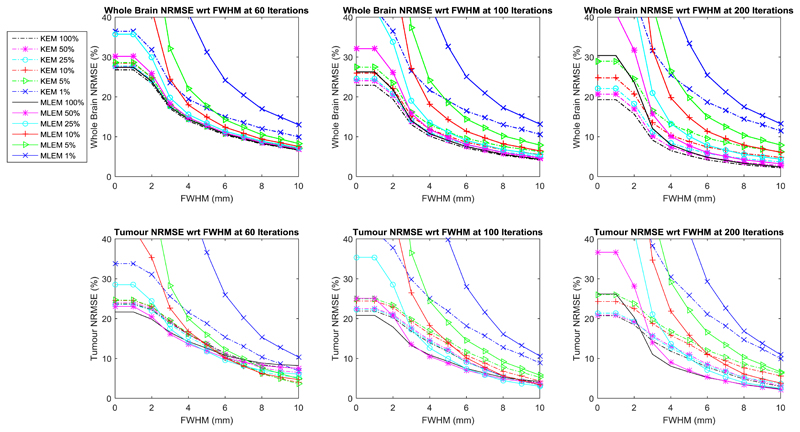
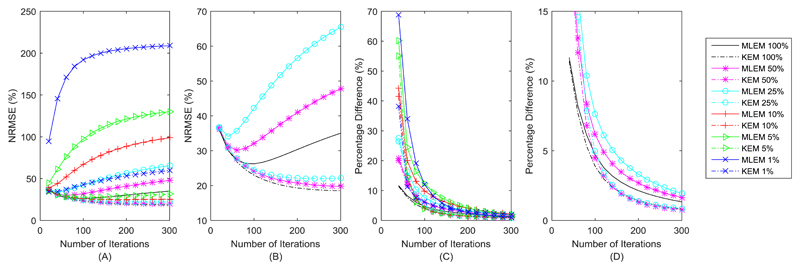
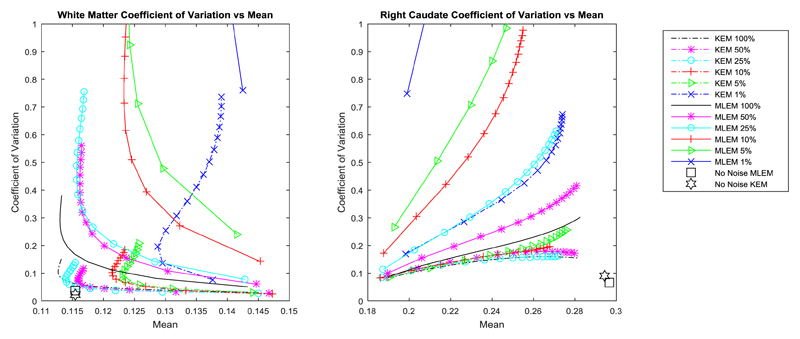
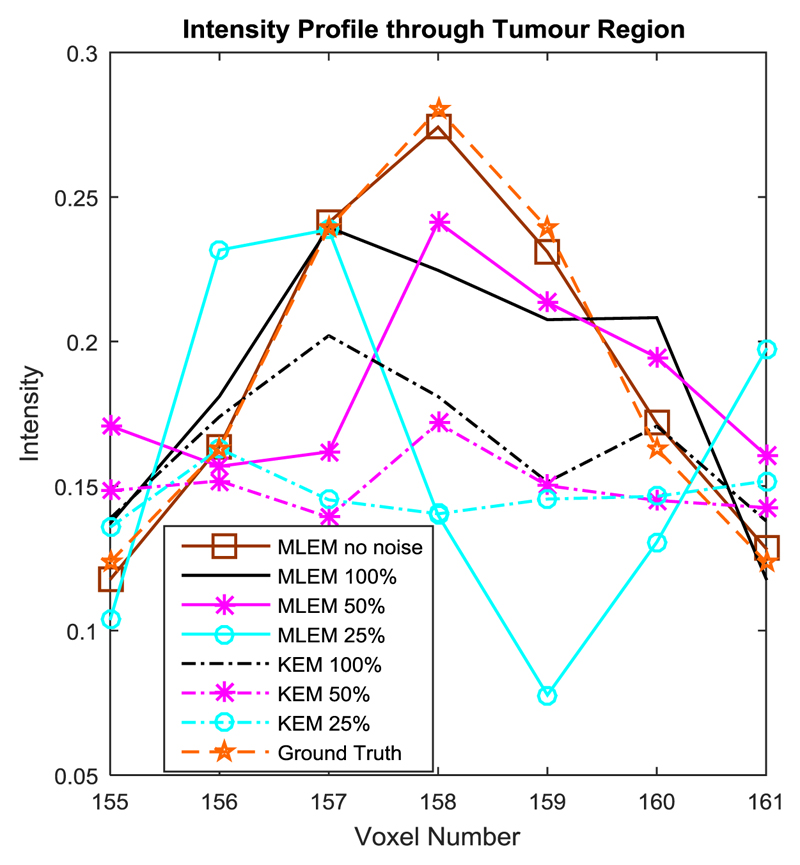
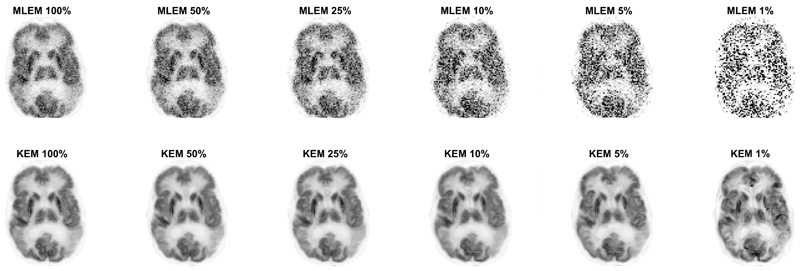
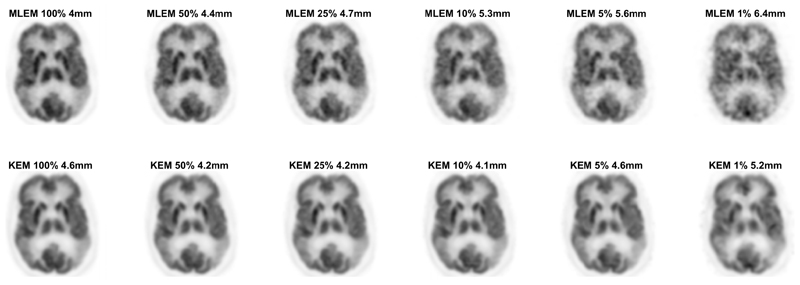
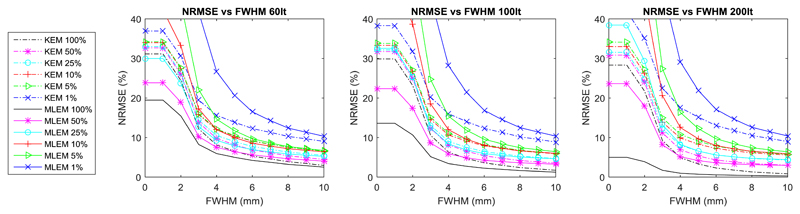
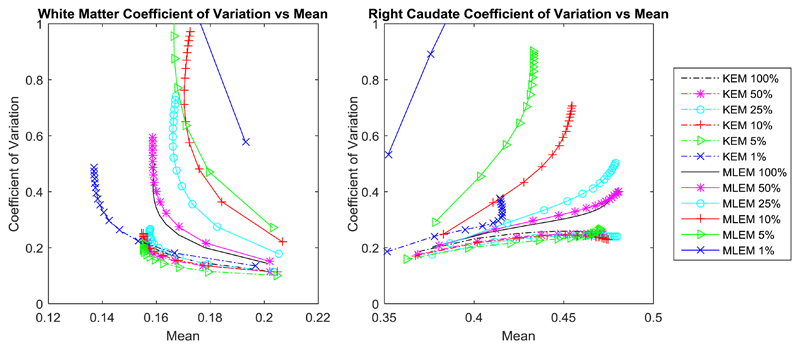
PET image reconstruction is highly susceptible to the impact of Poisson noise, and if shorter acquisition times or reduced injected doses are used, the noisy PET data become even more limiting. The recent development of kernel expectation maximisation (KEM) is a simple way to reduce noise in PET images, and we show in this work that impressive dose reduction can be achieved when the kernel method is used with MR-derived kernels. The kernel method is shown to surpass maximum likelihood expectation maximisation (MLEM) for the reconstruction of low-count datasets (corresponding to those obtained at reduced injected doses) producing visibly clearer reconstructions for unsmoothed and smoothed images, at all count levels. The kernel EM reconstruction of 10% of the data had comparable whole brain voxel-level error measures to the MLEM reconstruction of 100% of the data (for simulated data, at 100 iterations). For regional metrics, the kernel method at reduced dose levels attained a reduced coefficient of variation and more accurate mean values compared to MLEM. However, the advances provided by the kernel method are at the expense of possible over-smoothing of features unique to the PET data. Further assessment on clinical data is required to determine the level of dose reduction that can be routinely achieved using the kernel method, whilst maintaining the diagnostic utility of the scan.

Keywords: PET-MR; dose reduction; image reconstruction; positron emission tomography.


Figures

Fig. 1
Fig. 1
Repeated line search of each kernel parameter for a 2D simulated phantom. Each line search is repeated for 50 realisations of the other four fixed parameters. NRMSE refers to whole brain NRMSE.
Fig. 2
Fig. 2
Parameter line search for real 3D FDG data, initialised using the parameters determined from the 2D setup. Multiple cycles of the individual 1D parameter line search is undertaken until each parameter value remains unchanged. These graphs show the 1D parameter search for each parameter for the last cycle over all parameters.
Fig. 3
Fig. 3
The reconstructed KEM image using the maximum and minimum kernel parameter value in the range of each parameter. The left image (for each parameter) corresponds to the reconstructed image using the smallest kernel parameter value in the range, and the right image is reconstructed image using the largest kernel parameter. The remaining fixed kernel parameters are the 3D chosen parameters stated in Table 1.
Fig. 4
Fig. 4
2D slice of the MLEM and KEM reconstructions for reduced dose data of the 3D phantom. Reconstructions shown from 1% to 100% of the full count data, at 100 iterations. Kernel parameters used are stated in Table 1. k value varied with count level (10, 25, 25, 50, 50, 50 respectively). Tumour present in the PET data is not present in the T1 image. The location of the tumour is indicated by the red arrow.
Fig. 5
Fig. 5
Whole brain and tumour NRMSE between smoothed reduced dose reconstruction and the MLEM reconstruction of the noise free data at 300 iterations, for the 3D phantom data. Both the reduced dose reconstruction and the full dose reference are smoothed by the specified FWHM. The results are shown for different iteration numbers.
Fig. 6
Fig. 6
Panels A and B show the variation in whole brain NRMSE with respect to iteration number. B shows the higher count data only. C and D show the average pixel RMS percentage difference between iterations (shown for steps of 20) for each method. D shows the higher count data only.
Fig. 7
Fig. 7
Coefficient of variation vs mean value for a white matter region and the right caudate, calculated for the KEM and MLEM reconstructions of the simulated data. The corresponding value for the MLEM reconstruction of the no noise data at 300 iterations is shown by the single black square, with the KEM reconstruction of the no noise data shown by the black star. The ground truth value for the caudate region and the white matter region are 0.306 and 0.116 respectively.
Fig. 8
Fig. 8
Horizontal intensity profile through the tumour region in the frontal white matter region, at 100 iterations.
Fig. 9
Fig. 9
2D slice of the KEM and MLEM reconstruction of the 3D FDG data resampled at varying count levels. Reconstruction shown at 100 iterations. Kernel parameters used are stated in Table 1. k value varied with count level (10, 25, 25, 50, 50, 50 respectively).
Fig. 10
Fig. 10
2D slice of the KEM and MLEM reconstruction of the 3D FDG data resampled at varying count levels. All images have undergone post reconstruction smoothing, with the FWHM stated above each image. The width of the FWHM was chosen to minimise the NRMSE between the reduced dose image and the full count MLEM data, with 4mm post reconstruction smoothing. Reconstruction shown at 100 iterations.
Fig. 11
Fig. 11
Whole brain NRMSE between smoothed reduced dose reconstruction and the MLEM reconstruction of the full dose data at 300 iterations. Both the reduced dose reconstruction and the full dose reference are smoothed by the specified FWHM. The results are shown for different iteration numbers
Fig. 12
Fig. 12
Coefficient of variation vs mean value for a white matter region and the right caudate, calculated from the KEM and MLEM reconstructions of the real data.

References

    1. Shepp LA, Vardi Y. Maximum Likelihood Reconstruction for Emission Tomography. IEEE Trans Med Imaging. 1982 - PubMed
    1. Mumcuoglu EU, Leahy RM, Cherry SR. Bayesian reconstruction of PET images: methodology and performance analysis. Phys Med Biol Phys Med Biol. 1996;41(41):1777–1807. - PubMed
    1. Green PJ. Bayesian Reconstructions From Emission Tomography Data Using a Modified EM Algorithm. IEEE Trans Med IMAGING. 1990 Mar;9(1) - PubMed
    1. Green PJ. On Use of the EM for Penalized Likelihood Estimation On Use of the EM Algorithm for Penalized Likelihood Estimation. J R Stat Soc. 1990;52(3):443–452.
    1. Hebert T, Leahy R. A Generalized EM Algorithm for 3-D Bayesian Reconstruction from Poisson Data Using Gibbs Priors. IEEE Trans Med Imaging. 1989 - PubMed