Cost-effectiveness and Benefit-to-Harm Ratio of Risk-Stratified Screening for Breast Cancer: A Life-Table Model
- PMID: 29978189
- PMCID: PMC6230256
- DOI: 10.1001/jamaoncol.2018.1901
Cost-effectiveness and Benefit-to-Harm Ratio of Risk-Stratified Screening for Breast Cancer: A Life-Table Model
Erratum in
-
Errors in the Calculation Used to Estimate Number of Overdiagnoses in Study of Risk-Stratified Screening for Breast Cancer.JAMA Oncol. 2022 Mar 1;8(3):484. doi: 10.1001/jamaoncol.2021.7316. JAMA Oncol. 2022. PMID: 35050316 Free PMC article. No abstract available.
Abstract
Importance: The age-based or "one-size-fits-all" breast screening approach does not take into account the individual variation in risk. Mammography screening reduces death from breast cancer at the cost of overdiagnosis. Identifying risk-stratified screening strategies with a more favorable ratio of overdiagnoses to breast cancer deaths prevented would improve the quality of life of women and save resources.
Objective: To assess the benefit-to-harm ratio and the cost-effectiveness of risk-stratified breast screening programs compared with a standard age-based screening program and no screening.
Design, setting, and population: A life-table model was created of a hypothetical cohort of 364 500 women in the United Kingdom, aged 50 years, with follow-up to age 85 years, using (1) findings of the Independent UK Panel on Breast Cancer Screening and (2) risk distribution based on polygenic risk profile. The analysis was undertaken from the National Health Service perspective.
Interventions: The modeled interventions were (1) no screening, (2) age-based screening (mammography screening every 3 years from age 50 to 69 years), and (3) risk-stratified screening (a proportion of women aged 50 years with a risk score greater than a threshold risk were offered screening every 3 years until age 69 years) considering each percentile of the risk distribution. All analyses took place between July 2016 and September 2017.
Main outcomes and measures: Overdiagnoses, breast cancer deaths averted, quality-adjusted life-years (QALYs) gained, costs in British pounds, and net monetary benefit (NMB). Probabilistic sensitivity analyses were used to assess uncertainty around parameter estimates. Future costs and benefits were discounted at 3.5% per year.
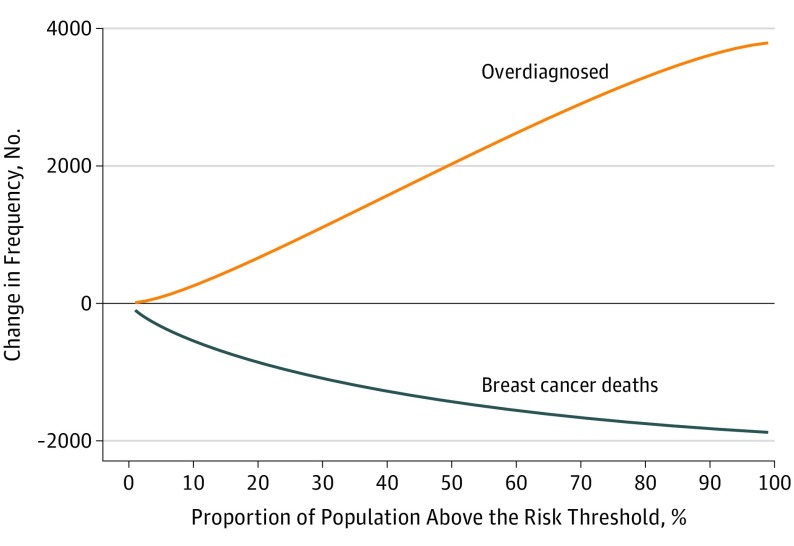
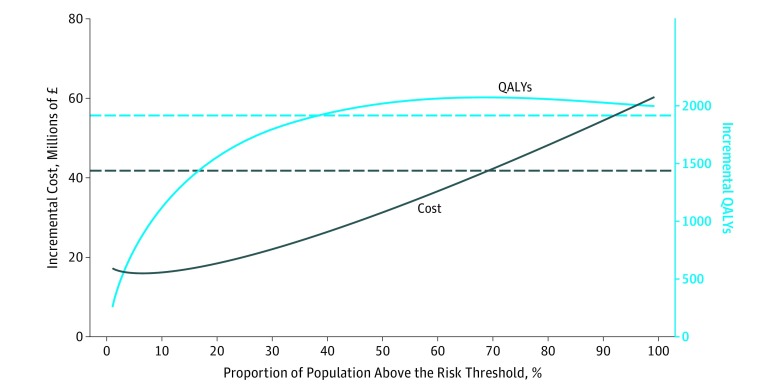
Results: The risk-stratified analysis of this life-table model included a hypothetical cohort of 364 500 women followed up from age 50 to 85 years. As the risk threshold was lowered, the incremental cost of the program increased linearly, compared with no screening, with no additional QALYs gained below 35th percentile risk threshold. Of the 3 screening scenarios, the risk-stratified scenario with risk threshold at the 70th percentile had the highest NMB, at a willingness to pay of £20 000 (US $26 800) per QALY gained, with a 72% probability of being cost-effective. Compared with age-based screening, risk-stratified screening at the 32nd percentile vs 70th percentile risk threshold would cost £20 066 (US $26 888) vs £537 985 (US $720 900) less, would have 26.7% vs 71.4% fewer overdiagnoses, and would avert 2.9% vs 9.6% fewer breast cancer deaths, respectively.
Conclusions and relevance: Not offering breast cancer screening to women at lower risk could improve the cost-effectiveness of the screening program, reduce overdiagnosis, and maintain the benefits of screening.
Conflict of interest statement
Figures
Comment in
-
Implementation Challenges for Risk-Stratified Screening in the Era of Precision Medicine.JAMA Oncol. 2018 Nov 1;4(11):1484-1485. doi: 10.1001/jamaoncol.2018.1940. JAMA Oncol. 2018. PMID: 29978191 No abstract available.
-
Targeted breast screening could reduce overdiagnosis and be more cost effective, study finds.BMJ. 2018 Jul 6;362:k3009. doi: 10.1136/bmj.k3009. BMJ. 2018. PMID: 29980526 No abstract available.
-
Precision risk-based screening might maximize benefit and minimize harm.Nat Rev Clin Oncol. 2018 Nov;15(11):661-662. doi: 10.1038/s41571-018-0093-0. Nat Rev Clin Oncol. 2018. PMID: 30218030 No abstract available.
-
Risk stratification in breast screening: A word of caution.J Med Screen. 2019 Jun;26(2):57-58. doi: 10.1177/0969141318813387. Epub 2018 Nov 18. J Med Screen. 2019. PMID: 30449245 No abstract available.
-
Overestimation of the Benefit-to-Harm Ratio of Risk-Based Mammography Screening in the United Kingdom-Reply.JAMA Oncol. 2019 Mar 1;5(3):428-429. doi: 10.1001/jamaoncol.2018.6504. JAMA Oncol. 2019. PMID: 30653219 No abstract available.
-
Overestimation of the Benefit-to-Harm Ratio of Risk-Based Mammography Screening in the United Kingdom.JAMA Oncol. 2019 Mar 1;5(3):428. doi: 10.1001/jamaoncol.2018.6501. JAMA Oncol. 2019. PMID: 30653221 No abstract available.
-
Concerns About Methods Used in Modeling Study of Risk-Stratified Screening for Breast Cancer.JAMA Oncol. 2022 Mar 1;8(3):483-484. doi: 10.1001/jamaoncol.2021.7311. JAMA Oncol. 2022. PMID: 35050325 No abstract available.
References
Publication types
MeSH terms
Grants and funding
LinkOut - more resources
Full Text Sources
Other Literature Sources
Medical