

Testing for center effects on survival and competing risks outcomes using pseudo-value regression
- PMID: 29978275
- PMCID: PMC6320737
- DOI: 10.1007/s10985-018-9443-6
Testing for center effects on survival and competing risks outcomes using pseudo-value regression
Abstract
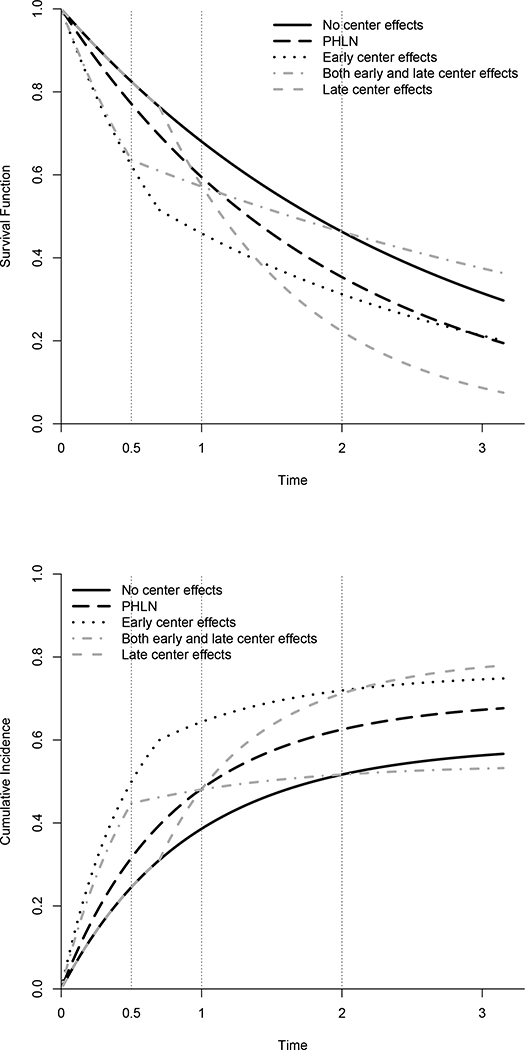
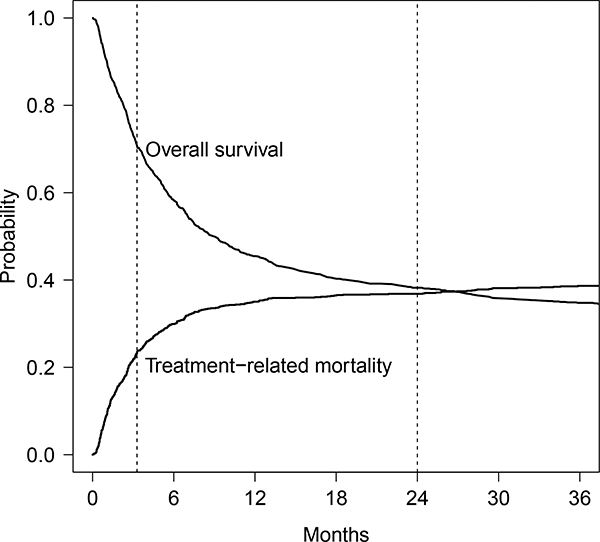
In multi-center studies, the presence of a cluster effect leads to correlation among outcomes within a center and requires different techniques to handle such correlation. Testing for a cluster effect can serve as a pre-screening step to help guide the researcher towards the appropriate analysis. With time to event data, score tests have been proposed which test for the presence of a center effect on the hazard function. However, sometimes researchers are interested in directly modeling other quantities such as survival probabilities or cumulative incidence at a fixed time. We propose a test for the presence of a center effect acting directly on the quantity of interest using pseudo-value regression, and derive the asymptotic properties of our proposed test statistic. We examine the performance of our proposed test through simulation studies in both survival and competing risks settings. The proposed test may be more powerful than tests based on the hazard function in settings where the center effect is time-varying. We illustrate the test using a multicenter registry study of survival and competing risks outcomes after hematopoietic cell transplantation.
Keywords: Clustered time to event data; Cumulative incidence; Generalized linear mixed model; Pseudo-value regression.
Figures
Similar articles
-
Marginal models for clustered time-to-event data with competing risks using pseudovalues.Biometrics. 2011 Mar;67(1):1-7. doi: 10.1111/j.1541-0420.2010.01416.x. Biometrics. 2011. PMID: 20377579 Free PMC article.
-
Dynamic pseudo-observations: a robust approach to dynamic prediction in competing risks.Biometrics. 2013 Dec;69(4):1043-52. doi: 10.1111/biom.12061. Epub 2013 Jul 19. Biometrics. 2013. PMID: 23865523
-
Stagewise pseudo-value regression for time-varying effects on the cumulative incidence.Stat Med. 2016 Mar 30;35(7):1144-58. doi: 10.1002/sim.6770. Epub 2015 Oct 28. Stat Med. 2016. PMID: 26510388
-
Vertical modeling: analysis of competing risks data with a cure fraction.Lifetime Data Anal. 2019 Jan;25(1):1-25. doi: 10.1007/s10985-018-9417-8. Epub 2018 Jan 31. Lifetime Data Anal. 2019. PMID: 29388073 Review.
-
A competing risks analysis should report results on all cause-specific hazards and cumulative incidence functions.J Clin Epidemiol. 2013 Jun;66(6):648-53. doi: 10.1016/j.jclinepi.2012.09.017. Epub 2013 Feb 14. J Clin Epidemiol. 2013. PMID: 23415868 Review.
Cited by
-
Differential network connectivity analysis for microbiome data adjusted for clinical covariates using jackknife pseudo-values.BMC Bioinformatics. 2024 Mar 18;25(1):117. doi: 10.1186/s12859-024-05689-7. BMC Bioinformatics. 2024. PMID: 38500042 Free PMC article.
References
-
- Andersen PK, Klein JP, RosthØj S (2003) Generalised linear models for correlated pseudo-observations, with applications to multi-state models. Biometrika 90(1):15–27. 10.1093/biomet/90.1.15 - DOI
-
- Commenges D, Andersen PK (1995) Score test of homogeneity for survival data. Lifetime Data Anal 1:145–156 - PubMed
-
- Fine JP, Gray RJ (1999) A proportional hazards model for the subdistribution of a competing risk. J Am Stat Assoc 94(446):496–509
Publication types
MeSH terms
Grants and funding
LinkOut - more resources
Full Text Sources
Other Literature Sources
