

Titin-based mechanosensing modulates muscle hypertrophy
- PMID: 29978560
- PMCID: PMC6204599
- DOI: 10.1002/jcsm.12319
Titin-based mechanosensing modulates muscle hypertrophy
Abstract
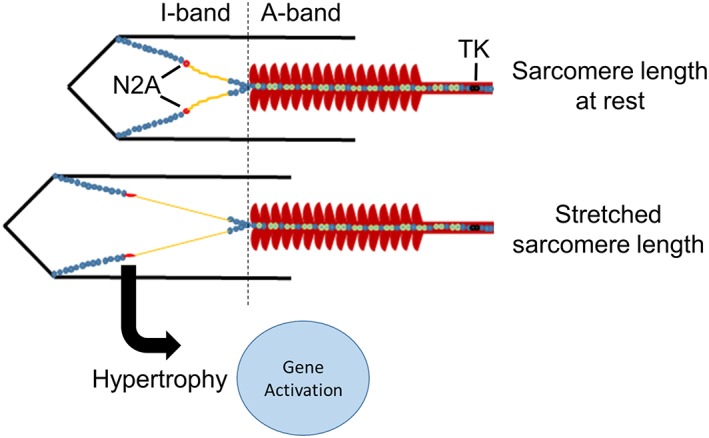
Background: Titin is an elastic sarcomeric filament that has been proposed to play a key role in mechanosensing and trophicity of muscle. However, evidence for this proposal is scarce due to the lack of appropriate experimental models to directly test the role of titin in mechanosensing.
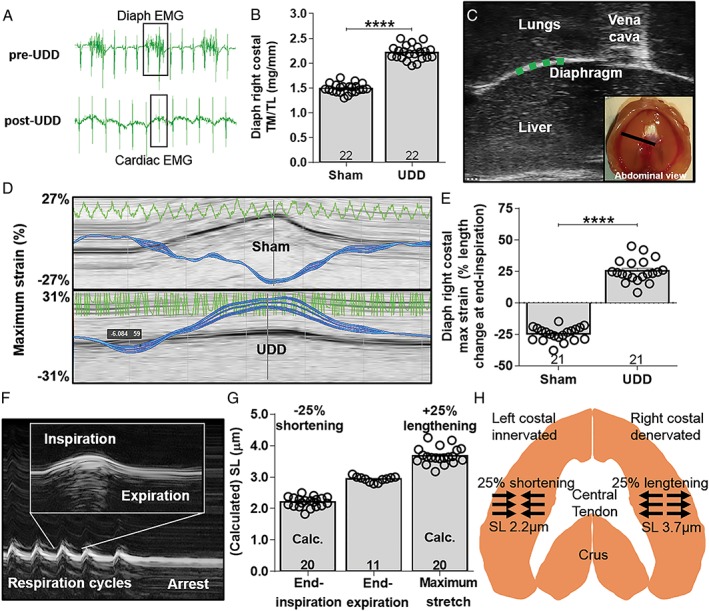
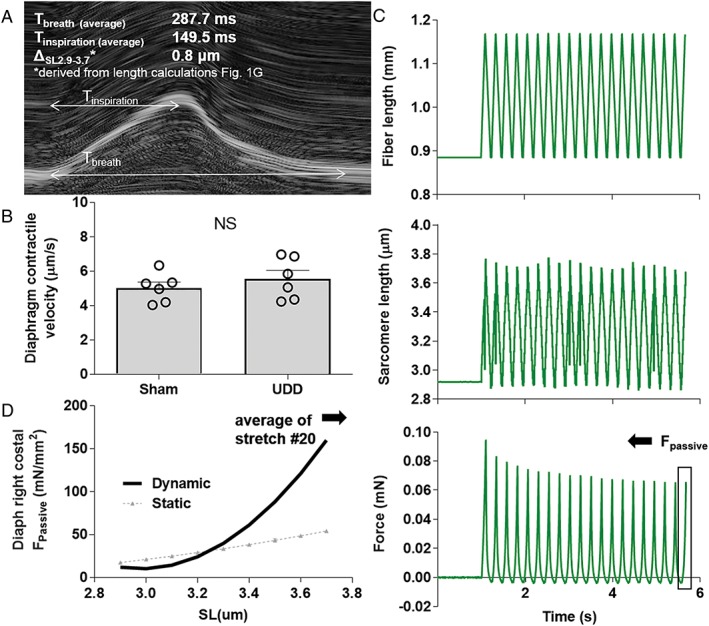
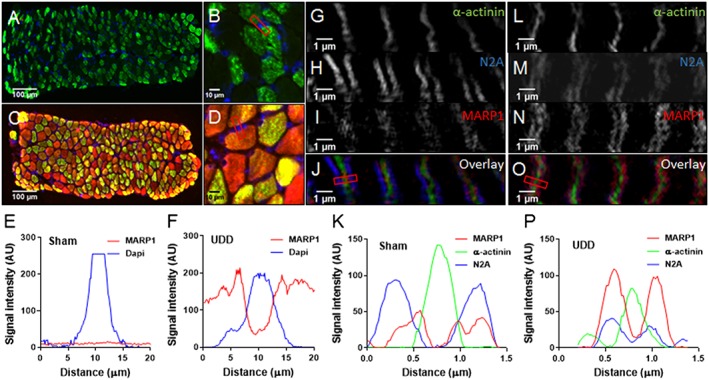
Methods: We used unilateral diaphragm denervation (UDD) in mice, an in vivo model in which the denervated hemidiaphragm is passively stretched by the contralateral, innervated hemidiaphragm and hypertrophy rapidly occurs.
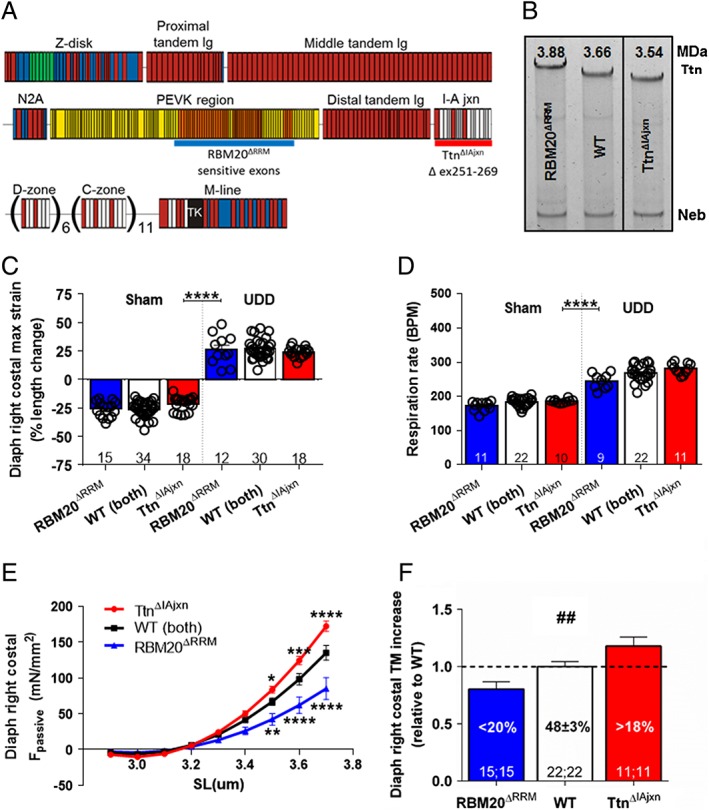
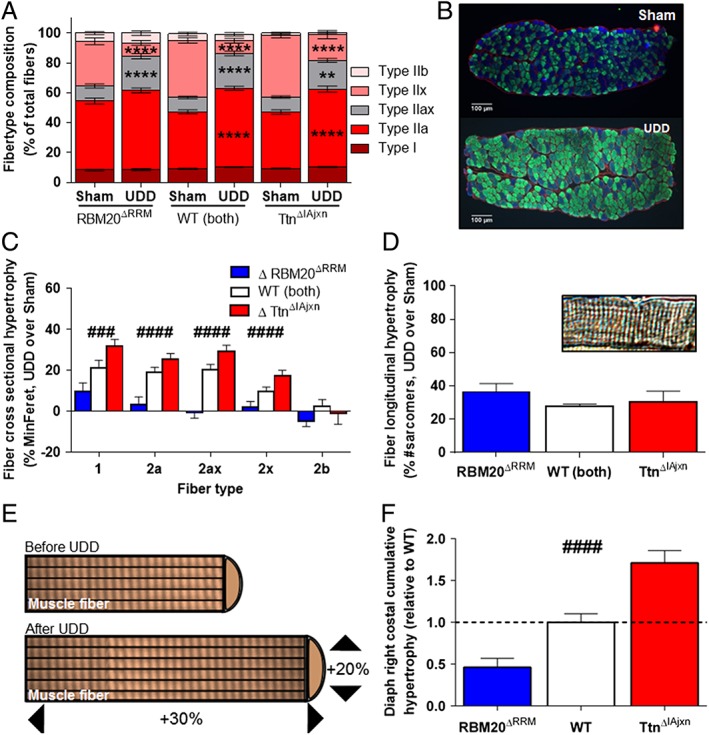
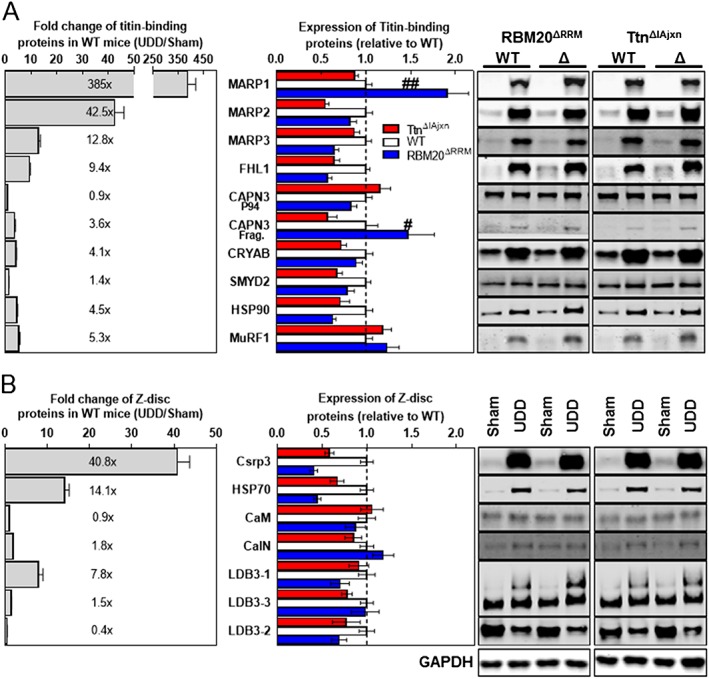
Results: In wildtype mice, the denervated hemidiaphragm mass increased 48 ± 3% after 6 days of UDD, due to the addition of both sarcomeres in series and in parallel. To test whether titin stiffness modulates the hypertrophy response, RBM20ΔRRM and TtnΔIAjxn mouse models were used, with decreased and increased titin stiffness, respectively. RBM20ΔRRM mice (reduced stiffness) showed a 20 ± 6% attenuated hypertrophy response, whereas the TtnΔIAjxn mice (increased stiffness) showed an 18 ± 8% exaggerated response after UDD. Thus, muscle hypertrophy scales with titin stiffness. Protein expression analysis revealed that titin-binding proteins implicated previously in muscle trophicity were induced during UDD, MARP1 & 2, FHL1, and MuRF1.
Conclusions: Titin functions as a mechanosensor that regulates muscle trophicity.
Keywords: Denervation; Diaphragm; Hypertrophy; Mechanosensing; Muscle stretch; Titin.
© 2018 The Authors. Journal of Cachexia, Sarcopenia and Muscle published by John Wiley & Sons Ltd on behalf of the Society on Sarcopenia, Cachexia and Wasting Disorders.
Figures
Similar articles
-
N2A Titin: Signaling Hub and Mechanical Switch in Skeletal Muscle.Int J Mol Sci. 2020 Jun 1;21(11):3974. doi: 10.3390/ijms21113974. Int J Mol Sci. 2020. PMID: 32492876 Free PMC article. Review.
-
Rbm20ΔRRM Mice, Expressing a Titin Isoform with Lower Stiffness, Are Protected from Mechanical Ventilation-Induced Diaphragm Weakness.Int J Mol Sci. 2022 Dec 10;23(24):15689. doi: 10.3390/ijms232415689. Int J Mol Sci. 2022. PMID: 36555335 Free PMC article.
-
Deleting Full Length Titin Versus the Titin M-Band Region Leads to Differential Mechanosignaling and Cardiac Phenotypes.Circulation. 2019 Apr 9;139(15):1813-1827. doi: 10.1161/CIRCULATIONAHA.118.037588. Circulation. 2019. PMID: 30700140 Free PMC article.
-
The titin N2A-MARP signalosome constrains muscle longitudinal hypertrophy in response to stretch.bioRxiv [Preprint]. 2025 Jun 25:2025.06.19.660595. doi: 10.1101/2025.06.19.660595. bioRxiv. 2025. PMID: 40667313 Free PMC article. Preprint.
-
Sense and stretchability: the role of titin and titin-associated proteins in myocardial stress-sensing and mechanical dysfunction.Cardiovasc Res. 2008 Mar 1;77(4):637-48. doi: 10.1016/j.cardiores.2007.03.029. Cardiovasc Res. 2008. PMID: 17475230 Review.
Cited by
-
Exercise-Induced Myofibrillar Hypertrophy is a Contributory Cause of Gains in Muscle Strength.Sports Med. 2019 Jul;49(7):993-997. doi: 10.1007/s40279-019-01107-8. Sports Med. 2019. PMID: 31016546 No abstract available.
-
Shortening the thick filament by partial deletion of titin's C-zone alters cardiac function by reducing the operating sarcomere length range.J Mol Cell Cardiol. 2022 Apr;165:103-114. doi: 10.1016/j.yjmcc.2022.01.002. Epub 2022 Jan 11. J Mol Cell Cardiol. 2022. PMID: 35031281 Free PMC article.
-
N2A Titin: Signaling Hub and Mechanical Switch in Skeletal Muscle.Int J Mol Sci. 2020 Jun 1;21(11):3974. doi: 10.3390/ijms21113974. Int J Mol Sci. 2020. PMID: 32492876 Free PMC article. Review.
-
Increased cardiac myosin super-relaxation as an energy saving mechanism in hibernating grizzly bears.Mol Metab. 2025 Feb;92:102084. doi: 10.1016/j.molmet.2024.102084. Epub 2024 Dec 16. Mol Metab. 2025. PMID: 39694092 Free PMC article.
-
Mechanisms of mechanical overload-induced skeletal muscle hypertrophy: current understanding and future directions.Physiol Rev. 2023 Oct 1;103(4):2679-2757. doi: 10.1152/physrev.00039.2022. Epub 2023 Jun 29. Physiol Rev. 2023. PMID: 37382939 Free PMC article. Review.
References
-
- Semsarian C, Wu MJ, Ju YK, Marciniec T, Yeoh T, Allen DG, Harvey RP, Graham RM. Skeletal muscle hypertrophy is mediated by a Ca2+‐dependent calcineurin signalling pathway. Nature 1999;400:576–581. - PubMed
-
- Wilkins BJ, Molkentin JD. Calcium‐calcineurin signaling in the regulation of cardiac hypertrophy. Biochem Biophys Res Commun 2004;322:1178–1191. - PubMed
-
- Lange S, Xiang F, Yakovenko A, Vihola A, Hackman P, Rostkova E, Kristensen J, Brandmeier B, Franzen G, Hedberg B, Gunnarsson LG, Hughes SM, Marchand S, Sejersen T, Richard I, Edström L, Ehler E, Udd B, Gautel M. The kinase domain of titin controls muscle gene expression and protein turnover. Science 2005;308:1599–1603. - PubMed
-
- Sheikh F, Raskin A, Chu PH, Lange S, Domenighetti AA, Zheng M, Liang X, Zhang T, Yajima T, Gu Y, Dalton ND, Mahata SK, Dorn GW 2nd, Brown JH, Peterson KL, Omens JH, McCulloch AD, Chen J. An FHL1‐containing complex within the cardiomyocyte sarcomere mediates hypertrophic biomechanical stress responses in mice. J Clin Invest 2008;118:3870–3880. - PMC - PubMed
Publication types
MeSH terms
Substances
Grants and funding
LinkOut - more resources
Full Text Sources
Other Literature Sources
Molecular Biology Databases
Research Materials
