. 2018 Jul 6:7:e35136.
doi: 10.7554/eLife.35136.

An automated high-resolution in vivo screen in zebrafish to identify chemical regulators of myelination

Affiliations

An automated high-resolution in vivo screen in zebrafish to identify chemical regulators of myelination

Jason J Early et al. Elife. .

Abstract

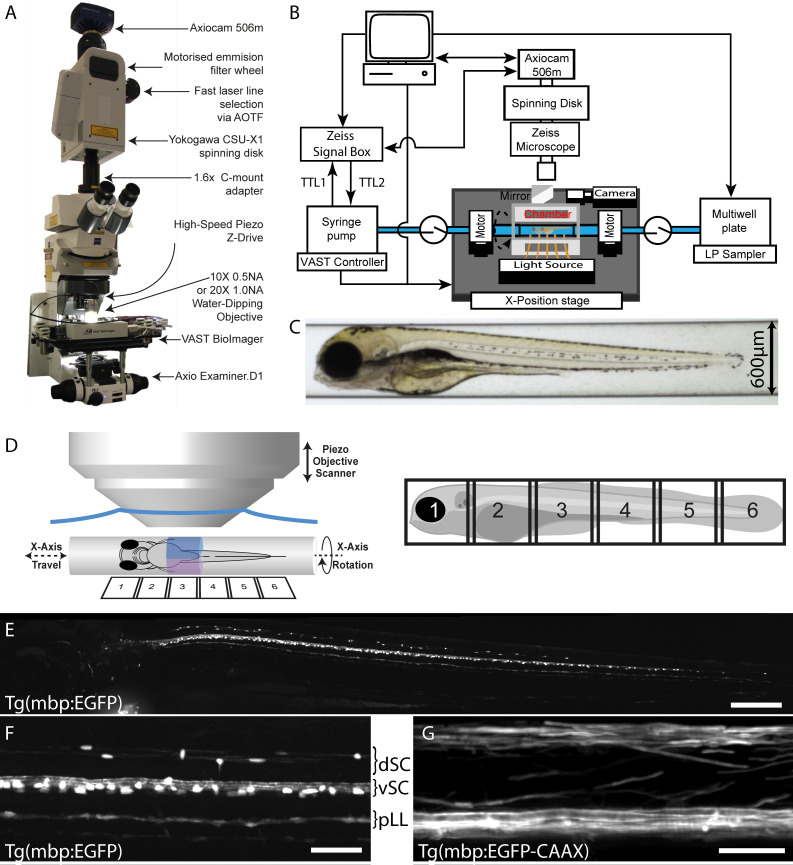
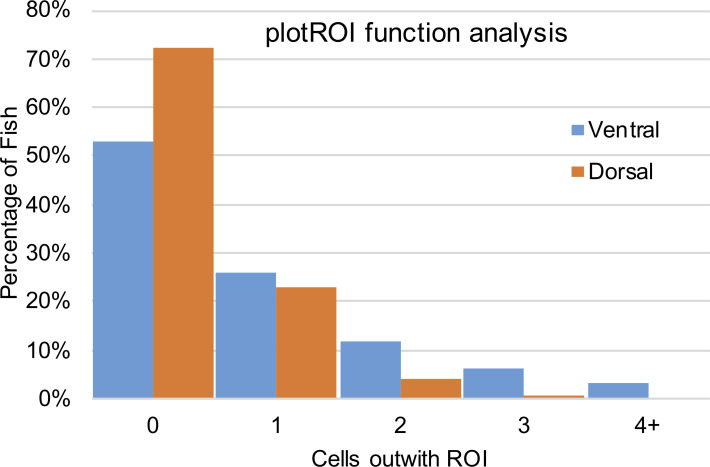
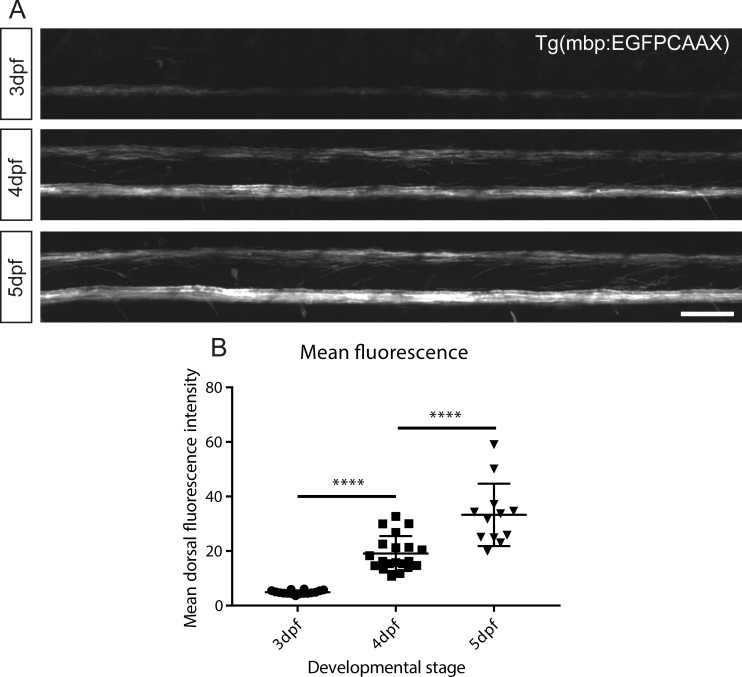
Myelinating oligodendrocytes are essential for central nervous system (CNS) formation and function. Their disruption is implicated in numerous neurodevelopmental, neuropsychiatric and neurodegenerative disorders. However, recent studies have indicated that oligodendrocytes may be tractable for treatment of disease. In recent years, zebrafish have become well established for the study of myelinating oligodendrocyte biology and drug discovery in vivo. Here, by automating the delivery of zebrafish larvae to a spinning disk confocal microscope, we were able to automate high-resolution imaging of myelinating oligodendrocytes in vivo. From there, we developed an image analysis pipeline that facilitated a screen of compounds with epigenetic and post-translational targets for their effects on regulating myelinating oligodendrocyte number. This screen identified novel compounds that strongly promote myelinating oligodendrocyte formation in vivo. Our imaging platform and analysis pipeline is flexible and can be employed for high-resolution imaging-based screens of broad interest using zebrafish.

Keywords: VAST; automated chemical screening; myelination; neuroscience; oligodendrocyte; zebrafish.


Conflict of interest statement

JE, MS, DL No competing interests declared, KC funded by a collaborative grant from Biogen for part of the period of this project, JW Jill M Williamson: funded by a collaborative grant from Biogen for part of the period of this project, HK was employed by Biogen at the time of the study, MM Marc Muskavitch: was employed by Biogen at the time of the study

Figures

Figure 1.
Figure 1.. VAST-SDCM setup for rapid, automated image acquisition at subcellular resolution.
(A) Overview of custom VAST BioImager and spinning-disk microscope setup, highlighting key components. (B) Schematic representation of hardware interaction between Zeiss SDCM, VAST BioImager and LP Sampler. (C) Representative brightfield image produced by VAST BioImager, showing a 4 dpf zebrafish embryo in a 600 µm glass capillary. (D) Illustration of relative setup of microscope objective and capillary. Note that the piezo range (400 µm) requires for two stacks (blue and magenta) to be acquired per tile of fish (6-tiles with 10% overlap required to image entire 4 dpf larva). (E) Maximum intensity projection of images of Tg(mbp:EGFP) zebrafish, following tiled merging of 6 z-stacks. Scale bar = 200 µm. (F) and G) Example images of mid-trunk region of Tg(mbp:EGFP) and Tg(mbp:EGFP-CAAX) fish imaged with 10 × 0.5 NA (3 × 3 binning) and 20 × 1 NA (1 × 1 binning) objectives respectively. Scale bars = 50 and 25 µm respectively). dSC = dorsal spinal cord, vSC = ventral spinal cord and pLL = posterior lateral line.
Figure 2.
Figure 2.. Fully automated ROI specification in Tg(mbp:EGFP) larval zebrafish.
(A) Schematic overview of 4 dpf larvae, illustrating the region (green rectangle) of Tg(mbp:EGFP) animal imaged using VAST-SDCM (B). (C) Example fluorescence intensity profile from region demarcated by green dashed lines in B. Each point on the profile is a sum of the grey values in X for a given Y position between the green dashed lines. (D) Along the length of the spinal cord, each point of peak fluorescence is marked by a blue circle. The points identified in this way delineate the ventral spinal cord (E). This line was then used to set regions of interest for dorsal and ventral spinal cord (F) and higher magnification view in G). Scale bars B, E and F = 250 µm, D = 100 µm, and G = 50 µm.
Figure 2—figure supplement 1.
Figure 2—figure supplement 1.. Comparison of manual 3D vs manual 2D cell counting methods.
All dorsal oligodendrocytes in the spinal cord of 11 animals treated with 1% DMSO were counted using a manual 3D stereological counting method, or by manual 2D assessment of a maximum intensity projection of the same 3D dataset.
Figure 2—figure supplement 2.
Figure 2—figure supplement 2.. Analysis of plotROI function.
The automatic region of interest function was used to analyse 196 fish, and the above graph shows the distribution of cells found outwith their appropriate ROI. Over the 196 fish, the macro failed to include an average of 1.2 cells per fish (236 cells/ 196 animals) in their appropriate ROI.
Figure 2—figure supplement 3.
Figure 2—figure supplement 3.. 3D-Cropping of images of complex transgenic animal.
(A) xz, xy, and yx maximum intensity projections of a 4 dpf Tg(mbp:nls-EGFP) animal, as presented to user for selection of ROI to be cropped in 3D. Magenta ROIs in xz and xy views show the user defined ROIs used for 3D crop. (B) and (C) Orthogonal maximum intensity projection views of pixels from within or outwith 3D ROI defined in A, for B and C respectively. Scale bar A-C = 250 µm. (D) Illustration of depth mapped image (right panel), where processCells selections are used to mask a maximum intensity depth projection, giving addition spatial information in absence of original 3D data.
Figure 3.
Figure 3.. Automated cell counting allows for effective quantification of oligodendrocyte cell number.
(A) Crop of dorsal spinal cord of 4 dpf Tg(mbp:EGFP) zebrafish larva acquired on VAST-SDCM. (B) Output of ImageJ’s findMaxima function (green dots), note that whilst not every cell is identified (e.g. the small dim cell indicated by orange arrow in C), some cells are identified multiple times (green arrows in C). (C) Output of findMaxima plus processCells function allows assessment of cell likeness, and removal of false positives, for example green arrows. (D) Comparison of count methods for individual fish, with ROIs and cell counts verified and corrected by a human, ROIs corrected by a human with automatic cell counts, and fully automated ROIs and cell counts.
Figure 4.
Figure 4.. Validation of automated image analysis to identify changes in myelinating cell number induced by chemical hit.
(AB) Confocal images of Tg(mbp:EGFP) control (A) and SKP2-C25-treated (B) animals reflecting mean cell number per treatment (numbers refer to entire dorsal spinal cord, not magnified area of same animals). Scale bar = 100 µm. (C) Quantitation of cell number in control and SKP2-C25 treated animals using fully automated (grey bars) and refined counts, auto ROIs (black bars). Two-way ANOVA followed by Dunnett’s multiple comparison test was used to assess statistical significance, with multiple comparison adjusted P value presented as *p<0.05, ***p<0.001. Error bars represent means ± s.d.
Figure 4—figure supplement 1.
Figure 4—figure supplement 1.. SKP2-C25 increases proliferation of OPCs in the dorsal spinal cord.
(A) Frames from time-lapse movies of Tg(Olig2:GFP), Tg(sox10:mRFP) double transgenic control (top) and SKP-C25-treated (bottom) embryos imaged between 58 hpf (left) and 70 hpf (right) Scale bar, 20 μm. (B) Frames from a time-lapse movie of a SKP2-C25-treated animal showing an individual OPC dividing to form two daughter cells (indicated by arrowheads). Scale bar, 20 μm. (C) Analyses of the time-lapse data showed that OPC proliferation events were significantly increased in SKP2-C25 treated animals.
Figure 5.
Figure 5.. Automated chemical screening pipeline in zebrafish identifies novel regulators of oligodendrocyte development.
(A) Schematic of chemical screening pipeline. (B) Results of primary screen displayed as normalised fold change in oligodendrocyte number relative to matched DMSO-treated controls and ranked by cell increase for all 183 treatments (146 unique compounds) with hit compounds that increase or decrease cell number marked in green and toxic compounds in red. Inset shows ranking of compounds that significantly increased oligodendrocyte cell number. See also Table 2 and Supplementary file 1 (C) Quantification of dorsal oligodendrocyte number from a single screening session showing comparison of different analysis methods. *p<0.05, ****p<0.0001. Error bars represent means ± s.d.
Figure 5—figure supplement 1.
Figure 5—figure supplement 1.. Example hits identified from our primary screen as regulators of oligodendrocyte development.
(A-D) (upper panels) Representative brightfield images of the Tg(mbp:EGFP) screening line following treatment with control (1%DMSO) (A), our top hit compound splitomicin (B) and two HDAC inhibitors, apicidin (C) and suberohydroxamic acid (SBHA) (D), that significantly decreased oligodendrocyte number in our screen. (B) Apicidin treatment disrupted morphological development of the jaw (indicated by arrow) and heart (indicated by arrowhead). Scale bar, 400 μm. (lower panels) Whole spinal cord images in the Tg(mbp:EGFP) line showing the effect of splitomicin, apicidin and SBHA on oligodendrocyte cell number. Mean numbers of dorsal oligodendrocytes quantified in the screen and in the example images shown are provided above each corresponding image. Scale bar, 200 μm.
Figure 6.
Figure 6.. Concentration series and chemical structures of hit compounds from screen.
For each hit identified in the primary screen, repeat treatments were carried out as before (12 fish treated from 2-4dpf), with either 1% DMSO, 0.5 µM, 1 µM, 2 µM, 4 µM, 10 µM or 20 µM of the hit treatment. For all compounds, the 10 and 20 µM treatments were fatal and are not shown on the above graphs. Chemical structures of each hit are displayed in respective graphs. One-way ANOVA followed by Dunnett’s multiple comparison test was used to assess statistical significance, with multiple comparison adjusted P value presented as *p<0.05, **p<0.01, ****p<0.0001. Error bars represent means ±s.d.
Figure 7.
Figure 7.. Automated region-specific analyses of identified hit compounds.
(A) Representative single tile images of 4 dpf Tg(mbp:EGFP) larvae following treatment with the five hit compounds that increased oligodendrocyte number in our screen. Scale bar, 100 μm. Mean numbers of dorsal oligodendrocytes quantified for each treatment and in the examples shown are indicated above each corresponding image. (B) Plot of the anterior-posterior distribution of dorsal oligodendrocytes along the spinal cord demonstrates region-specific effects with NU9056 and GSK-J5 treatment, whereas C646, SKP2-C25 and splitomicin exhibit more consistent increases in cell number along the A-P axis (D). (C) Quantification of oligodendrocyte number throughout the entire dorsal region shows lower sensitivity for identifying compounds with region-specific effects compared with quantification within one tile region (second of five tiles) (E). *p<0.05, **p<0.01, ***p<0.001, ****p<0.0001. Error bars represent means ± s.d.
Figure 8.
Figure 8.. Treatment with splitomicin increases spinal cord myelination in vivo.
(A) Representative images of myelin within the spinal cord of control (top) and splitomicin-treated (bottom) Tg(mbp:EGFP-CAAX) larvae. Scale bar, 50 μm (B) Quantification of mean fluorescence intensity throughout the entire dorsal spinal cord demonstrates a significant increase following 2–4 μM splitomicin treatment from 2-4 dpf. (C) Schematic of a transverse section through the zebrafish spinal cord shows the position of myelinated axons (blue) in relation to the gray matter (neuronal cell bodies are coloured in grey). Red box indicates approximate area shown in (D) in which myelinated axon number was quantified. (D): Transmission electron micrographs of control (left) and splitomicin-treated (right) larvae at 4 dpf with myelinated axons pseudo-coloured in blue. Scale bar, 1 μm (E) Numbers of myelinated axons in the dorsal spinal cord are significantly increased following 2–4 dpf treatment with 2 μM splitomicin. **p<0.01, ****p<0.0001. Error bars represent means ± s.d.
Figure 8—figure supplement 1.
Figure 8—figure supplement 1.. Automated fluorescent quantification of myelin during development.
(A) Representative lateral views of the spinal cord in Tg(mbp:EGFP-CAAX) larvae, where EGFP is targeted to the membrane of oligodendrocytes, demonstrating a developmental increase in myelinated structures from 3 to 5 dpf in vivo. Scale bar, 50 μm. (B) Automated quantification of the mean fluorescence intensity within the dorsal region shows a significant increase from 3 to 4 dpf and from 4 to 5 dpf (One-way ANOVA with Tukey’s multiple comparisons test, p<0.0001 average fluorescent intensity (AU) from 3 to 4 dpf and 4–5 dpf). Error bars represent means ± s.d.
Figure 9.
Figure 9.. Splitomicin enhances mammalian oligodendrocyte generation in vitro.
(A) Representative images of rat oligodendrocyte cultures treated with 1% DMSO or 3 µM splitomicin, stained for antibodies that recognise MBP, Olig2 and Ki67. Scale bar = 50 µm. (BD) Quantification of Olig2+ cell number (B), MBP+ cell number (C) and Ki67+ Olig2+ cell number (D). Shapiro-Wilk normality test determined that datasets were not normally distributed. Therefore, a Kruskal-Wallis test was followed by Dunn’s multiple comparison test to test statistical significance between conditions. *p<0.05, **p<0.01. Error bars represent means ± s.e.m.

References

    1. Almeida RG, Czopka T, ffrench-Constant C, Lyons DA. Individual axons regulate the myelinating potential of single oligodendrocytes in vivo. Development. 2011;138:4443–4450. doi: 10.1242/dev.071001. - DOI - PMC - PubMed
    1. Almeida RG, Lyons DA. On myelinated axon plasticity and neuronal circuit formation and function. The Journal of Neuroscience. 2017;37:10023–10034. doi: 10.1523/JNEUROSCI.3185-16.2017. - DOI - PMC - PubMed
    1. Almeida RG, Pan S, Cole KLH, Williamson JM, Early JJ, Czopka T, Klingseisen A, Chan JR, Lyons DA. Myelination of neuronal cell bodies when myelin supply exceeds axonal demand. Current Biology. 2018;28:1296–1305. doi: 10.1016/j.cub.2018.02.068. - DOI - PMC - PubMed
    1. Auer F, Vagionitis S, Czopka T. Evidence for myelin sheath remodeling in the CNS revealed by in Vivo Imaging. Current Biology. 2018;28:549–559. doi: 10.1016/j.cub.2018.01.017. - DOI - PubMed
    1. Bartzokis G. Alzheimer's disease as homeostatic responses to age-related myelin breakdown. Neurobiology of Aging. 2011;32:1341–1371. doi: 10.1016/j.neurobiolaging.2009.08.007. - DOI - PMC - PubMed

Publication types