

More are better, but the details matter: combinations of multiple Fresnel zone plates for improved resolution and efficiency in X-ray microscopy
- PMID: 29979166
- PMCID: PMC6038614
- DOI: 10.1107/S1600577518007208
More are better, but the details matter: combinations of multiple Fresnel zone plates for improved resolution and efficiency in X-ray microscopy
Abstract
Fresnel zone plates used for X-ray nanofocusing face high-aspect-ratio nanofabrication challenges in combining narrow transverse features (for high spatial resolution) along with extended optical modulation along the X-ray beam direction (to improve efficiency). The stacking of multiple Fresnel zone plates along the beam direction has already been shown to offer improved characteristics of resolution and efficiency when compared with thin single zone plates. Using multislice wave propagation simulation methods, here a number of new schemes for the stacking of multiple Fresnel zone plates are considered. These include consideration of optimal thickness and spacing in the axial direction, and methods to capture a fraction of the light otherwise diffracted into unwanted orders, and instead bring it into the desired first-order focus. The alignment tolerances for stacking multiple Fresnel zone plates are also considered.
Keywords: Fresnel zone plates; X-ray microscopy; X-ray optics.
open access.
Figures
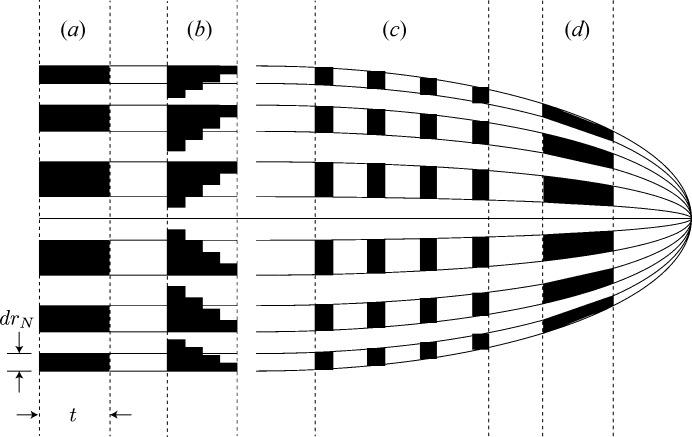
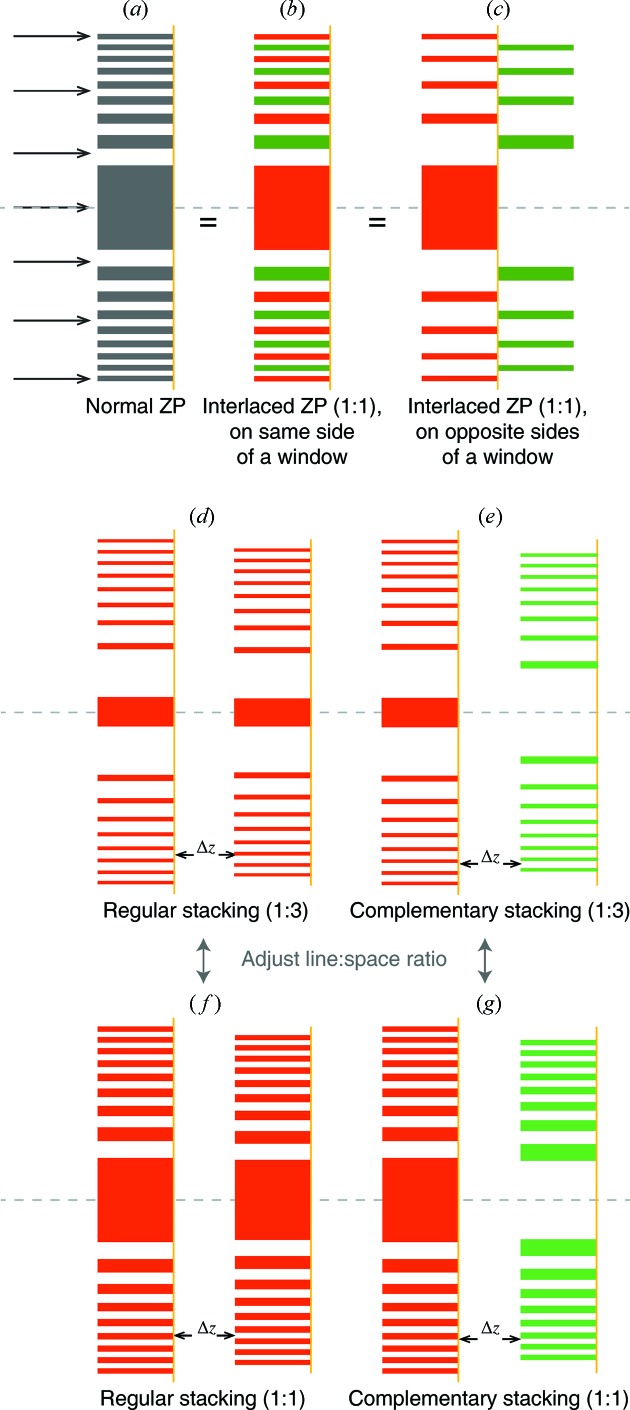
 and a thickness t; it applies a constant magnitude reduction or phase shift across each zone, while a blazed zone plate (b) puts a staircase approximation of a phase ramp across the zone. One can stack several thin Fresnel zone plates (c) to manipulate the wave at several locations leading to the focus, or use thicker zones (d) which are individually tilted to meet the Bragg grating condition or even curved in a volume hologram approach to produce the converging wavefield.
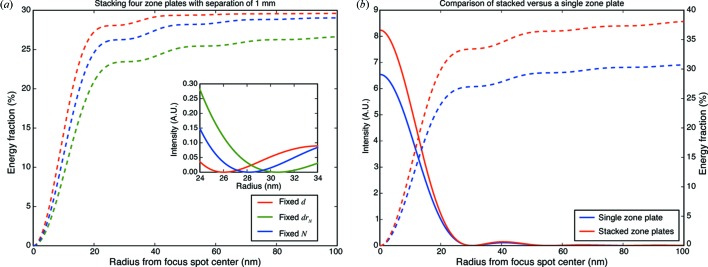
 = 1000 µm relative to the focal length of
  = 9074 µm for the first, upstream zone plate. The inset shows that the strategy of fixed diameter d gives a higher Rayleigh resolution (smaller radius for the first minimum of the intensity distribution) than the strategies of fixed outermost zone width or fixed zone number N. On the right (b) is shown the integrated energy fraction for a single
  = 2000 nm-thick zone plate versus four = 500 nm-thick zone plates separated by = 50 µm, and designed according to the fixed diameter d strategy. If multiple thinner zone plates can be aligned with sufficient accuracy, they can offer higher overall focusing efficiency (though in this case the separation between the zone plates is so small that they all have essentially the same numerical aperture, so there is no spatial resolution gain).
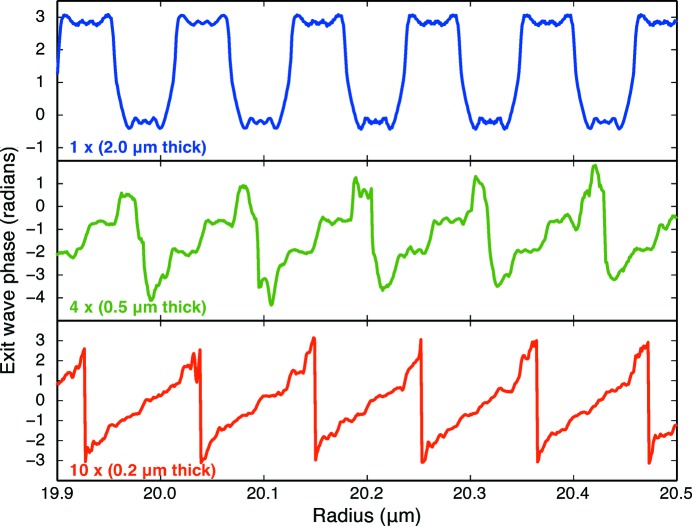
 = 2.0 µm-thick zone plate of gold for 10 keV X-ray focusing, (middle) four 0.5 µm-thick zone plates, and (bottom) ten 0.2 µm-thick zone plates. In each case the phase of the exit wave from the final downstream zone plate is shown. By using multiple thin zone plates, one can better approximate the phase profile of a blazed zone plate (Fig. 1b
▸).
= 2.0 µm-thick zone plate of gold for 10 keV X-ray focusing, (middle) four 0.5 µm-thick zone plates, and (bottom) ten 0.2 µm-thick zone plates. In each case the phase of the exit wave from the final downstream zone plate is shown. By using multiple thin zone plates, one can better approximate the phase profile of a blazed zone plate (Fig. 1b
▸).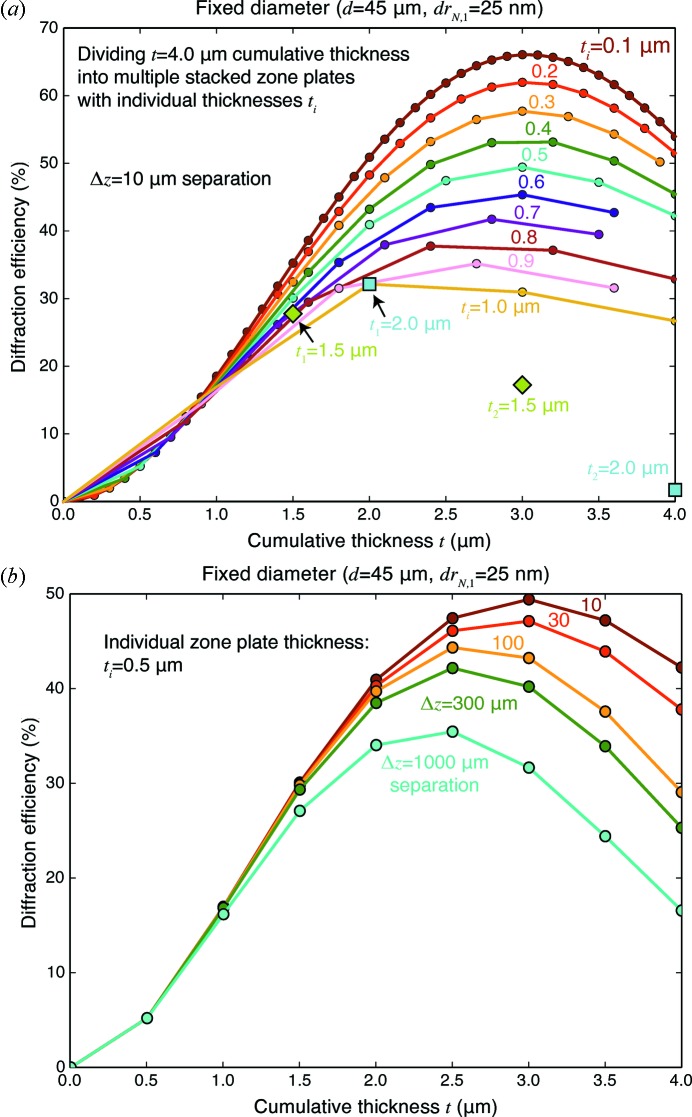
 that can be stacked together, one can obtain gains in first-order diffraction efficiency
  that go well beyond the simple thin zone plate expression of equation (1). In (a) we show the efficiency as a function of individual zone plate thickness
  and cumulative thickness t, where =
  zone plates are used with with a separation of = 10 µm (for
  = 45 µm, and = 25 nm for the first zone plate at 10 keV). A single gold zone plate with the optimum thickness = 2.0 µm would give = 32.7%, whereas much higher efficiencies can be obtained by using many more zone plates with slightly higher cumulative thickness. In (b) we show how the stacking of = 8 zone plates, each with a thickness = 0.5 µm, leads to differences in diffraction efficiency as one changes the separation distance between zone plates. Smaller separation distances are preferable but might be impractical, but even with larger separation distances like = 1000 µm one can still obtain an efficiency of = 36% if = 5 zone plates are used. All calculations were for gold zone plates at 10 keV.
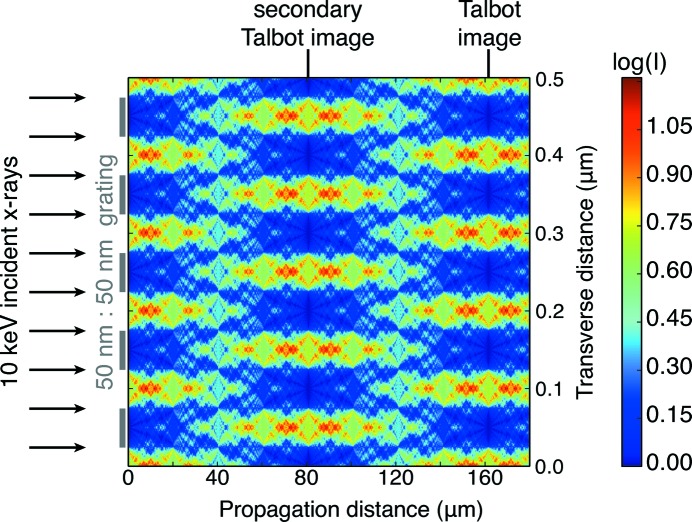
 =
=  [equation (10)] where a is the period of the diffraction grating. For a grating period of
  = 100 nm, and
  = 0.124 nm (corresponding to 10 keV X-rays), the Talbot distance is = 161 µm. The grating here was assumed to be fully absorptive.
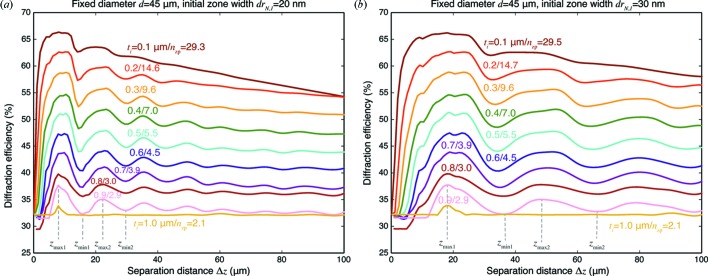 versus separation distance for different thicknesses of individual zone plates, and for two different values of outermost zone width: = 20 nm (a) and = 30 nm (b). For each individual zone thickness and separation distance , the number of stacked zone plates was chosen to give maximum efficiency, as shown in Fig. 4(b) ▸, and the average value of corresponding to a particular value of is indicated. As can be seen, there is a pattern of maxima and minima in the efficiences as a function of separation distance , with the first two maxima denoted by
  and
and  , and the first two minima denoted by
  and
and  . These maxima and minima are compared with the Talbot distance [equation (10)] for the outermost zones in Fig. 7 ▸.
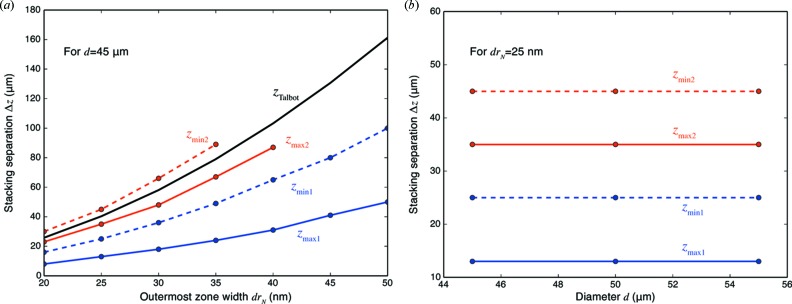
 and minima
  shown in Fig. 6 ▸ as a function of varying outermost zone width (a) or diameter d (b). This was done for an individual zone plate thickness of = 0.9 µm. Clearly the separation distances show maxima and minima that scale with outermost zone width rather than diameter d. Also shown on the left is the Talbot distance based on equation (10) for a grating with a period =
  determined by the outermost zone width. The efficiency maxima and minima scale with , but the ideal separation distance corresponding to is at about one-quarter of the distance
  .
.
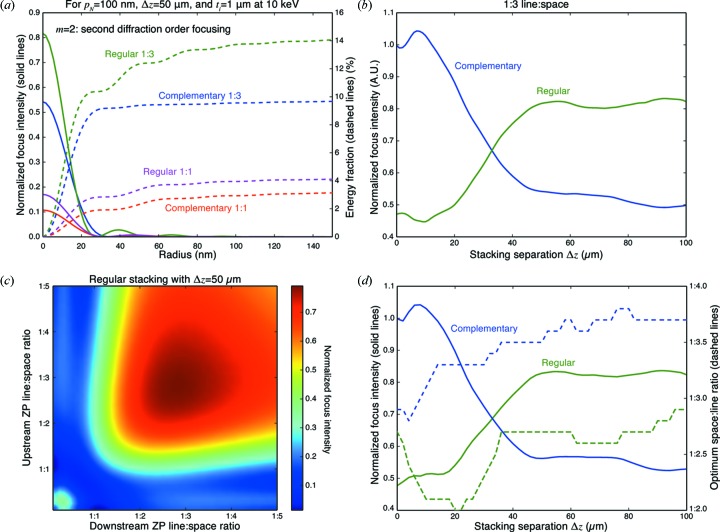 = 1 µm thickness, at 10 keV photon energy. Using the four different stacking schemes shown in Fig. 8 ▸, in (a) we show both the radial intensity profile and also the radially integrated energy for
  = 2 second diffraction order focusing. The 1:3 line:space approach with the second zone plate being a complementary zone plate has a unique property of having very little energy in sidelobes around the central focus spot. In (b) we show the normalized focus intensity for 1:3 line:space stacking with regular and complementary second zone plate as a function of separation distance , demonstrating a crossover between which approach is preferred at half of
  of equation (13). In (c) we show the focal spot intensity as the line:space ratio is adjusted in both the upstream and (regular) downstream zone plate; the optimum line:space ratio for a variety of separation distances is shown in (d).
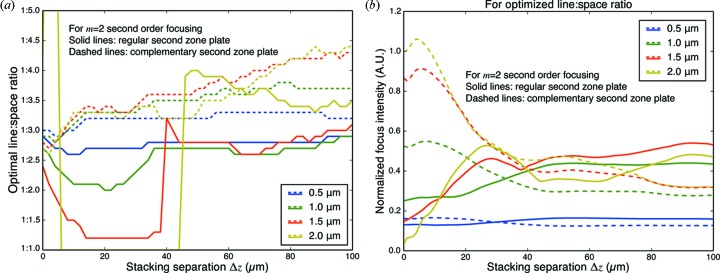 = 2 second-order focusing as a function of both zone thickness and separation distance . The differences between using a regular or a complementary zone plate for the second optic become larger when thickness approaches 2 µm which corresponds to a π phase shift.
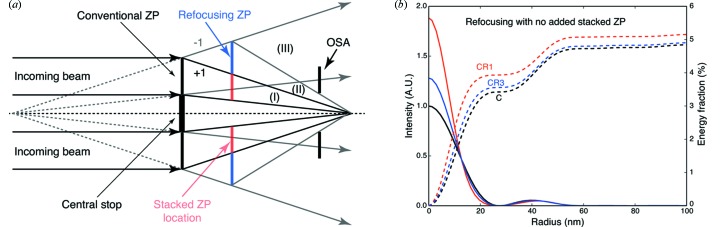 = −1-order focus light from a conventional zone plate. This is shown schematically in (a), where one can produce a combined optic with a stacked zone plate in the inner diameter and a refocusing zone plate operating in either
  = 1 or first diffraction order, or = 3 or third diffraction order. The effect on the focus profile and integrated energy as a function of radius is shown in (b), for the cases of a conventional zone plate alone (case C), or with the addition of a refocusing zone plate operating in first diffraction order (case CR1), or with a refocusing zone plate operating in third diffraction order (case CR3). Both refocusing zone plates offer an increase in focal efficiency, with the CR1 case also offering an improvement in spatial resolution. However, in the CR1 case the refocusing zone plate must have finer zone width than the conventional zone plate, and usually the conventional zone plate is fabricated out to the limits of what can be achieved in nanolithography; in the CR3 case, the finest zone width is the same for the conventional (C) and third-order refocusing (R3) zone plates. The parameters for the zone plates used for the calculation of focal intensities (b) are given in Table 2 ▸.
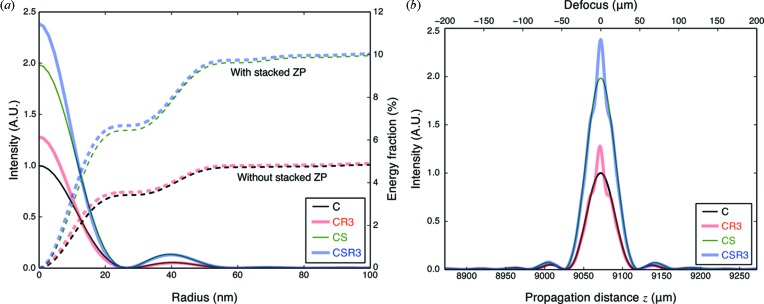
 due to the presence of the third diffraction order refocusing zone plate (R3). The parameters for the individual zone plates are shown in Table 3 ▸.
References
-
- Aristov, V. V., Isoyan, A., Kohn, V., Kuyumchyan, A., Shulakov, E., Snigirev, A. A. & Snigireva, I. (2007). Nucl. Instrum. Methods Phys. Res. A, 575, 238–241.
-
- Attwood, D. & Sakdinawat, A. (2017). X-rays and Extreme Ultraviolet Radiation, 2nd ed. Cambridge University Press.
-
- Chang, C. & Sakdinawat, A. (2014). Nat. Commun. 5, 4243. - PubMed
-
- Chao, W., Harteneck, B. D., Liddle, J. A., Anderson, E. H. & Attwood, D. T. (2005). Nature (London), 435, 1210–1213. - PubMed
-
- Cowley, J. M. & Moodie, A. F. (1957). Acta Cryst. 10, 609–619.
Grants and funding
LinkOut - more resources
Full Text Sources
Other Literature Sources
