. 2018 Dec;53(12):705-713.
doi: 10.1097/RLI.0000000000000492.

Feasibility of Diffusion Tensor and Morphologic Imaging of Peripheral Nerves at Ultra-High Field Strength

Affiliations

Feasibility of Diffusion Tensor and Morphologic Imaging of Peripheral Nerves at Ultra-High Field Strength

Annina B Schmid et al. Invest Radiol. 2018 Dec.

Abstract

Objectives: The aim of this study was to describe the development of morphologic and diffusion tensor imaging sequences of peripheral nerves at 7 T, using carpal tunnel syndrome (CTS) as a model system of focal nerve injury.

Materials and methods: Morphologic images were acquired at 7 T using a balanced steady-state free precession sequence. Diffusion tensor imaging was performed using single-shot echo-planar imaging and readout-segmented echo-planar imaging sequences. Different acquisition and postprocessing methods were compared to describe the optimal analysis pipeline. Magnetic resonance imaging parameters including cross-sectional areas, signal intensity, fractional anisotropy (FA), as well as mean, axial, and radial diffusivity were compared between patients with CTS (n = 8) and healthy controls (n = 6) using analyses of covariance corrected for age (significance set at P < 0.05). Pearson correlations with Bonferroni correction were used to determine association of magnetic resonance imaging parameters with clinical measures (significance set at P < 0.01).

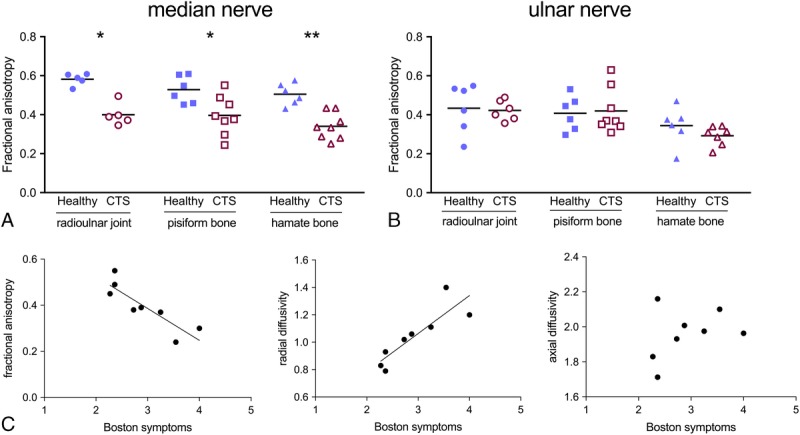
Results: The 7 T acquisitions with high in-plane resolution (0.2 × 0.2mm) afforded detailed morphologic resolution of peripheral nerve fascicles. For diffusion tensor imaging, single-shot echo-planar imaging was more efficient than readout-segmented echo-planar imaging in terms of signal-to-noise ratio per unit scan time. Distortion artifacts were pronounced, but could be corrected during postprocessing. Registration of FA maps to the morphologic images was successful. The developed imaging and analysis pipeline identified lower median nerve FA (pisiform bone, 0.37 [SD 0.10]) and higher radial diffusivity (1.08 [0.20]) in patients with CTS compared with healthy controls (0.53 [0.06] and 0.78 [0.11], respectively, P < 0.047). Fractional anisotropy and radial diffusivity strongly correlated with patients' symptoms (r = -0.866 and 0.866, respectively, P = 0.005).

Conclusions: Our data demonstrate the feasibility of morphologic and diffusion peripheral nerve imaging at 7 T. Fractional anisotropy and radial diffusivity were found to be correlates of symptom severity.


Conflict of interest statement

Conflicts of interest and sources of funding: none declared.

Figures

FIGURE 1
FIGURE 1
T2-weighted 3-dimensional balanced steady-state free precession (SSFP) images of the wrist acquired at 7 T. A, Reduction of banding artifacts in the SSFP images. The panels show transaxial SSFP images through the wrist acquired with and without phase cycling with clearly visible banding artifacts. The combined sum of square image largely eliminates banding artifacts, despite the severity in the two original images. B, Combined SSFP images. Panels show the median nerve (arrow) at the level of the radioulnar joint (left), pisiform bone (middle), and hook of hamate (right). The high spatial resolution of the 7 T images allows high visibility of morphologic details such as the differentiation of fascicles within the median nerve (zoomed insets). The 7 T morphologic sequences also allow visualization of the ulnar nerve (filled arrowhead) and the superficial radial nerve (empty arrowhead) at the wrist. The peripheral nerves are isointense with muscle (asterisk).
FIGURE 2
FIGURE 2
A and B, Diffusion imaging at 7 T induces significant distortion, which can be corrected by combining acquisitions with reversed EPI phase-encoding blips. A, Image shows frontal plane slices of morphologic, unweighted right-left phase encode blip, unweighted left-right phase encode blip, and the combination of unweighted opposing blips (TOPUP) for the ss-EPI acquisition. The red lines show the edges of the morphologic scan overlaid onto the diffusion images. There is extensive distortion, which can be substantially mitigated with TOPUP correction. B, Image shows the rs-EPI acquisition, which reduces distortions and achieves a more anatomically faithful image after TOPUP correction, in comparison with ss-EPI images. C and D, Slice-wise correlation between reversed phase-encode blips b = 0 acquisitions (RL, right-left; LR, left-right). C, Before TOPUP (red), correlations between reversed phase encode acquisitions are low, indicating substantial distortions at 7 T. TOPUP (blue) successfully corrects the distortions and increases the correlations. D, Correlations between uncorrected blip reversed acquisitions (red) within the same scan session were higher for rs-EPI compared with ss-EPI sequences, but could largely be corrected with TOPUP (blue).
FIGURE 3
FIGURE 3
A and B, Registration of the unweighted (b = 0) images and fractional anisotropy (FA) maps to the morphologic images was successful at 7 T in the transaxial plane (A), which is commonly used for diagnostic purposes, as well as sagittal planes (B). The median nerve is delineated in red on the morphologic images at the level of the pisiform bone (asterisk). Registration reveals good alignment with the hyperintense median nerve structure on the unweighted b = 0 images. The median nerve is also clearly indicated by a region of elevated signal in the FA maps, with accurate registration to the morphologic image. Insets show magnifications of the outlined nerve. Because of the left-right phase encode direction, distortion artifacts are more apparent in the transaxial images (A) compared with the sagittal images (B). However, registration remains accurate. C and D, Fractional anisotropy (FA) maps of the ulnar nerve at the wrist are successfully depicted. Transaxial (C) and sagittal (D) sections of the wrist demonstrating successful registration of the ulnar nerve (red outline) on the T2-weighted image (left) with the FA map (right).
FIGURE 4
FIGURE 4
A and B, The median nerve is clearly delineated in fractional anisotropy (FA) maps at 7 T. A, Image shows sagittal slices of morphologic, unweighted b = 0, and FA maps at 7 T acquired with rs-EPI sequences and (B) ss-EPI sequences. The extraneural variability in the FA values is higher with the rs-EPI compared with ss-EPI sequences. The arrows depict the level of the radioulnar joint, pisiform bone, and hook of hamate, where FA within regions of interest of the median nerve were compared.
FIGURE 5
FIGURE 5
Although the distortions at 7 T could be effectively corrected in most participants, the bone-bone interfaces at the level of the carpal bones induced significant distortions in some participants. These severe distortions could not be corrected by TOPUP, leading to focal signal loss in TOPUP-processed ss-EPI images and subsequent FA map reconstruction (arrows, sagittal slices).
FIGURE 6
FIGURE 6
A, Median nerve fractional anisotropy (FA) at 7 T is lower in patients with CTS (open red symbols) than healthy participants (blue filled symbols). FA of the median nerve is shown at the level of the radioulnar joint (P = 0.016), the pisiform (P = 0.047), and the hamate bone (P = 0.001). B, FA of the ulnar nerve is comparable at the different wrist levels between patients with CTS (red open symbols) and healthy controls (blue filled symbols, all P > 0.248). C, Fractional anisotropy (FA) negatively correlates with symptom severity as measured with the Boston symptom questionnaire (P = 0.005). Radial diffusivity positively correlates with symptom severity in patients with CTS (P = 0.005). No correlations of axial diffusivity with patients’ symptoms was apparent (P = 0.413).

References

    1. Filler AG, Howe FA, Hayes CE, et al. Magnetic resonance neurography. Lancet. 1993;341:659–661. - PubMed
    1. Kollmer J, Bendszus M, Pham M. MR neurography: diagnostic imaging in the PNS. Clin Neuroradiol. 2015;25(suppl 2):283–289. - PubMed
    1. Chhabra A, Madhuranthakam AJ, Andreisek G. Magnetic resonance neurography: current perspectives and literature review. Eur Radiol. 2018;28:698–707. - PubMed
    1. Raval SB, Britton CA, Zhao T, et al. Ultra-high field upper extremity peripheral nerve and non-contrast enhanced vascular imaging. PLoS One. 2017;12:e0175629. - PMC - PubMed
    1. Gambarota G, Veltien A, Klomp D, et al. Magnetic resonance imaging and T2 relaxometry of human median nerve at 7 Tesla. Muscle Nerve. 2007;36:368–373. - PubMed

Publication types