. 2018 Jul 6;14(7):e1006304.
doi: 10.1371/journal.pcbi.1006304. eCollection 2018 Jul.

Age-dependent Pavlovian biases influence motor decision-making

Affiliations

Age-dependent Pavlovian biases influence motor decision-making

Xiuli Chen et al. PLoS Comput Biol. .

Abstract

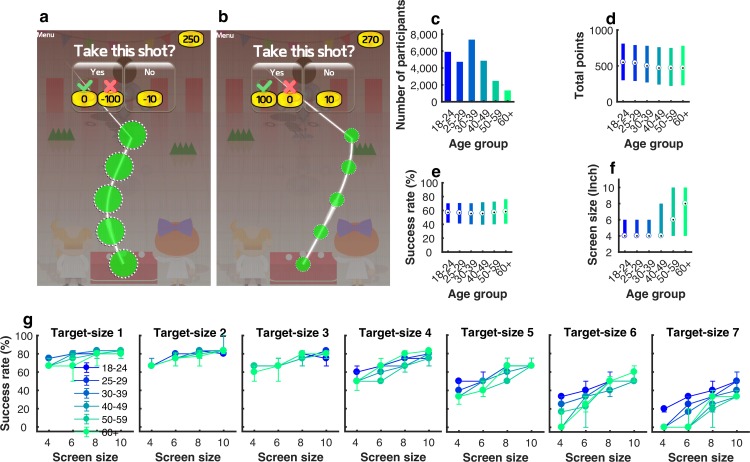
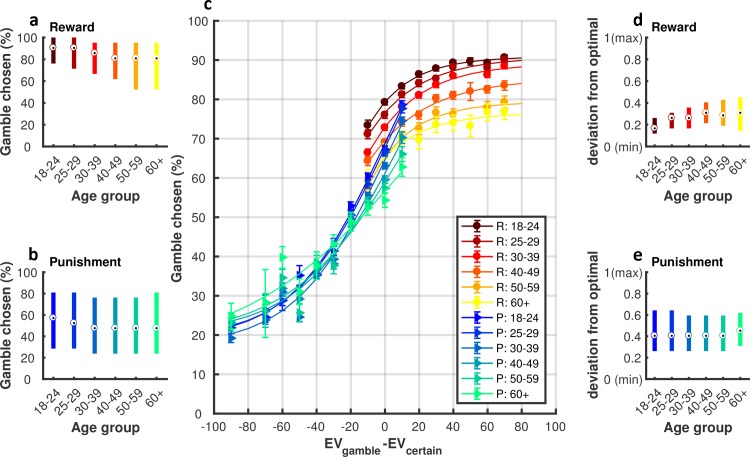
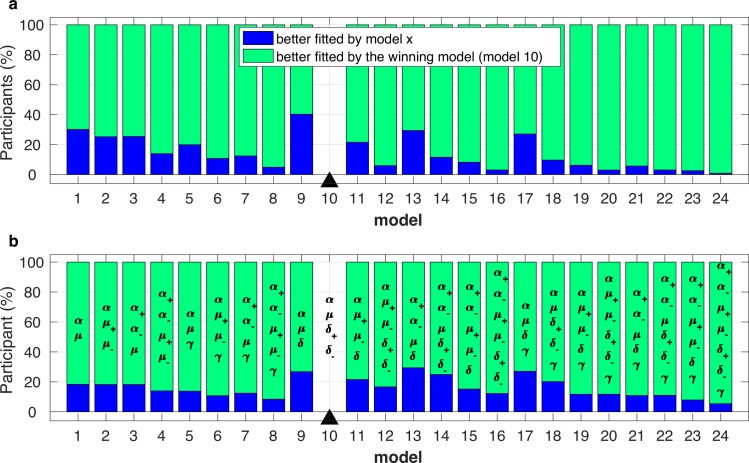
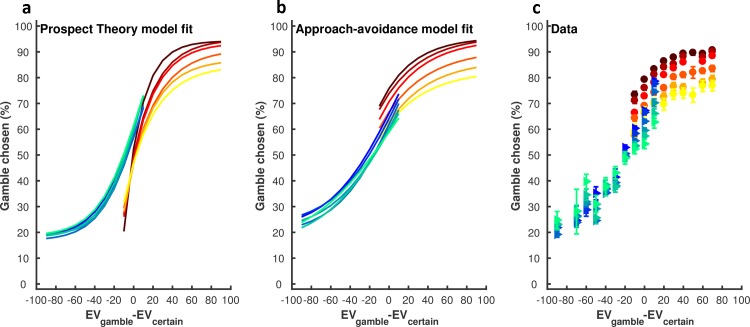
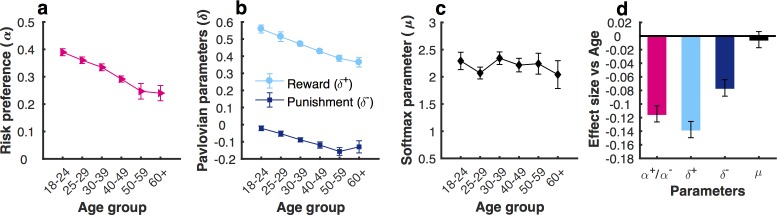
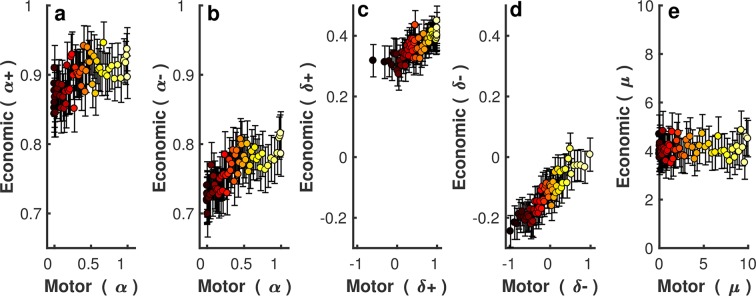
Motor decision-making is an essential component of everyday life which requires weighing potential rewards and punishments against the probability of successfully executing an action. To achieve this, humans rely on two key mechanisms; a flexible, instrumental, value-dependent process and a hardwired, Pavlovian, value-independent process. In economic decision-making, age-related decline in risk taking is explained by reduced Pavlovian biases that promote action toward reward. Although healthy ageing has also been associated with decreased risk-taking in motor decision-making, it is currently unknown whether this is a result of changes in Pavlovian biases, instrumental processes or a combination of both. Using a newly established approach-avoidance computational model together with a novel app-based motor decision-making task, we measured sensitivity to reward and punishment when participants (n = 26,532) made a 'go/no-go' motor gamble based on their perceived ability to execute a complex action. We show that motor decision-making can be better explained by a model with both instrumental and Pavlovian parameters, and reveal age-related changes across punishment- and reward-based instrumental and Pavlovian processes. However, the most striking effect of ageing was a decrease in Pavlovian attraction towards rewards, which was associated with a reduction in optimality of choice behaviour. In a subset of participants who also played an independent economic decision-making task (n = 17,220), we found similar decision-making tendencies for motor and economic domains across a majority of age groups. Pavlovian biases, therefore, play an important role in not only explaining motor decision-making behaviour but also the changes which occur through normal ageing. This provides a deeper understanding of the mechanisms which shape motor decision-making across the lifespan.


Conflict of interest statement

The authors declare no competing interests.

Figures

Fig 1
Fig 1. Motor gamble task and overall performance.
(a) Game interface: an example of a punishment trial for target-size 1 (1: largest target size; 7: smallest target size); Participants decided whether to skip the tapping task and stick with a small punishment (-10 points) or gamble on successfully executing the action. If successful, they avoided the punishment (lose 0 points); otherwise, they received a greater punishment (-100 points); (b) A reward trial for target-size 7; (c) The number of participants in each age group; (d) Boxplots for the final points achieved; (e) The overall success rate for executing the tapping action; (f) The screen size (inches) of the devices used. The screen sizes were binned into [4 6 8 10 inches]. The central mark in the boxplots indicates the median, and the bottom and top edges of the thick lines indicate the 25th and 75th percentiles, respectively; (g) Success rate (%) for executing the tapping action given the age, the screen size, and target-size (1: largest target size; 7: smallest target size). Dots and error bars represent medians and bootstrapped 95%CIs.
Fig 2
Fig 2. Participant’s ability to estimate motor performance success.
(a) The average estimation error for each age group. Each participant’s estimation performance was evaluated as the average error across 42 trials (dots); the error on each trial was calculated as; estimate % - 100% if successful, 0% if failed. Red crosses and error bars represent the medians and 95%CIs across the participants within each age group; (b-g) For each age group (n = 120; 20 in each group), we calculated an average success rate for each available verbal estimate value (0% to 100% with 10% increment). Each black dot represents the median success rate (y-axis) across participants who gave that certain verbal estimate value (x-axis), and error bars represent bootstrapped 95% CI across participants.
Fig 3
Fig 3. The proportion (%) of trials in which participants chose to gamble.
(a) Gamble rate in the reward and (b) punishment domain. The central mark in the boxplots indicates the median, and the bottom and top edges of the thick lines indicate the 25th and 75th percentiles, respectively; (c) Propensity to choose the gamble option as a function of EVgamble−EVcertain (data was grouped into bin sizes of 10). As indicated in the legend, each of the warm colours represents one age group in the reward (R) condition, and each of the cool colours represents one age group in the punishment (P) condition. The lines are fitted lines to y = a*exp(-b*x)+c; R2 = 0.979 ± 0.022; Error bars represent bootstrap 95% CIs; (d) Discrepancy between choice behaviour and optimal decisions in the reward domain. Specifically, we calculated whether the optimal decision on each trial was to gamble (1 if EVgamble-EVcertain>0) or skip (0, if EVgamble-EVcertain<0). We then subtracted this value from the observed behaviour of the participant (gamble = 1, skip = 0). If the average absolute difference between these values across trials was 0, then a participant was deemed as an optimal decision-maker; (e) Discrepancy between choice behaviour and optimal decisions in the punishment domain.
Fig 4
Fig 4. Subject-level AIC and BIC model comparison.
(a) For each participant, the winning approach avoidance model’s (model 10 [α, μ, δ+, δ−] as indicated by the black triangle; this model had the smallest summed BIC; S1 Table) BIC value was compared with the BIC value for each of the other models (x-axis). The percentage (%) of participants for which the winning model (smaller BIC value is preferred) better fitted their choice behaviour is shown in green (upper part of the bar). The percentage of participants for which the alternative model better fitted their choice behaviour is shown in blue (lower part of the bar). (b) Identical analysis for AIC. Parameter set for each model is also provided.
Fig 5
Fig 5. Average model fits across participants.
(a) Average model fit for the winning prospect theory model (ID = 4 in S1 Table [α++]). The probability of choosing the gamble option (y-axis) predicted by the model (see Methods; Eq 2) is plotted against the difference in expected value between the two options (x-axis; EVgamble−EVcertain; grouped into bin sizes of 10). As indicated in the legend, each of the warm colours represents one age group in the reward (R) condition, and each of the cool colours represents one age group in the punishment (P) condition. The model cannot account for the observed differences across the life span, including (1) the gradual and monotonic decrease in gamble rate across the lifespan in the reward domain; (2) the changes in gamble propensity observed in the punishment domain across age groups (as the model fit shows almost no difference across the age groups in the punishment domain); (3) the higher gamble rate in the reward domain relative to the punishment domain when [EVgamble-EVcertain] is close to 0 (as the model fit shows the opposite) (model falsification [33]); (b) Average model fit across participants for the winning approach-avoidance model (ID = 10 in S1 Table, [α,μ, δ+]); (c) Data: propensity to choose the gamble option as a function of EVgamble−EVcertain.
Fig 6
Fig 6. The change in approach-avoidance model parameters across the life span.
(a) α across age groups; (b) δ+ and δ across age groups; (c) μ across age groups; (d) Age-related decline for the parameters. The largest effect size was observed for the Pavlovian approach parameter (δ+). This age-related effect was not observed for the temperature parameter, μ. Error bars represent 95%CI.
Fig 7
Fig 7. The relationship between approach-avoidance model parameters across the motor (x-axis) and economic (y-axis) gambling tasks.
(a-e) Each panel represents a single parameter; (a)The risk preference parameter in reward; and (b) punishment trials; (c) Pavlovian approach-avoidance parameter in reward; and (d) punishment trials; (e) the temperature parameter. The participants were binned into 60 groups (287 participants in each group) based on their motor parameter value. Within each panel, each dot represents the medians of motor parameters (x-axis) and economic parameter (y-axis) for each group. Error bars represent 95%CI in the economic decision-making task.

Similar articles

Cited by

References

    1. Guitart-Masip M, Duzel E, Dolan R, Dayan P. Action versus valence in decision making. Trends Cogn Sci. 2014;18(4):194–202. 10.1016/j.tics.2014.01.003 ; PubMed Central PMCID: PMCPMC3989998. - DOI - PMC - PubMed
    1. Guitart-Masip M, Huys QJ, Fuentemilla L, Dayan P, Duzel E, Dolan RJ. Go and no-go learning in reward and punishment: interactions between affect and effect. Neuroimage. 2012;62(1):154–66. Epub 2012/05/03. 10.1016/j.neuroimage.2012.04.024 ; PubMed Central PMCID: PMC3387384. - DOI - PMC - PubMed
    1. Dayan P, Niv Y, Seymour B, Daw ND. The misbehavior of value and the discipline of the will. Neural Netw. 2006;19(8):1153–60. Epub 2006/08/30. 10.1016/j.neunet.2006.03.002 . - DOI - PubMed
    1. Tversky A, Kahneman D. Judgment under Uncertainty: Heuristics and Biases. Science. 1974;185(4157):1124–31. 10.1126/science.185.4157.1124 . - DOI - PubMed
    1. Kahneman D, Tversky A. Prospect theory: an analysis of decision under risk. Econoemtrica. 1979;47:263–91.

Publication types