. 2018 Aug 6;215(8):1987-1998.
doi: 10.1084/jem.20172094. Epub 2018 Jul 6.

Foxp3+ T reg cells control psoriasiform inflammation by restraining an IFN-I-driven CD8+ T cell response

Affiliations

Foxp3+ T reg cells control psoriasiform inflammation by restraining an IFN-I-driven CD8+ T cell response

Krista Stockenhuber et al. J Exp Med. .

Abstract

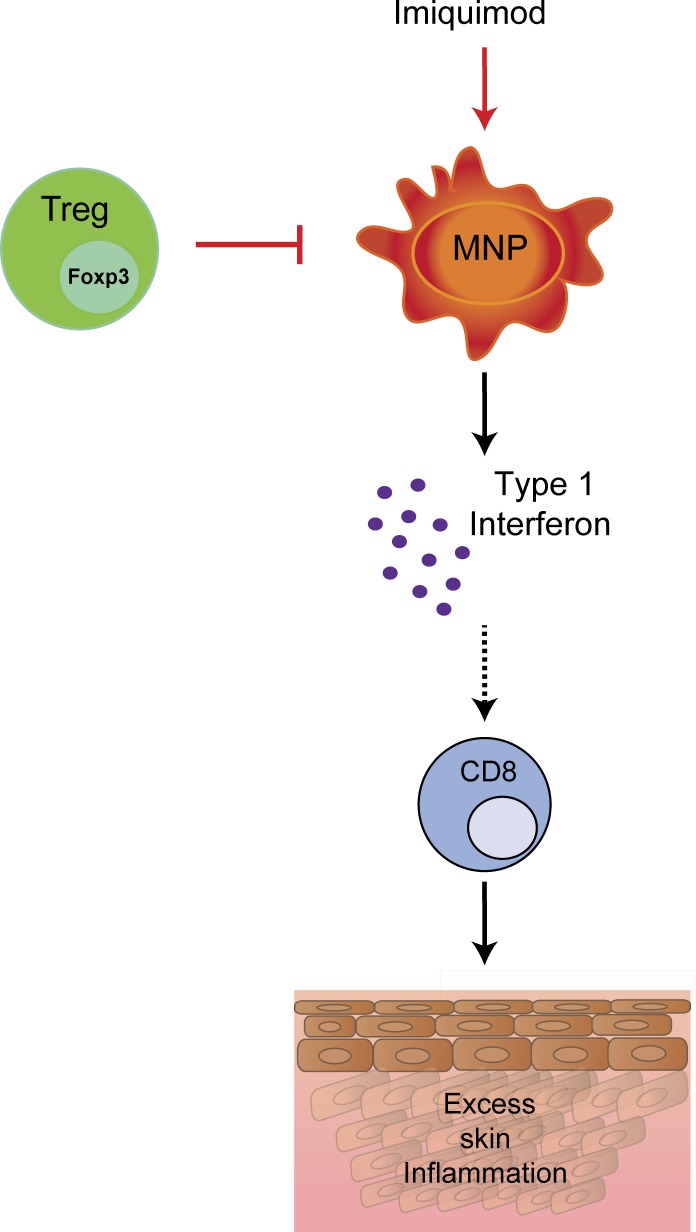
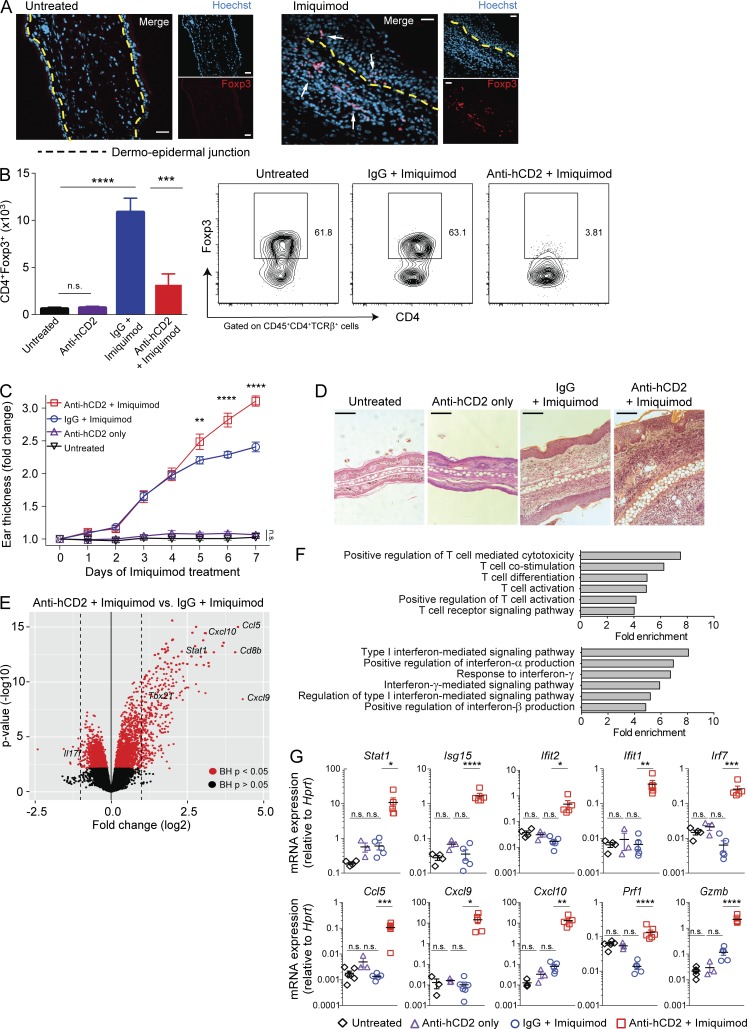
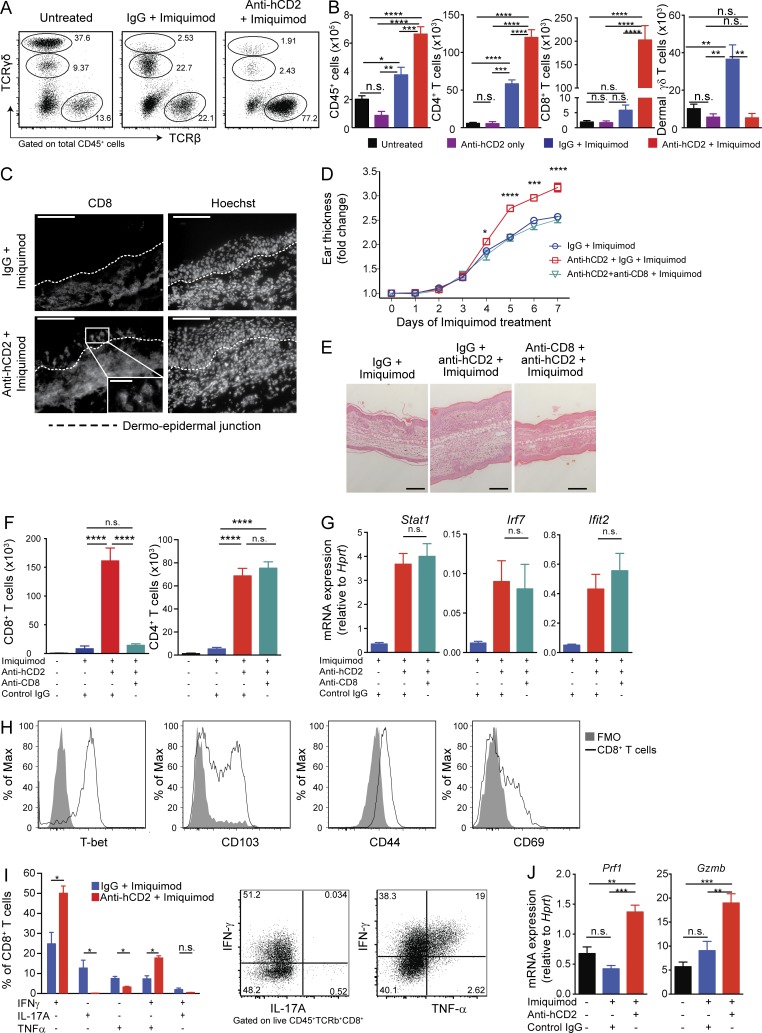
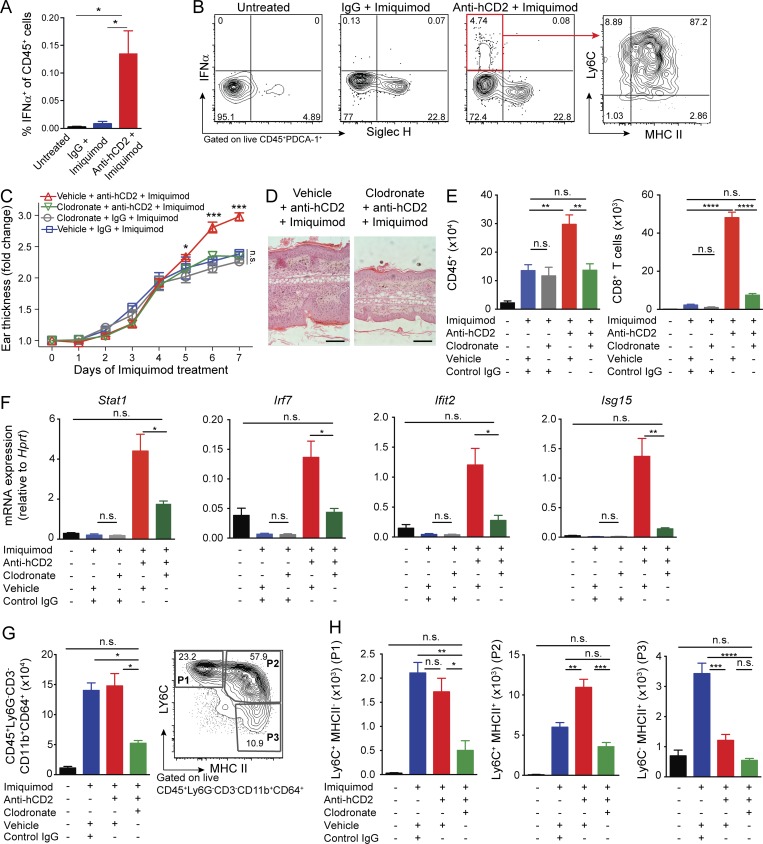
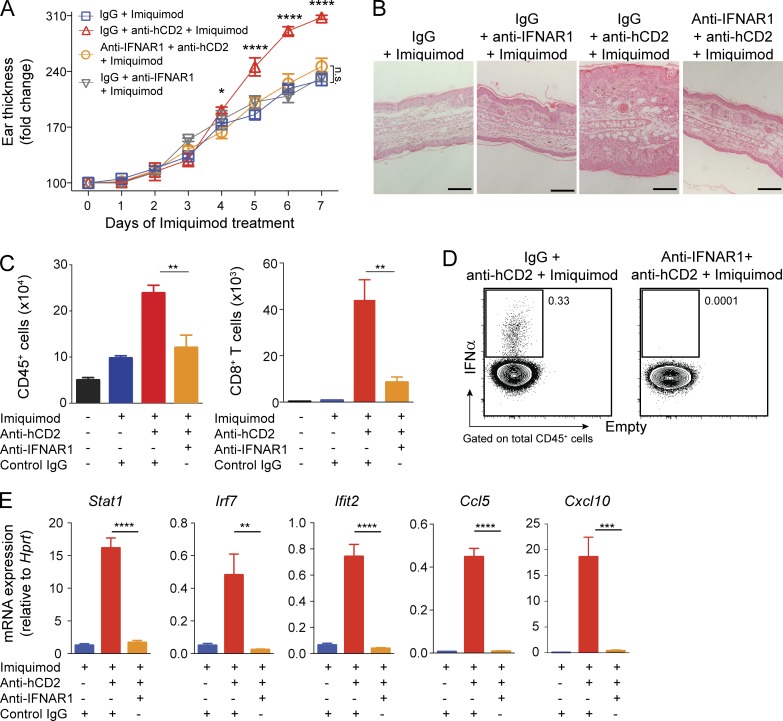
Psoriasis is a complex inflammatory skin disease affecting ∼3% of the population worldwide. Although type I interferons (IFN-I) are thought to be involved in its pathogenesis, the details of this relationship remain elusive. Here we show that in a murine model of imiquimod-driven psoriatic skin inflammation, Foxp3+ regulatory T cells (T reg cells) control inflammation severity by restraining IFN-I. Depletion of T reg cells induces IFN-I and IFN-stimulated gene expression, and leads to accumulation of CD8+ T cells in lesional skin. Mononuclear phagocytes (MNPs) were the source of IFN-I, and their depletion reversed the effect of T reg cell depletion. Blockade of IFN-I signaling abolished CD8+ T cell infiltration and excess inflammation in the skin of T reg cell-depleted mice. Depletion of CD8+ T cells attenuated pathology, confirming their role as critical effector cells downstream of IFN-I. Our results describe an unexpected role for T reg cells in restraint of an MNP-IFN-I-driven CD8+ T cell response during psoriasiform skin inflammation. These findings highlight a pathway with potential relevance for the treatment of early-stage disease.


Figures

None
Graphical abstract
Figure 1.
Figure 1.
Foxp3+ T reg cells accumulate in psoriasiform inflammation and control the inflammatory response in the skin. (A) Representative immunofluorescence staining of Foxp3+ cells (examples indicated by arrows) in untreated and IMQ-treated ear skin of B6 wild type mice. Dashed lines indicate the dermo-epidermal junction. Scale bars, 20 µm. (B) Flow cytometry analysis of Foxp3+ T reg cells in ear skin from Foxp3hCD2 mice treated as indicated. Left, T reg cell number; right, representative flow cytometry plots. (C) Thickness of ear skin over the course of treatment with IMQ. (D) Representative H&E staining of ear tissue cross sections. Scale bars, 200 µm. Data in panels A–D are representative of one of two or more experiments with n ≥ 4 mice per group. (E) Change in gene expression in anti-hCD2 + IMQ– versus IgG + IMQ–treated skin (n = 3 per group, one experiment). (F) Differentially regulated GO pathways in anti-hCD2 + IMQ–treated skin, including T cell– (top) and interferon-related pathways (bottom); all indicated pathways were significant with false discovery rates <0.05 based on hypergeometric test (n = 3 per group, one experiment). (G) qPCR analysis confirming mRNA levels of interferon-stimulated genes in untreated, anti-hCD2 only–, IgG + IMQ–, or anti-hCD2 + IMQ–treated skin (representative of one of two or more experiments with n ≥ 3 mice per group). Error bars: means ± SEM. Statistics: one-way (B) and two-way ANOVA (C) with post-hoc test; empirical Bayes method with Benjamini-Hochberg (BH) adjusted P values (E); Mann-Whitney U test (G). *P = 0.01–0.05, **P = 0.001–0.01, ***P = 0.0001–0.001, ****P < 0.0001, n.s., not significant.
Figure 2.
Figure 2.
CD8+ T cells are the driving effector population controlled by T reg cells in psoriasiform skin inflammation. (A and B) Flow cytometry analysis of T cell subsets in mouse ear skin. Frequency of TCRβ+, TCRγδint, and TCRγδhigh cells among total CD45+ cells (A) and absolute numbers of cells extracted from skin (B). (C) Representative immunofluorescence staining of CD8+ T cells in ear skin. Dashed lines indicate the dermo-epidermal junction. Scale bars, 100 µm; inset, 25 µm. (D) Thickness of ear skin over the course of IMQ treatment. (E) Representative H&E staining after 7 d of IMQ treatment. Scale bars, 200 µm. (F) Total CD8+ and CD4+ T cells extracted from skin, determined by flow cytometry. (G) qPCR analysis confirming mRNA levels of interferon response genes in IMQ-treated skin. (H) Flow cytometry analysis of CD8+ T cells isolated from anti-hCD2 + IMQ–treated ear skin. FMO, fluorescence minus one control. (I) Frequency of IFN-γ, IL-17A, and TNF-α expression by CD8+ T cells isolated from anti-hCD2 + IMQ– and IgG + IMQ–treated ear skin assessed by flow cytometry after stimulation (PMA/ionomycin for 4 h + BFA) and representative FACS plots for anti-hCD2 + IMQ–treated group. (J) qPCR analysis of FACS-sorted skin CD8+ T cells. Error bars: means ± SEM. Statistics: one-way (B, F, G, and J) and two-way ANOVA (D) with post-hoc test, Mann-Whitney U test (I). Data are representative of one of three (A–F and H) and one of two (F and I) experiments with n ≥ 2 (C and J) or n ≥ 3 mice per group (A, B, and D–I). *P = 0.01–0.05, **P = 0.001–0.01, ***P = 0.0001–0.001, ****P < 0.0001, n.s., not significant.
Figure 3.
Figure 3.
T reg cells suppress IFN-I production by restraining MNPs. (A and B) Flow cytometry analysis of CD45+ cells from cervical lymph nodes (stimulated with PMA/ionomycin for 4 h + BFA) of Foxp3hCD2 mice treated as indicated. (A) Percentage of IFN-α+ cells among CD45+ cells in cervical lymph nodes. (B) Surface marker expression of IFN-α+ cells pregated on CD45+PDCA1+ cells. (C–F) Depletion of MNPs using clodronate liposomes in mice treated with IMQ ± anti-hCD2. (C and D) Thickness of ear skin over the course of IMQ treatment (C) and representative H&E staining (D). Scale bars, 200 µm. (E) Quantification of skin CD45+ cells and CD8+ T cells by flow cytometry. (F) qPCR analysis of interferon response gene mRNA in skin tissue. (G) Total CD45+Ly6GCD3CD11b+CD64+ cells isolated from skin tissue assessed by flow cytometry (left) and MNP “waterfall" gating strategy P1–P3 (right). (H) Total cell numbers of P1–P3 assessed by flow cytometry. Error bars: means ± SEM. Statistics: one-way (A and E–H) and two-way ANOVA (C) with post-hoc test. Data are representative of one of three experiments with n ≥ 4 (C, D, G, and H) or one of two experiments with n ≥ 3 mice per group (A, B, E, and F). *P = 0.01–0.05, **P = 0.001–0.01, ***P = 0.0001–0.001, ****P < 0.0001, n.s., not significant.
Figure 4.
Figure 4.
T reg cells control skin inflammation by inhibiting IFN-I production. (A–E) IFNAR1 blockade in mice treated with IMQ ± anti-hCD2. (A) Thickness of ear skin over the course of treatment. (B) Representative H&E-stained skin of treatment groups as indicated. Scale bars, 200 µm. (C) Quantification of total skin CD45+ cells and CD8+ T cells by flow cytometry. (D) Representative flow cytometry plot of total IFN-α+ cells in cervical lymph nodes at day 7 of IMQ treatment. (E) qPCR analysis of interferon response gene mRNA in skin tissue. Error bars: means ± SEM. Statistics: one-way (C and E) and two-way ANOVA (A) with post-hoc test. Data are representative of one of three experiments with n ≥ 4 (B and C) or one of two experiments with n ≥ 4 (A and E) or n ≥ 3 mice per group (D). *P = 0.01–0.05, **P = 0.001–0.01, ***P = 0.0001–0.001, ****P < 0.0001, n.s., not significant.

References

    1. Afshar M., Martinez A.D., Gallo R.L., and Hata T.R.. 2013. Induction and exacerbation of psoriasis with Interferon-alpha therapy for hepatitis C: a review and analysis of 36 cases. J. Eur. Acad. Dermatol. Venereol. 27:771–778. 10.1111/j.1468-3083.2012.04582.x - DOI - PMC - PubMed
    1. Ali N., and Rosenblum M.D.. 2017. Regulatory T cells in skin. Immunology. 152:372–381. 10.1111/imm.12791 - DOI - PMC - PubMed
    1. Ariotti S., Hogenbirk M.A., Dijkgraaf F.E., Visser L.L., Hoekstra M.E., Song J.-Y., Jacobs H., Haanen J.B., and Schumacher T.N.. 2014. T cell memory. Skin-resident memory CD8+ T cells trigger a state of tissue-wide pathogen alert. Science. 346:101–105. 10.1126/science.1254803 - DOI - PubMed
    1. Belkaid Y., and Tamoutounour S.. 2016. The influence of skin microorganisms on cutaneous immunity. Nat. Rev. Immunol. 16:353–366. 10.1038/nri.2016.48 - DOI - PubMed
    1. Bevan M.J. 2004. Helping the CD8(+) T-cell response. Nat. Rev. Immunol. 4:595–602. 10.1038/nri1413 - DOI - PubMed

Publication types

MeSH terms