. 2018 Aug 3;131(15):jcs217257.
doi: 10.1242/jcs.217257.

Regulation of PI4P levels by PI4KIIIα during G-protein-coupled PLC signaling in Drosophila photoreceptors

Affiliations

Regulation of PI4P levels by PI4KIIIα during G-protein-coupled PLC signaling in Drosophila photoreceptors

Sruthi S Balakrishnan et al. J Cell Sci. .

Abstract

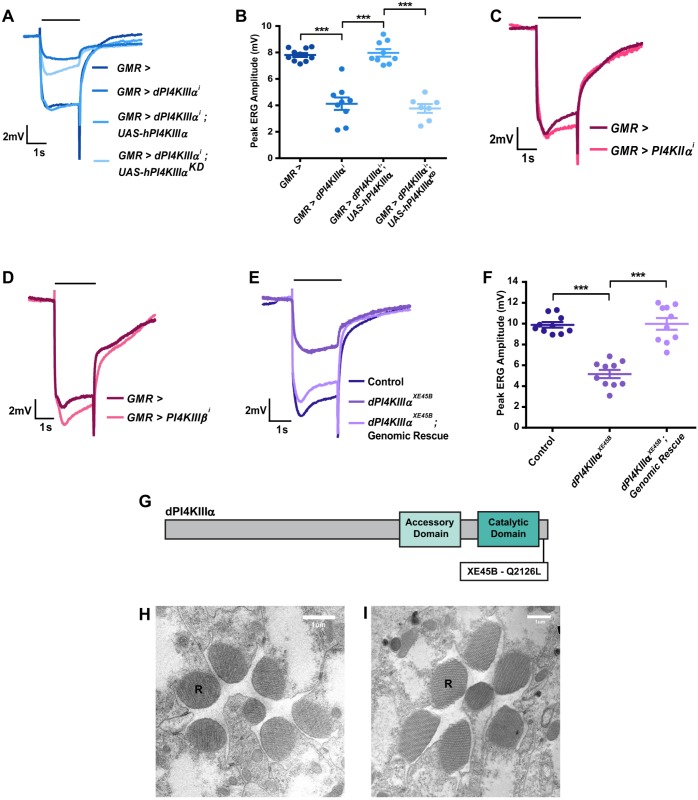
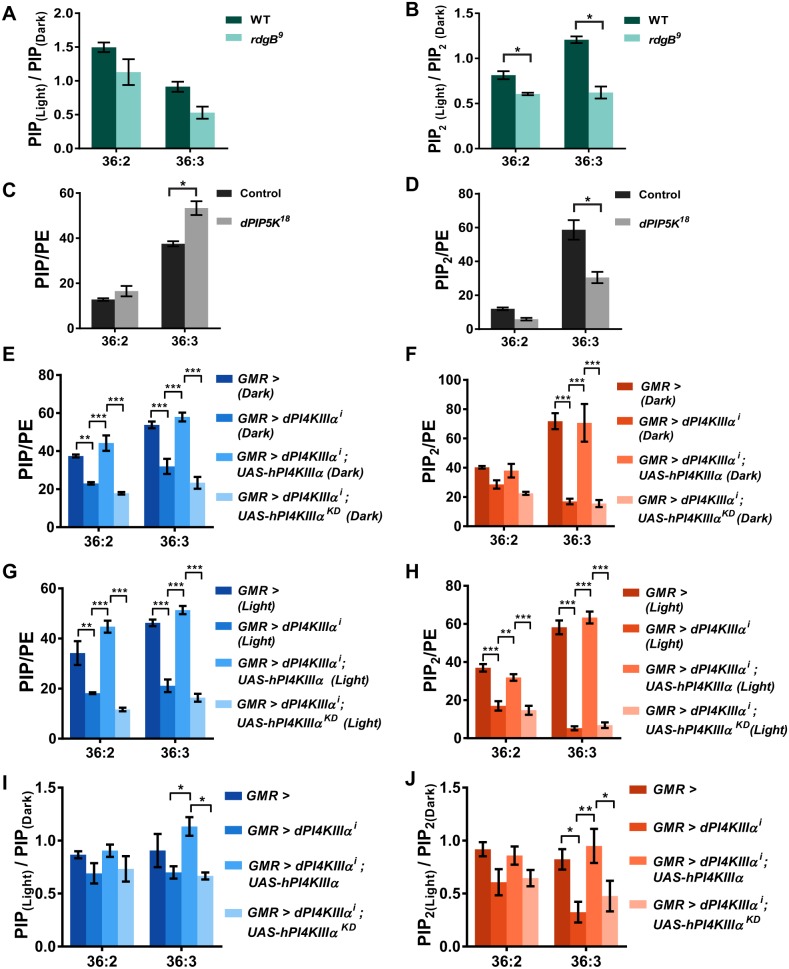
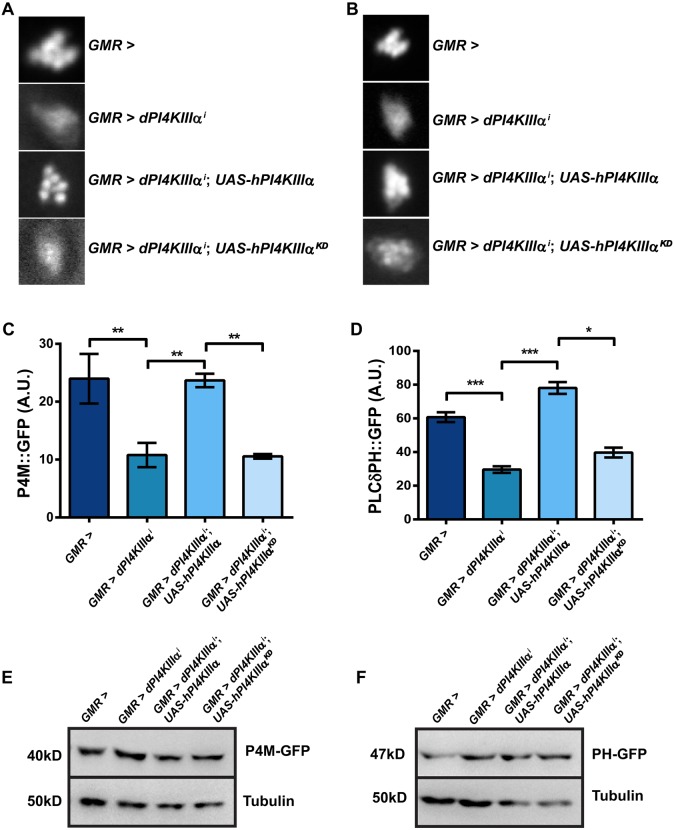
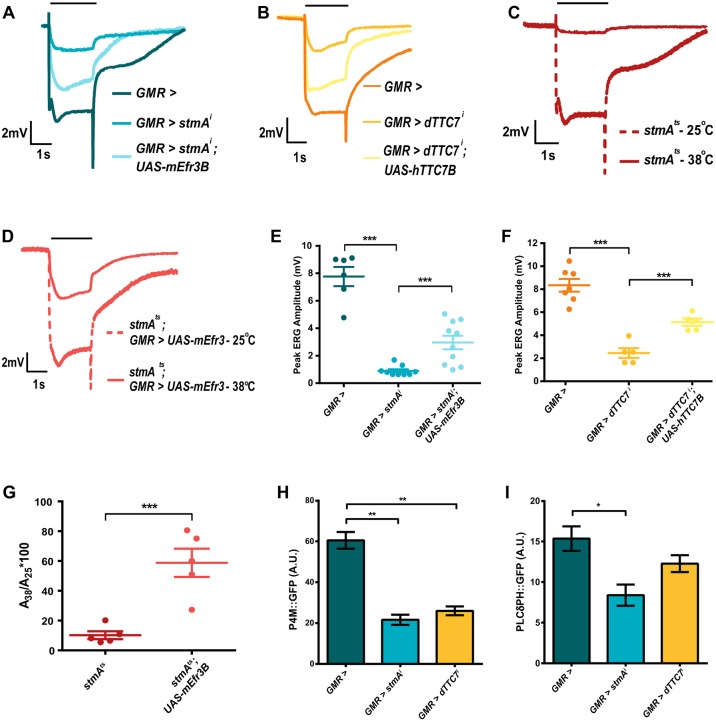
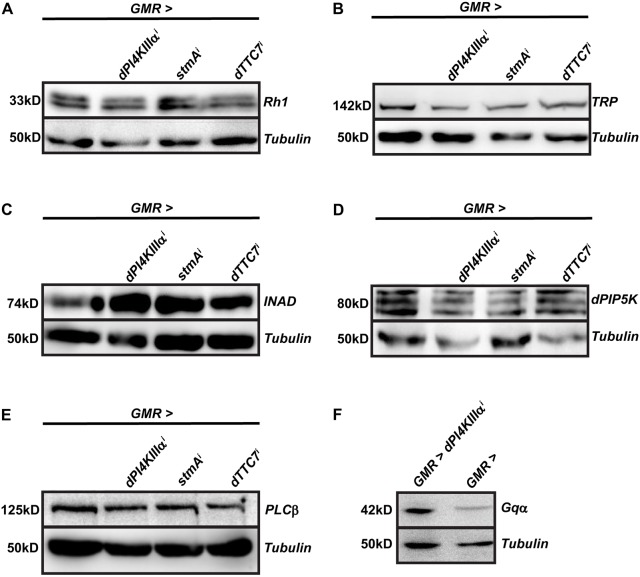
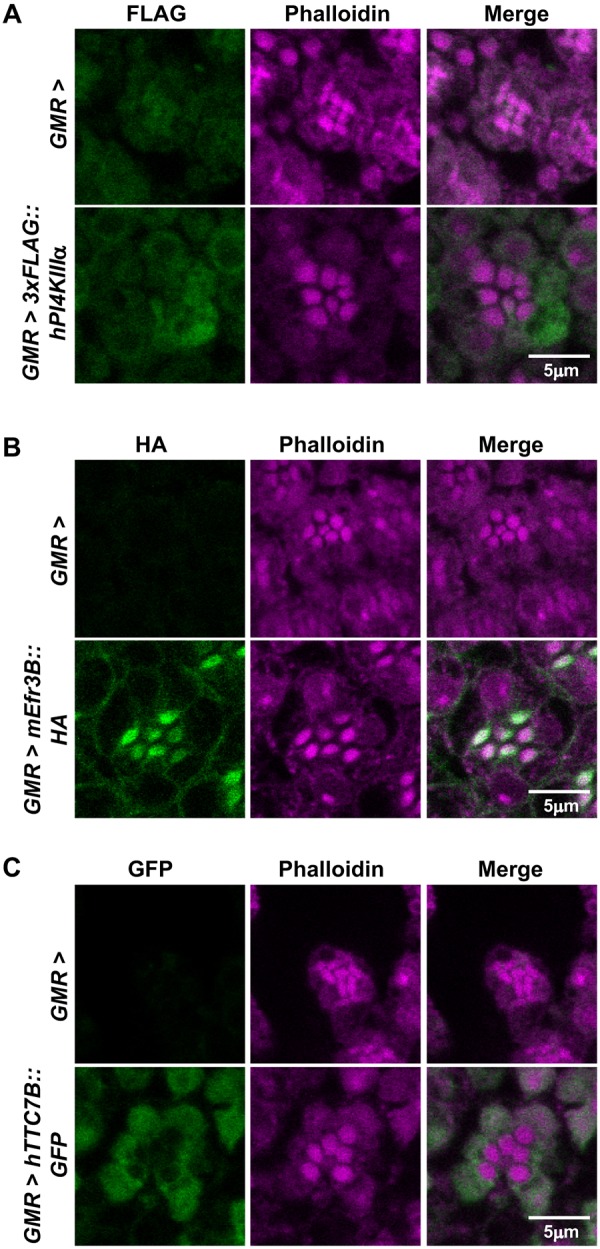
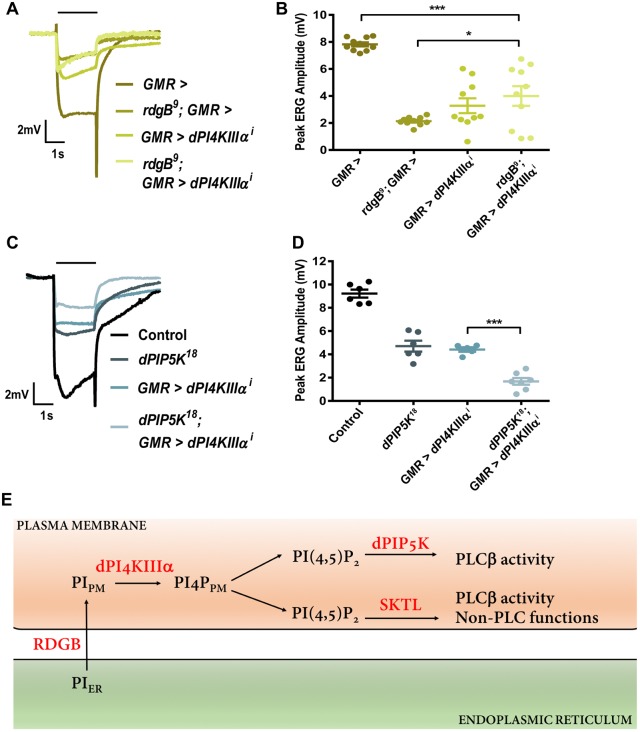
The activation of phospholipase C (PLC) is a conserved mechanism of receptor-activated cell signaling at the plasma membrane. PLC hydrolyzes the minor membrane lipid phosphatidylinositol 4,5-bisphosphate [PI(4,5)P2], and continued signaling requires the resynthesis and availability of PI(4,5)P2 at the plasma membrane. PI(4,5)P2 is synthesized by the phosphorylation of phosphatidylinositol 4-phosphate (PI4P). Thus, a continuous supply of PI4P is essential to support ongoing PLC signaling. While the enzyme PI4KA has been identified as performing this function in cultured mammalian cells, its function in the context of an in vivo physiological model has not been established. In this study, we show that, in Drosophila photoreceptors, PI4KIIIα activity is required to support signaling during G-protein-coupled PLC activation. Depletion of PI4KIIIα results in impaired electrical responses to light, and reduced plasma membrane levels of PI4P and PI(4,5)P2 Depletion of the conserved proteins Efr3 and TTC7 [also known as StmA and L(2)k14710, respectively, in flies], which assemble PI4KIIIα at the plasma membrane, also results in an impaired light response and reduced plasma membrane PI4P and PI(4,5)P2 levels. Thus, PI4KIIIα activity at the plasma membrane generates PI4P and supports PI(4,5)P2 levels during receptor activated PLC signaling.

Keywords: Drosophila; PI4KIIIα; PI4P; PLC.


Conflict of interest statement

Competing interestsThe authors declare no competing or financial interests.

Figures

Fig. 1.
Fig. 1.
PI4KIIIα is required for normal PLC signaling in photoreceptors. (A) Representative ERG trace of 1-day-old flies of the indicated genotype. The x-axis presents time (s); the y-axis is amplitude in mV. The black bar above traces indicates the duration of the light stimulus. The experiment was repeated three times, and one of the trials is shown here. (B) Quantification of the ERG response, where peak ERG amplitude was measured from 1-day-old flies. The x-axis indicates genotype; the y-axis indicates peak amplitude in mV. The mean±s.e.m. is indicated, n=10 flies per genotype. ***P<0.001 (ANOVA followed by Tukey's multiple comparison test). (C–E) Representative ERG trace of 1-day-old flies with genotypes as indicated. The x-axis presents time (s); the y-axis is amplitude in mV. The black bar above traces indicates the duration of the light stimulus. The experiment has been repeated three times, and one of the trials is shown here. (F) Quantification of the ERG response, where peak ERG amplitude was measured from 1-day-old flies. The x-axis indicates genotype; the y-axis indicates peak amplitude in mV. The mean±s.e.m. is indicated, n=10 flies per genotype. ***P<0.001 (ANOVA followed by Tukey's multiple comparison test). (G) Schematic representation of the dPI4KIIIαXE45B point mutation. The location of the Q2126L mutation is indicated. (H,I) Transmission electron micrographs (TEM) showing sections of photoreceptors from 1-day-old control and dPI4KIIIαXE45B mutant flies, respectively. R, rhabdomere.
Fig. 2.
Fig. 2.
PI4KIIIα supports PIP and PIP2 levels during phototransduction. (A,B) Liquid chromatography-mass spectrometry (LC-MS) measurement of total PIP and PIP2 levels, respectively, from retinae of 1-day-old rdgB9 mutant flies. To highlight the effect of illumination on lipid levels, flies were reared in dark and subjected to two treatments – one processed completely in dark (dark) and the other exposed to 1 min of bright illumination before processing (light). The y-axis represents a ratio of lipid levels PIP(light):PIP(dark) and PIP2(light):PIP2(dark),under these two conditions from wild-type (WT) and rdgB9 retinae. Ratios for the two most abundant molecular species of PIP and PIP2 (36:2 and 36:3) are shown. A reduction in the ratio indicates a drop in the levels of PIP and PIP2 during illumination. Values are mean±s.e.m., n=25 retinae per sample *P<0.05 (ANOVA followed by Tukey's multiple comparison test). The experiment was repeated three times, and one of the trials is shown here. (C,D) LC-MS measurement of total PIP and PIP2 levels, respectively, from retinae of 1-day-old dPIP5K18 mutant flies. Flies were reared and processed completely in the dark. Levels for the two most abundant molecular species of PIP and PIP2 (36:2 and 36:3) are shown. The y-axis represents PIP and PIP2 levels normalized to those of phosphatidylethanolamine (PE). Values are mean±s.e.m., n=25 retinae per sample. *P<0.05 (ANOVA followed by Tukey's multiple comparison test). The experiment has been repeated two times, and one of the trials is shown here. (E,F) LC-MS measurement of total PIP and PIP2 levels, respectively, from retinae of 1-day-old flies with genotypes as indicated. Flies were reared and processed completely in the dark. Levels for the two most abundant molecular species of PIP and PIP2 (36:2 and 36:3) are shown. The y-axis represents PIP and PIP2 levels normalized to PE. Values are mean±s.e.m., n=25 retinae per sample. ***P<0.001 (ANOVA followed by Tukey's multiple comparison test). The experiment has been repeated two times, and one of the trials is shown here. (G,H) LC-MS measurement of total PIP and PIP2 levels, respectively, from retinae of 1-day-old flies with genotypes as indicated. Flies were reared in dark and exposed to one minute of bright illumination before processing. The y-axis represents PIP and PIP2 levels normalized to PE. Levels for the two most abundant molecular species of PIP and PIP2 (36:2 and 36:3) are shown. Values are mean±s.e.m., n=25 retinae per sample. ***P<0.001 (ANOVA followed by Tukey's multiple comparison test). The experiment has been repeated two times, and one of the trials is shown here. (I,J) LC-MS measurement of total PIP and PIP2 levels, respectively, from retinae of 1-day-old flies with genotypes as indicated. The y-axis represents a ratio of lipid levels PIP(light):PIP(dark) and PIP2(light):PIP2(dark). Ratios for the two most abundant molecular species of PIP and PIP2 (36:2 and 36:3) are shown. A reduction in the ratio indicates a drop in the levels of PIP and PIP2. Values are mean±s.e.m., n=25 retinae per sample. *P<0.05, **P<0.01 (ANOVA followed by Tukey's multiple comparison test).
Fig. 3.
Fig. 3.
PI4KIIIα is required for normal levels of PI4P and PI(4,5)P2 at the plasma membrane. (A) Representative images of the fluorescent deep pseudopupil from 1-day-old flies expressing the P4M::GFP probe with genotype as indicated. (B) Representative images of the fluorescent deep pseudopupil from flies expressing the PLCδPH::GFP probe with genotype as indicated. The experiments in A and B were repeated two times, and one of the trials is shown here. (C,D) Quantification of fluorescence intensity of the deep pseudopupil. Fluorescence intensity per unit area is shown on the y-axis (A.U., arbitrary units); the x-axis indicates the genotype. Values are mean±s.e.m. n=10 flies per genotype. *P<0.05 (two-tailed unpaired t-test). (E,F) Western blot of head extracts made from flies expressing the P4M::GFP and PLCδPH::GFP probes, respectively. The levels of tubulin are used as a loading control; genotypes are indicated above.
Fig. 4.
Fig. 4.
Depletion of EFR3 and TTC7 phenocopy the effect of PI4KIIIα depletion in photoreceptors. (A–D) Representative ERG trace of 1-day-old flies with genotype as indicated. The x-axis shows time (s); the y-axis is amplitude in mV. The black bar above traces indicates the duration of the light stimulus. The experiment has been repeated three times, and one of the trials is shown here. (E,F) Quantification of the ERG response, where peak ERG amplitude was measured from 1-day-old flies. The x-axis indicates the genotype; the y-axis indicates peak amplitude in mV. The mean±s.e.m. is indicated, n=10 flies (E) and 5 flies (F) per genotype. ***P<0.001 (two-tailed unpaired t-test). (G) Quantification of the ERG response, where ratio of peak amplitudes at restrictive (38°C) and permissive (25°C) temperatures were taken. The x-axis indicates the genotype; the y-axis indicates ratio of peak amplitudes. The mean±s.e.m. is indicated, n=5 flies per genotype. ***P<0.001 (two-tailed unpaired t-test). (H,I) Quantification of fluorescence intensity of the deep pseudopupil. The fluorescence intensity per unit area is shown on the y-axis; the x-axis indicates genotype. Values are mean±s.e.m., n=10 flies per genotype. *P<0.05; **P<0.01 (two-tailed unpaired t-test). The experiment has been repeated two times, and one of the trials is shown here.
Fig. 5.
Fig. 5.
Normal levels of key phototransduction proteins in PI4KIIIα-depleted flies. (A–F) Western blot of head extracts made from flies of the indicated genotypes. For D, protein extracts were made from retinal tissue. Tubulin is used as a loading control with genotypes indicated above. The experiment was repeated three times, and one of the trials is shown here.
Fig. 6.
Fig. 6.
Localization of mammalian PI4KIIIα, Efr3 and TTC7 in photoreceptors. (A) Confocal images of retinae stained with phalloidin and anti-FLAG antibody from GMR> and GMR>3xFLAG::hPI4KIIIα flies. Magenta represents phalloidin, which marks the rhabdomere, and green represents FLAG. The experiment has been repeated two times, and one of the trials is shown here. (B) Confocal images of retinae stained with phalloidin and anti-HA antibody from GMR> and GMR>mEfr3B::HA flies. Magenta represents phalloidin, which marks the rhabdomere, and green represents HA. The experiment has been repeated two times, and one of the trials is shown here. (C) Confocal images of retinae stained with phalloidin and anti-GFP antibody from GMR> and GMR>hTTC7B::GFP flies. Magenta represents phalloidin, which marks the rhabdomere, and green represents GFP. The experiment was repeated two times, and one of the trials is shown here. Scale bars: 5 µm.
Fig. 7.
Fig. 7.
Interaction of PI4KIIIα with other components of the PI(4,5)P2 resynthesis pathway. (A) Representative ERG trace of 1-day-old flies with genotype as indicated. The x-axis is time (s); the y-axis is amplitude in mV. The black bar above traces indicates the duration of the light stimulus. The experiment was repeated two times, and one of the trials is shown here. (B) Quantification of the ERG response, where peak ERG amplitude was measured from 1-day-old flies. The x-axis is time (s); the y-axis is amplitude in mV. The mean±s.e.m. is indicated, n=10 flies per genotype. *P<0.05; ***P<0.001 (ANOVA followed by Tukey's multiple comparison test). (C) Representative ERG trace of 1-day-old flies with genotype as indicated. The x-axis is time (s); the y-axis is amplitude in mV. The black bar above traces indicates the duration of the light stimulus. (D) Quantification of the ERG response, where peak ERG amplitude was measured from 1-day-old flies. The x-axis is time (s); the y-axis is amplitude in mV. The mean±s.e.m. is indicated, n=5 flies per genotype. ***P<0.001 (ANOVA followed by Tukey's multiple comparison test). (E) Model of the biochemical reactions involved in the resynthesis of PI(4,5)P2 in Drosophila photoreceptors. Protein and lipid components are depicted according to the compartment in which they are distributed; the plasma membrane and endoplasmic reticulum are shown. PIER indicates PI in the endoplasmic reticulum, and PIPM indicates PI at the plasma membrane. PI4PPM indicates the plasma membrane pool of PI4P generated by PI4KIIIα. The reactions catalyzed by PI4KIIIα, SKTL and PIP5K at the plasma membrane are indicated. PLCβ activity and non-PLC functions are indicated against the pools of PI(4,5)P2 that support these functions.

References

    1. Audhya A. and Emr S. D. (2002). Stt4 PI 4-kinase localizes to the plasma membrane and functions in the Pkc1-mediated MAP kinase cascade. Dev. Cell 2, 593-605. 10.1016/S1534-5807(02)00168-5 - DOI - PubMed
    1. Baird D., Stefan C., Audhya A., Weys S. and Emr S. D. (2008). Assembly of the PtdIns 4-kinase Stt4 complex at the plasma membrane requires Ypp1 and Efr3. J. Cell Biol. 183, 1061-1074. 10.1083/jcb.200804003 - DOI - PMC - PubMed
    1. Balakrishnan S. S., Basu U. and Raghu P. (2015). Phosphoinositide signalling in Drosophila. Biochim. Biophys. Acta Mol. Cell Biol. Lipids 1851, 770-784. 10.1016/j.bbalip.2014.10.010 - DOI - PubMed
    1. Balla A., Tuymetova G., Tsiomenko A., Várnai P. and Balla T. (2005). A plasma membrane pool of phosphatidylinositol 4-phosphate is generated by phosphatidylinositol 4-kinase type-III alpha: studies with the PH domains of the oxysterol binding protein and FAPP1. Mol. Biol. Cell 16, 1282-1295. 10.1091/mbc.e04-07-0578 - DOI - PMC - PubMed
    1. Balla A., Kim Y. J., Varnai P., Szentpetery Z., Knight Z., Shokat K. M. and Balla T. (2008). Maintenance of hormone-sensitive phosphoinositide pools in the plasma membrane requires phosphatidylinositol 4-kinase IIIalpha. Mol. Biol. Cell 19, 711-721. 10.1091/mbc.e07-07-0713 - DOI - PMC - PubMed

Publication types

Substances