. 2018 Sep 3;217(9):3031-3044.
doi: 10.1083/jcb.201801162. Epub 2018 Jul 6.

Intermediate filaments control collective migration by restricting traction forces and sustaining cell-cell contacts

Affiliations

Intermediate filaments control collective migration by restricting traction forces and sustaining cell-cell contacts

Chiara De Pascalis et al. J Cell Biol. .

Abstract

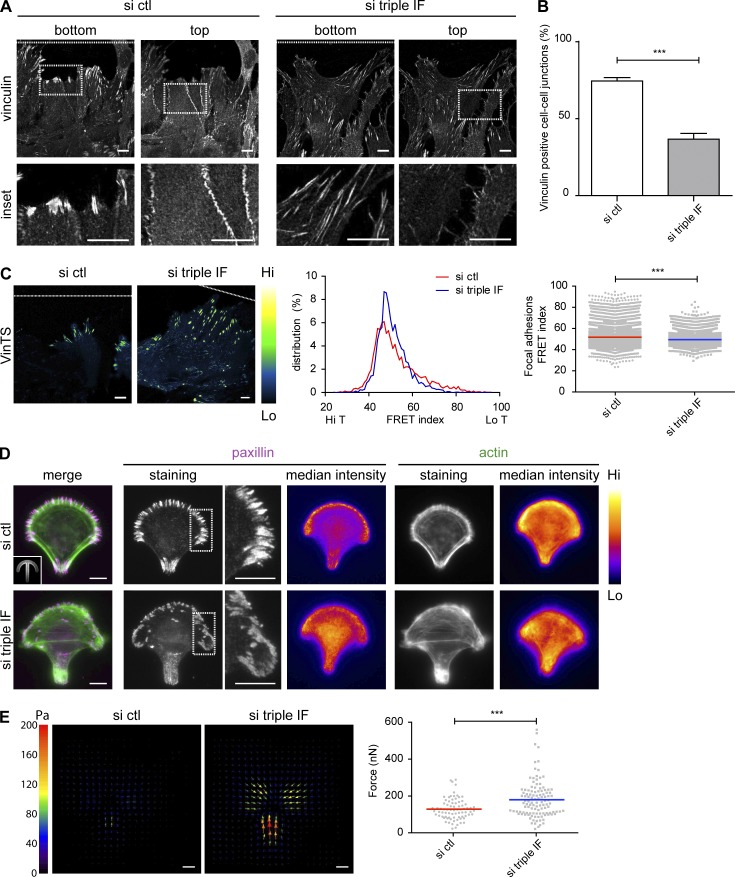
Mesenchymal cell migration relies on the coordinated regulation of the actin and microtubule networks that participate in polarized cell protrusion, adhesion, and contraction. During collective migration, most of the traction forces are generated by the acto-myosin network linked to focal adhesions at the front of leader cells, which transmit these pulling forces to the followers. Here, using an in vitro wound healing assay to induce polarization and collective directed migration of primary astrocytes, we show that the intermediate filament (IF) network composed of vimentin, glial fibrillary acidic protein, and nestin contributes to directed collective movement by controlling the distribution of forces in the migrating cell monolayer. Together with the cytoskeletal linker plectin, these IFs control the organization and dynamics of the acto-myosin network, promoting the actin-driven treadmilling of adherens junctions, thereby facilitating the polarization of leader cells. Independently of their effect on adherens junctions, IFs influence the dynamics and localization of focal adhesions and limit their mechanical coupling to the acto-myosin network. We thus conclude that IFs promote collective directed migration in astrocytes by restricting the generation of traction forces to the front of leader cells, preventing aberrant tractions in the followers, and by contributing to the maintenance of lateral cell-cell interactions.


Figures

Figure 1.
Figure 1.
IFs control collective astrocyte migration by regulating traction forces. (A) Phase-contrast images of astrocyte (shown in Video 1) wound healing after 24 h of migration. Black lines represent the initial position (0 h), and white lines show the final position (24 h), of the leading edge. (B) Simplified method for calculating persistence and directionality of migration of a cell with nuclear tracking. For more detailed formulas, see Materials and methods. (C) Graphs of cell velocity, directionality, and persistence measured by manual nuclear tracking of leader cells after 24 h of migration. (D) Simplified protocol for plating cells into PDMS rectangular stamps onto hydrogels. The black dotted arrows show the main directions of migration. The central image shows a monolayer of cells migrating on a hydrogel embedded with fluorescent beads (green dots) with representative tractions (T, blue arrows). The last image represents schematically the components of tractions (Tx and Ty) analyzed with TFM. (E) Phase-contrast images of astrocytes migrating on a 9-kPa collagen-coated polyacrylamide hydrogel at different time points. The white dotted line represents the leading edge, and the arrows show the direction of migration. See also Video 2. (F) Tractions in the x direction (Tx) at indicated time points. See also Video 3. (G) Representative kymographs of total tractions (|T|). (H) Graphs of tractions in the x direction (Tx), mean values (left) and values at the edge of the monolayer (middle) and at the center (right). (I) Graph showing the ratio of the tractions at the edge over tractions at the center, plotted as a function of time of migration. Data are from n = 3 independent experiments. The sample size for each repeat is: si ctl 50, 50, 50; si triple IF 50, 50, 50; si GFAP 50, 50, 50; si vimentin 50, 50, 49; si nestin 50, 50, 50 cells for C; two, one, and four videos of si ctl and two, three, and three videos of si triple IF for E–I. Graphs show mean ± SEM. *, P < 0.05; **, P < 0.01; and ***, P < 0.001. Bars, 50 µm.
Figure 2.
Figure 2.
IFs control the organization and dynamics of the actin network. (A) Immunofluorescence images of actin fibers in migrating astrocytes stained for nuclei (cyan) and actin (phalloidin, gray). (B) Graph showing the percentage of leader cells that present ITAs in si ctl and si triple IF cells. (C) Rose plot showing the frequency of angle distribution of actin fibers analyzed in follower cells (Fig. S3 D). Fibers with a 0° angle are perpendicular to the wound, and fibers with an angle close to 90° are parallel to the wound. (D) Schematics showing the position of the kymographs acquired in E–G. (E) Frames of migrating si ctl and si triple IF astrocytes transfected with LifeAct-mCherry. The white dotted line represents the wound, and the pink dotted lines represent the positions in which the kymographs were calculated. Kymographs (fire LUT) show the retrograde flow of actin on cell–cell junctions over a time period of 4 h. The graph shows the mean retrograde flow speed of actin cables measured at the level of the cell–cell junctions. (F) Frames from Video 4 of migrating astrocytes transfected with GFP-MRLC. The thick white dotted line represents the outline of nearby cells. The kymographs were obtained along the pink dotted lines. f and b on the side of the kymograph indicate the front and the rear of the line. Kymographs (fire LUT) show the retrograde flow of myosin at the front and at the rear of myosin longitudinal fibers over a time period of 15 min. The graph shows the mean speed of the myosin retrograde flow at the cell front and at the rear of the longitudinal fiber calculated from the kymographs. The white dotted lines indicate the position of the wound. (G) Immunofluorescence images from Video 5 showing GFP-N-cadherin–expressing astrocytes. Insets show the corresponding phase-contrast image. N, nucleus. The kymographs were obtained along the pink dotted lines. f and b on the side of the kymographs indicate the front and the rear of the line. Kymographs (fire LUT) show the retrograde flow of N-cadherin over a time period of 2 h. The graph shows the mean retrograde flow speed of the N-cadherin flow in si ctl and si triple IF migrating astrocytes. (H) Staining for N-cadherin (gray) and nuclei (cyan) in migrating astrocytes nucleofected with the indicated siRNAs. Histogram shows the mean percentage ± SEM of continuous junctions between adjacent leader cells. White dotted line indicates the position of the wound. Data are from n = 3 independent experiments. The sample size for each repeat: si ctl 64, 67, 92 and si triple IF 44, 96, 122 for B; si ctl 11, 10, eight stacks and si triple IF 12, 10, eight stacks for C; si ctl 30, 40, 32 and si triple IF 18, 33, 30 for E; si triple IF f 22, 27, 18 and si triple IF b 22, 24, 20 for F; si ctl 14, 38, 28 and si triple IF 38, 49, 14 for G; si ctl 104, 120, 178, si GFAP 134, 137, 125, si vimentin 113, 180, 133, si nestin 132, 190, 123, and si triple IF 122, 225, 112 for H. ***, P < 0.00. Bars: (main images) 10 µm; (kymographs and insets of H) 5 µm.
Figure 3.
Figure 3.
IFs and plectin regulate FA localization and dynamics. (A) Fluorescence SIM-3D images of a migrating astrocytes transfected with GFP-vimentin and paxillin-Orange shown in Video 6 (see also Video 7). The orthogonal projections show that vimentin and paxillin are found in the same focal plane. (B) Immunofluorescence images of migrating astrocytes stained for nuclei (cyan) and paxillin (green). The white dotted lines indicate the position of the wound. Insets show enlarged images of FAs at the leading edge and in a central region of the cell. (C) The top left graph shows the mean number of FAs per cell, and the bottom left graph, the mean area of FAs. Adhesions were projected on the nucleus-tip axis (see schematics). The central top graph shows the normalized distance to the nucleus center of each FA. The central bottom graph shows the distribution of adhesions along the nucleus-tip axis. (D) Lifetime of GFP-paxillin–positive adhesions in migrating leader astrocytes (top). Duration time of assembly and disassembly of these adhesions (bottom). (E) Lifetime of GFP-paxillin positive adhesions in migrating astrocytes (left) of the second and third rows. Duration time of assembly and disassembly of these adhesions (right). (F) Immunofluorescence images of astrocytes in the migrating monolayer stained for nuclei (cyan) and paxillin (green). Data are from n = 3 independent experiments. The sample size for each repeat: si ctl 49, 50, 50, si triple IF 50, 50, 50, and si plectin 50, 50, 55 for C; si ctl 26, 40, 40 and si triple IF 26, 40, 40 for D; si ctl 16, 16, 35 and si triple IF 8, 36, 37 for E. n.s., P > 0.05; *, P < 0.05; **, P < 0.01; and ***, P < 0.001. Bars: (orthogonal projections of A) 1 µm; (A and insets of B) 5 µm; (B top and F) 10 µm.
Figure 4.
Figure 4.
Plectin knockdown phenocopies IF depletion. (A) Immunofluorescence images of migrating astrocytes stained for nuclei (cyan), paxillin (green), and plectin (magenta). (B) Western blot analysis using indicated antibodies of total astrocyte lysates (left) and proteins immunoprecipitated with antibodies against plectin, talin, or vinculin and control antibodies (IgG Ms) before and 4 h after wounding. Input lysate corresponds to 2% of the total lysate used for the IP, with a higher exposition shown for plectin and talin bands. (C) Immunofluorescence images of migrating astrocytes stained for nuclei (cyan) and actin (phalloidin, gray) compared with si ctl (Fig. 2 A). The white dotted line represents the position of the wound. The quantification shows the percentage of cells that present ITAs. (D) Immunofluorescence images of migrating astrocytes stained for the AJ marker α-E-catenin (gray) and nuclei (cyan). The white dotted line represents the position of the wound. (E) Quantification of nuclear tracking of migrating astrocytes after 24 h of migration. The graphs show cell velocity, directionality, and persistence of migration of astrocytes nucleofected with si ctl or si plectin. (F) Immunofluorescence images of centrosome orientation in plectin-depleted astrocytes stained for nuclei (cyan) and centrin (red) compared with si ctl (Fig. S1 F). White arrowheads were scored as polarized centrosomes, and yellow ones were scored as nonpolarized centrosomes. The graphs show the percentage of cells with the centrosome located in the wound-facing quadrant in front of the nucleus. Data are from n = 3 independent experiments. The sample size for each repeat: si ctl 262, 247, 150 and si plectin 384, 245, 155 for C; si ctl 40, 50, 39 and si plectin 50, 50, 49 for E; si ctl 92, 222, 83 and si plectin 101, 210, 123 for F. ***, P < 0.001. Histograms show mean ± SEM. Bar, 10 µm.
Figure 5.
Figure 5.
IFs limit the generation of traction forces at FAs. (A) Immunofluorescence confocal images in two distinct focus planes of astrocytes stained for vinculin. The white dotted line indicates the position of the wound. (B) Graph showing the percentage of junctions showing positive vinculin staining. (C) Fluorescence images of migrating astrocytes expressing VinTS (Green Fire Blue LUT). Representative frequency distribution of frequencies of FRET index (central graph) and quantification of the mean FRET index (inversely related to vinculin tension) of vinculin in FAs (right graph). Each dot represents a FA. The white dotted line indicates the position of the wound. (D) Immunofluorescence and intensity projection (fire LUT) of paxillin (magenta) and actin (green) on micropatterned cells. Inset shows the crossbow-shaped micropattern. Projections are calculated on one experiment representative of three. (E) Left: Tractions fields of astrocytes plated on collagen-coated crossbows. Arrows indicate the orientation, color, and length of the local magnitude of the force in Pa. Right: Quantification of traction forces in single micropatterned cells. Data are from n = 3 independent experiments. Histograms show mean ± SEM. The sample size for each repeat: si ctl 137, 247, 150 and si triple IF 222, 200, 151 for B; si ctl 2,537, 3,312, 1,473 adhesions and si triple IF 1,447, 2,548, 2,081 adhesions for C; si ctl 32, 21, 25 and si triple IF 30, 46, 38 for E. ***, P < 0.001. Bar, 10 µm.

References

    1. Akhmanova A., Stehbens S.J., and Yap A.S.. 2009. Touch, grasp, deliver and control: Functional cross-talk between microtubules and cell adhesions. Traffic. 10:268–274. 10.1111/j.1600-0854.2008.00869.x - DOI - PubMed
    1. Bakolitsa C., Cohen D.M., Bankston L.A., Bobkov A.A., Cadwell G.W., Jennings L., Critchley D.R., Craig S.W., and Liddington R.C.. 2004. Structural basis for vinculin activation at sites of cell adhesion. Nature. 430:583–586. 10.1038/nature02610 - DOI - PubMed
    1. Burda J.E., Bernstein A.M., and Sofroniew M.V.. 2016. Astrocyte roles in traumatic brain injury. Exp. Neurol. 275:305–315. 10.1016/j.expneurol.2015.03.020 - DOI - PMC - PubMed
    1. Burgstaller G., Gregor M., Winter L., and Wiche G.. 2010. Keeping the vimentin network under control: Cell-matrix adhesion-associated plectin 1f affects cell shape and polarity of fibroblasts. Mol. Biol. Cell. 21:3362–3375. 10.1091/mbc.e10-02-0094 - DOI - PMC - PubMed
    1. Camand E., Peglion F., Osmani N., Sanson M., and Etienne-Manneville S.. 2012. N-cadherin expression level modulates integrin-mediated polarity and strongly impacts on the speed and directionality of glial cell migration. J. Cell Sci. 125:844–857. 10.1242/jcs.087668 - DOI - PubMed

Publication types