Review
. 2018 Aug;29(8):2069-2080.
doi: 10.1681/ASN.2018020125. Epub 2018 Jul 6.

Single-Cell Transcriptomics of a Human Kidney Allograft Biopsy Specimen Defines a Diverse Inflammatory Response

Affiliations
Review

Single-Cell Transcriptomics of a Human Kidney Allograft Biopsy Specimen Defines a Diverse Inflammatory Response

Haojia Wu et al. J Am Soc Nephrol. 2018 Aug.

Abstract

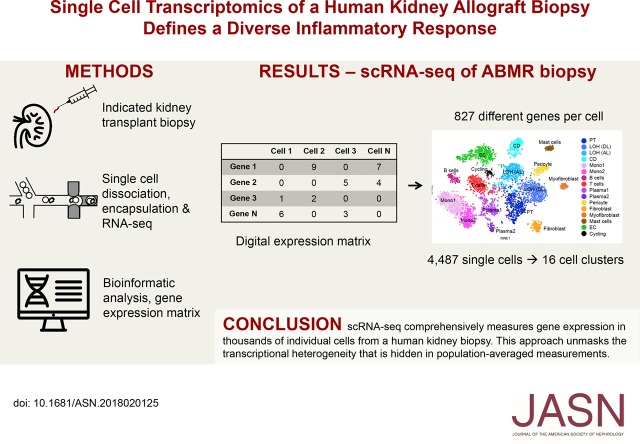
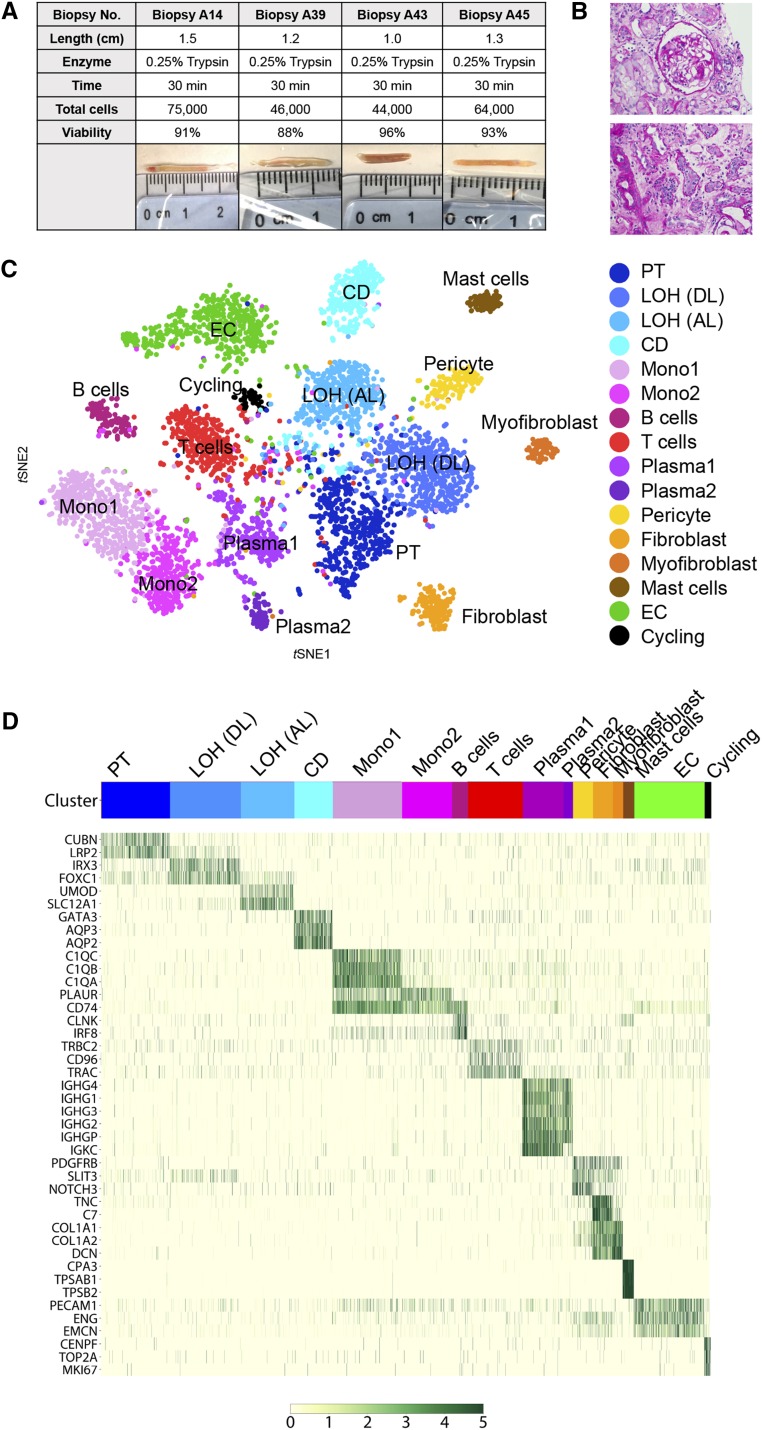
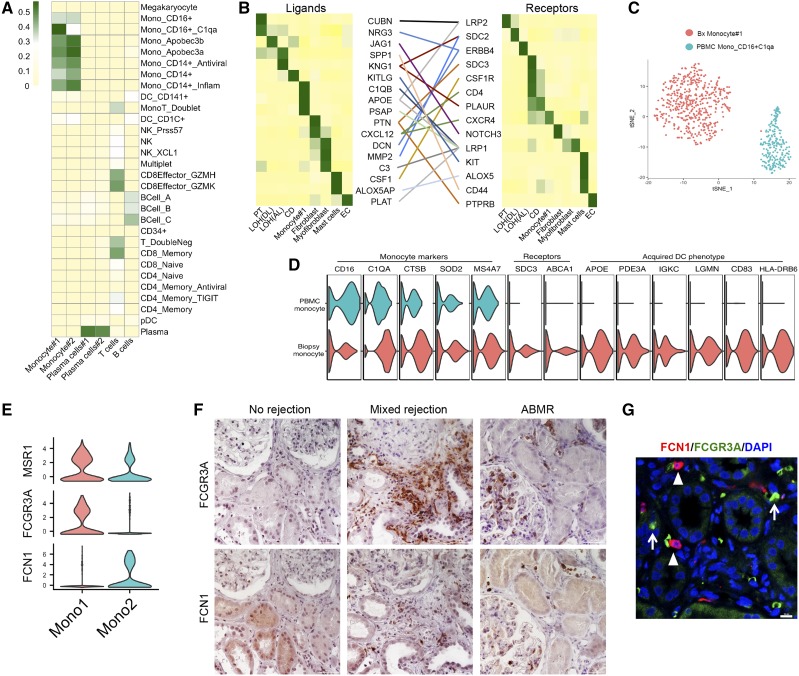
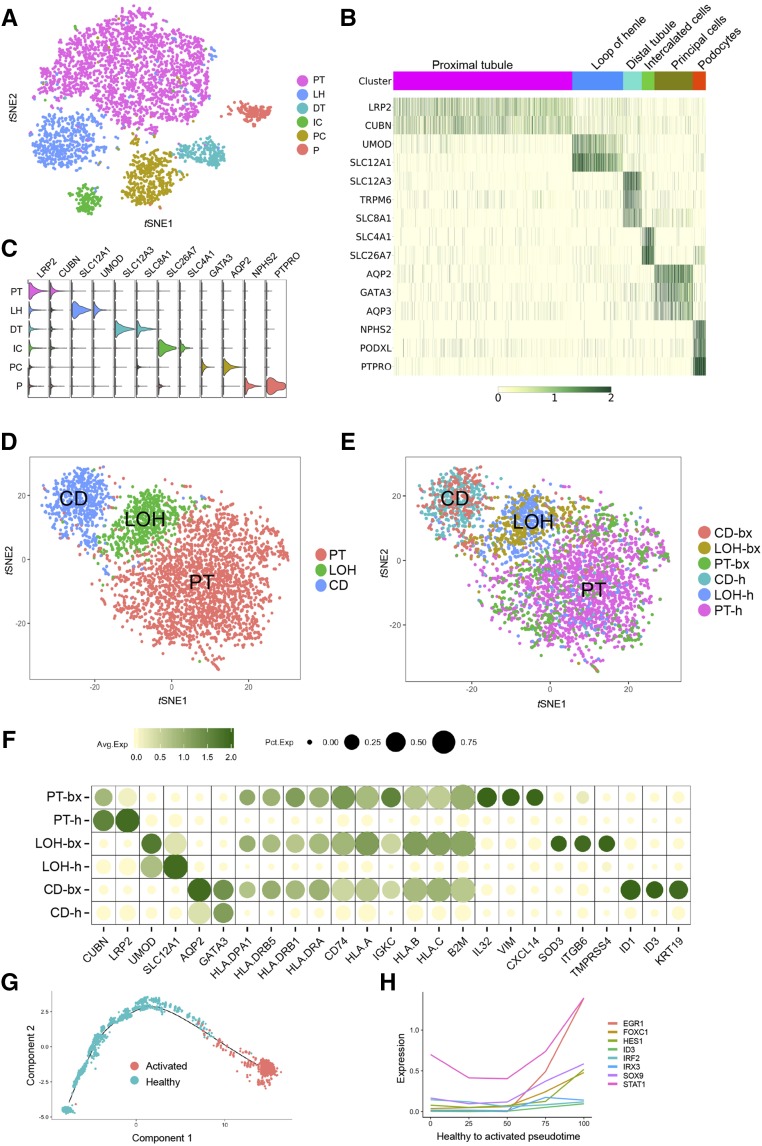
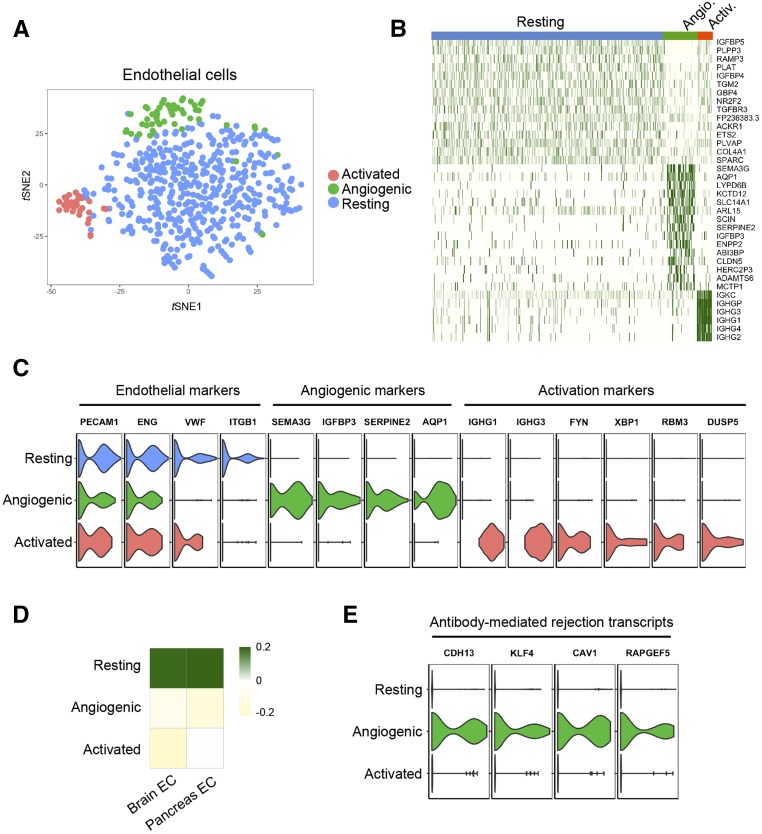
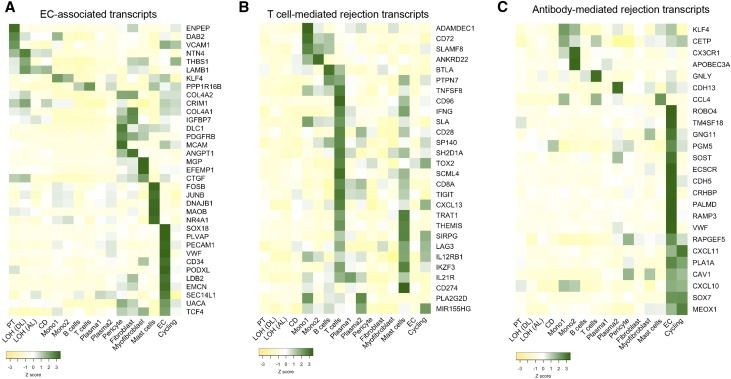
Background Single-cell genomics techniques are revolutionizing our ability to characterize complex tissues. By contrast, the techniques used to analyze renal biopsy specimens have changed little over several decades. We tested the hypothesis that single-cell RNA-sequencing can comprehensively describe cell types and states in a human kidney biopsy specimen.Methods We generated 8746 single-cell transcriptomes from a healthy adult kidney and a single kidney transplant biopsy core by single-cell RNA-sequencing. Unsupervised clustering analysis of the biopsy specimen was performed to identify 16 distinct cell types, including all of the major immune cell types and most native kidney cell types, in this biopsy specimen, for which the histologic read was mixed rejection.Results Monocytes formed two subclusters representing a nonclassical CD16+ group and a classic CD16- group expressing dendritic cell maturation markers. The presence of both monocyte cell subtypes was validated by staining of independent transplant biopsy specimens. Comparison of healthy kidney epithelial transcriptomes with biopsy specimen counterparts identified novel segment-specific proinflammatory responses in rejection. Endothelial cells formed three distinct subclusters: resting cells and two activated endothelial cell groups. One activated endothelial cell group expressed Fc receptor pathway activation and Ig internalization genes, consistent with the pathologic diagnosis of antibody-mediated rejection. We mapped previously defined genes that associate with rejection outcomes to single cell types and generated a searchable online gene expression database.Conclusions We present the first step toward incorporation of single-cell transcriptomics into kidney biopsy specimen interpretation, describe a heterogeneous immune response in mixed rejection, and provide a searchable resource for the scientific community.

Keywords: kidney biopsy; rejection; transcriptional profiling.


Figures

None
Graphical abstract
Figure 1.
Figure 1.
Comprehensive single-cell RNA-sequencing of an allograft biopsy reveals diverse kidney and immune cell types. (A) Four 16-mm biopsy cores were subjected to cell dissociation. Cell yield varied between 44,000 and 75,000 cells, and viability was 88%–96%. (B) Biopsy A14 was used for single-cell RNA-sequencing, and periodic acid–Schiff staining revealed diffuse inflammatory infiltrates. (C) tSNE plot of cell clusters identified on the basis of the expression of highly variable genes. (D) Heat map of all cells clustered by recursive hierarchical clustering and Louvain–Jaccard clustering (Seurat) showing selected marker genes for each population. CD, collecting duct; EC, endothelial cell; LOH (AL), loop of Henle, ascending limb; LOH (DL), loop of Henle, distal limb; Mono, monocyte; PT, proximal tubule; tSNE, t-Distributed Stochastic Neighbor Embedding.
Figure 2.
Figure 2.
Annotation of leukocyte subsets. (A) Heat map indicating Pearson correlations of the averaged transcriptional profiles between human PBMCs and leukocyte clusters from the kidney biopsy. (B) Ligand-receptor pair expression according to cell type. Ligands are indicated in the left panel, and receptors are indicated in the right panel. Straight lines indicate ligand-receptor pairs. (C) The biopsy monocyte 1 cluster is most similar to CD16+ peripheral blood monocytes on the basis of average expression; however, these cells form different clusters on the basis of tSNE, indicating that they are different cell types. (D) The monocyte 1 cluster is differentiating toward an acquired dendritic cell phenotype on the basis of expression of marker genes. (E) Violin plot showing that FCGR3A (CD16) distinguishes monocyte 1 from monocyte 2, whereas FCN1 is expressed in monocyte 2 but not monocyte 1. MSR1 is expressed in both clusters. (F) Immunohistochemistry for FCGR3A or FCN1 on normal, mixed rejected, or pure antibody-mediated rejection (ABMR) transplant kidney biopsies. Distinct monocyte 1 and 2 cell types can be seen. Upper and lower panels are serial sections. Scale bar, 50 μm. (G) Immunofluorescence analysis of mixed rejection. FCN1+ cells (arrowheads) and FCGR3A+ cells (arrows) are separate cell types. CD, collecting duct; DAPI, 4′,6-diamidino-2-phenylindole; EC, endothelial cell; LOH (AL), loop of Henle, ascending limb; LOH (DL), loop of Henle, distal limb; Mono, monocyte; PT, proximal tubule. Scale bar, 10 μm.
Figure 3.
Figure 3.
Comparison of epithelia from single-cell RNA-sequencing of healthy adult kidney with transplant biopsy reveals activated and proinflammatory cell states. (A) Unsupervised clustering identified six distinct cell types in human adult kidney. These types include three tubular cell types (proximal tubule [PT], loop of Henle (LH), and distal tubule (DT), two collecting duct (CD) cell populations principal cells (PC) and intercalated cells (IC), and one podocyte population (P). (B) The heat map showed that putative molecular signature marks the identity of each cluster. (C) The violin plot further confirmed the clean expression of well known cell type–specific markers in each cell population, which makes it suitable for use in benchmarked comparison analysis. (D) tSNE analysis of PT, loop of Henle (LOH), and CD cells from the allograft biopsy and healthy adult human kidney cluster together indicating that cell identity is maintained despite allograft inflammation. (E) Collecting duct cells from the biopsy (CD-bx) coproject by tSNE onto the collecting duct cluster from healthy kidney (CD-h). The same is true of PT and LOH. (F) A dot plot comparing expression of terminal differentiation or inflammatory genes in epithelial cells from the biopsy or healthy kidney. (G) Ordering of healthy and activated PT cells along pseudotime using Monocle. (H) Selected transcription factors that are upregulated during PT activation. LOH-bx, loop of Henle from the biopsy; LOH-h, loop of Henle from healthy kidney; PT-bx, proximal tubule from the biopsy; PT-h, proximal tubule from healthy kidney.
Figure 4.
Figure 4.
Analysis of endothelial cell (EC) subsets. (A) tSNE plot of endothelial subclusters from the kidney biopsy. (B) Heat map showing selected marker genes for the three EC subclusters. (C) Violin plots showing conserved expression of endothelial markers across all three subclusters. The genes SEMA3G, IGFBP3, SERPINE2, and AQP1 indicate activation of an angiogenic program. A separate EC subcluster expresses Igs as well as markers of endoplasmic reticulum stress (XBP1) and cold shock (RBM3). (D) Pearson correlation of all three EC subsets shows best correlation between the resting EC cluster and healthy brain or pancreas ECs. (E) Markers of antibody-mediated rejection are detected in the angiogenic cluster.
Figure 5.
Figure 5.
Marker gene localization to independent stromal cell types. The expression of known and new cell type discriminating genes. Violin plots are shown adjacent to immunohistochemistry, which is from the Human Protein Atlas (https://www.proteinatlas.org/). Examples of pericyte-, fibroblast-, and myofibroblast-specific marker genes are shown. In addition, DCN and COL6A1 are expressed in both fibroblast and myofibroblast populations, whereas SPARC, BGN, and COL6A2 are expressed in all three stromal cell types.
Figure 6.
Figure 6.
Mapping cell type expression of genes previously associated with kidney allograft pathology. (A) Expression of 35 endothelial cell (EC)–associated genes identified in bulk transcriptional profiling assigned to individual biopsy cell types (likelihood ratio test). A heat map was used to visualize the z score–normalized average gene expression of the candidate genes for each cell cluster identified from the biopsy dataset. A majority of EC-associated transcripts are not expressed in ECs. (B) A similar analysis performed on transcripts associated with T cell–mediated rejection reveals that nearly all of them are expressed in leukocytes and that the majority are expressed in T cells. (C) A similar analysis on transcripts associated with antibody-mediated rejection reveals that most of the genes were expressed in EC clusters. CD, collecting duct; LOH (AL), loop of Henle, ascending limb; LOH (DL), loop of Henle, distal limb; Mono, monocyte; PT, proximal tubule.

Comment in

Similar articles

Cited by

References

    1. Park J, Shrestha R, Qiu C, Kondo A, Huang S, Werth M, et al. .: Single-cell transcriptomics of the mouse kidney reveals potential cellular targets of kidney disease [published online ahead of print April 5, 2018]. Science doi:10.1126/science.aar2131 - DOI - PMC - PubMed
    1. Malone AF, Wu H, Humphreys BD: Bringing renal biopsy interpretation into the molecular age with single-cell RNA sequencing. Semin Nephrol 38: 31–39, 2018 - PMC - PubMed
    1. Sellarés J, de Freitas DG, Mengel M, Reeve J, Einecke G, Sis B, et al. .: Understanding the causes of kidney transplant failure: The dominant role of antibody-mediated rejection and nonadherence. Am J Transplant 12: 388–399, 2012 - PubMed
    1. El-Zoghby ZM, Stegall MD, Lager DJ, Kremers WK, Amer H, Gloor JM, et al. .: Identifying specific causes of kidney allograft loss. Am J Transplant 9: 527–535, 2009 - PubMed
    1. Gaston RS, Cecka JM, Kasiske BL, Fieberg AM, Leduc R, Cosio FC, et al. .: Evidence for antibody-mediated injury as a major determinant of late kidney allograft failure. Transplantation 90: 68–74, 2010 - PubMed

MeSH terms