. 2018 Jul 6;8(1):10274.
doi: 10.1038/s41598-018-28670-w.

Gestational exposure to chlordecone promotes transgenerational changes in the murine reproductive system of males

Affiliations

Gestational exposure to chlordecone promotes transgenerational changes in the murine reproductive system of males

Aurore Gely-Pernot et al. Sci Rep. .

Abstract

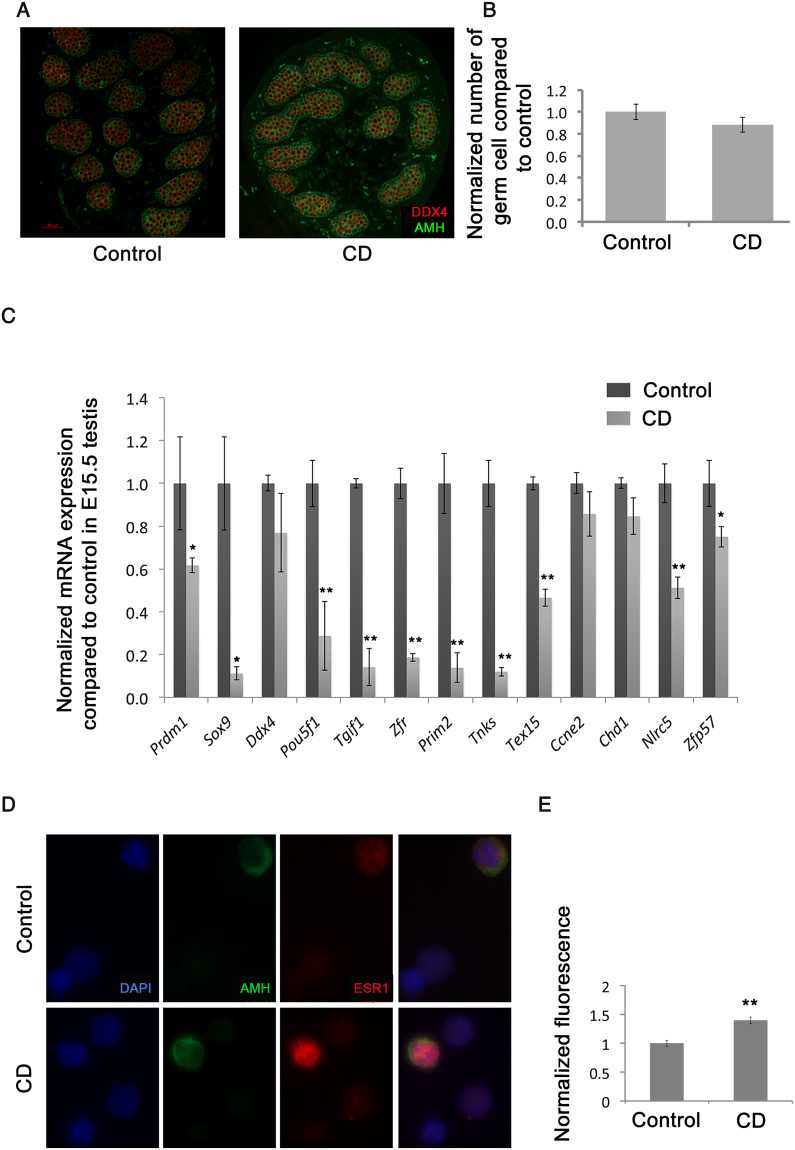
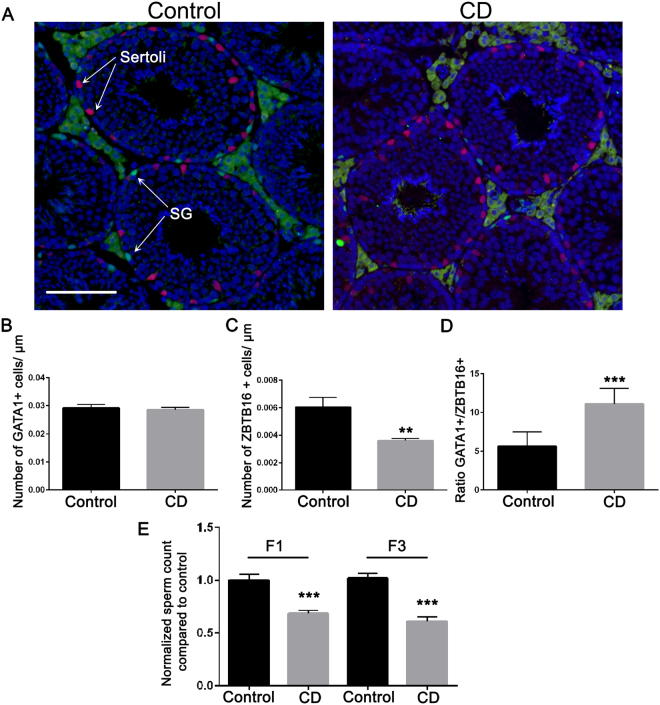
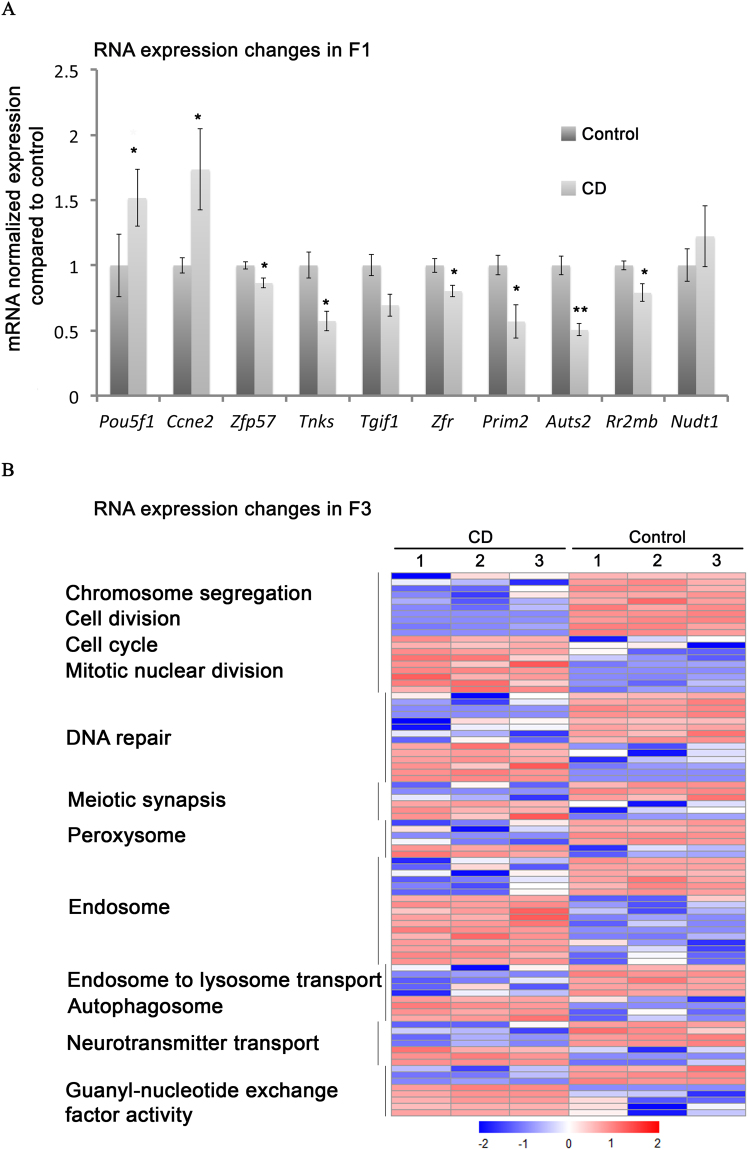
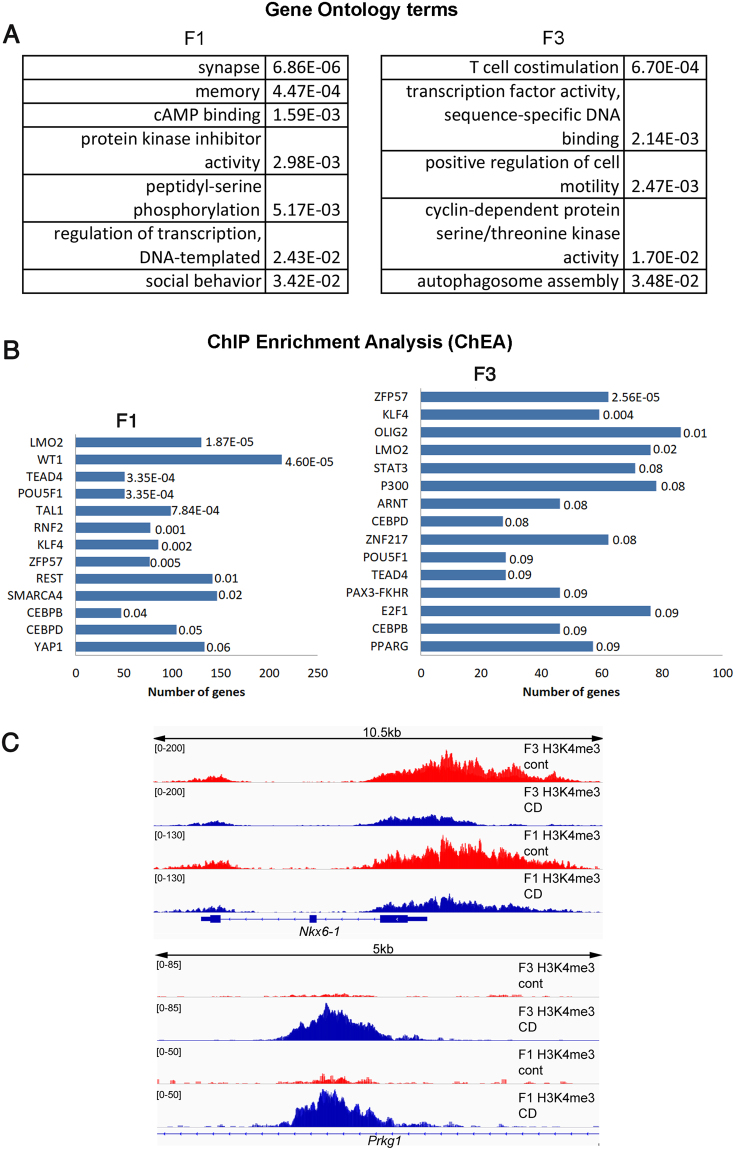
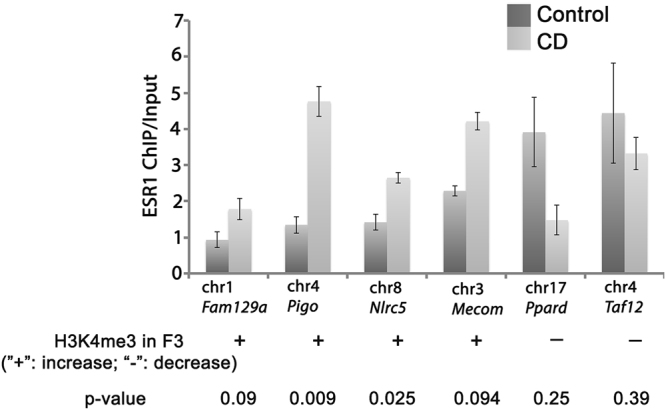
Environmental factors can affect epigenetic events during germline reprogramming and impose distinctive transgenerational consequences onto the offspring. In this study, we examined the transgenerational effects of chlordecone (CD), an organochlorine insecticide with well-known estrogenic properties. We exposed pregnant mice to CD from embryonic day 6.5 to 15.5 and observed a reduction in spermatogonia (SG) numbers in F3, meiotic defects in spermatocytes and decrease in spermatozoa number in the first and third generation of male progeny. The RNA qRT-PCR expression analysis in F1 and transcriptomics analysis in F3 males using the whole testes revealed changes in the expression of genes associated with chromosome segregation, cell division and DNA repair. The expression of the master regulator of pluripotency, Pou5f1, decreased in foetal and increased in adult F1, but not in F3 adult testes. Analysis of histone H3K4me3 distribution revealed widespread changes in its occupancy in the genome of F1 and F3 generations. We established that 7.1% of altered epigenetic marks were conserved between F1 and F3 generations. The overlapping changes common to F1 and F3 include genes implicated in cell adhesion and transcription factor activities functions. Differential peaks observed in F1 males are significantly enriched in predicted ESR1 binding sites, some of which we confirmed to be functional. Our data demonstrate that CD-mediated impairment of reproductive functions could be transmitted to subsequent generations.


Conflict of interest statement

The authors declare no competing interests.

Figures

Figure 1
Figure 1
Gestational CD exposure affects F1 embryonic germ cells. (A) Representative images of testes sections from the control (left panel) and CD lineage (right panel) animals. Sertoli and prospermatogonial germ cells were immunostained using anti-Anti Müllerian Hormone (AMH, green) or anti-DDX4 (red) antibodies, respectively, scale bar 50 µm. (B) A quantitative analysis of germ cells was performed by manually counting the cells in the seminiferous tubules in E15.5 mouse testes. The contour of each tubule section was measured using Adobe Photoshop. The values indicate the germ cell numbers compared to control. The bar indicates the mean value +/−SEM, (p = 0.176, n = 4 control, n = 5 CD samples, t-test). (C) The RT–qPCR analysis in F1 E15.5 testis. RNA was extracted and reverse transcribed as described in material and methods, qPCR was performed using primers indicated in SI. The gene copy numbers were normalized against Hprt gene and expressed as fold changes compared to control, *p < 0.5, **p < 0.01, t-test, n = 4, for control and CD, each biological replicate represents pooled testes. (D) A representative image of isolated E15.5 cells from testes. Testis cells were immunostained using anti-AMH1 (green) or anti-ESR1 (red) antibodies. In control (top panel) or treated (lower panel), nuclei are stained with DAPI and are shown in blue. Germ cells are negative for AMH, whereas Sertoli cells are positive. DAPI-stained cells represent all cells. In control, ESR1 staining appears as red nuclear and cytoplasmic; in CD-treated, as preferential nuclear staining. (E) Quantitative analysis of ESR1 signal in nuclei was performed using ImageJ software and presented as relative fluorescence +/−SEM, (p = 0.001, n = 3 control, n = 3 CD samples, t-test).
Figure 2
Figure 2
Gestational exposure to CD decreases the number of undifferentiated SG in the F3 generation males and leads to a decrease in spermatozoa number in F1 and F3. (A) Representative images of testes sections from the control (left panel) and CD lineage (right panel) animals: Sertoli and SG cells were immunostained using anti-GATA1 (red) or anti-ZBTB16 (green) antibodies, respectively. The ZBTB16 antibody staining of Leydig cells located outside of seminiferous tubules is non-specific, scale bar 150 µm. A quantitative analysis of (B) Sertoli cells and (C) SG was performed by manually counting the cells at stage VII of the seminiferous epithelium in F3 mouse testes. The contour of each tubule section was measured using ImageJ. The values shown indicate the cell counts per micrometre of tubule circumference. (D) The ratio of the number of Sertoli cells per SG is also indicated (**p < 0.01, n = 7 control, n = 6 CD, t-test). The immunostaining of the testis sections was performed as described in the Methods section. (E) Spermatozoa numbers in F1 and F3 have decreased. Spermatozoa were counted as described in the Methods section, by using epididymis of at least 8 biological replicates for control and CD and data presented as normalised value compared to control +/−SEM, (F1: p = 3.69E-4, n = 9 control and CD; F3: p = 1.64E-5, n = 8 control, n = 9 CD, t-test).
Figure 3
Figure 3
Gestational exposure to CD affects meiotic synapsing in F1 and F3 CD-derived males. Surface spreads were prepared from F3 generation testes obtained from control (A) or CD-derived males (BD) males as described in the Methods section. The spreads were immunostained for a major protein of the lateral element of the synaptonemal complex (SC), SYCP3 (red, left panel), and for a protein expressed in the SC central element, SYCP1 (green, middle panel); the overlap between the two is also shown (right panel). (A) Representative images of a control testis spread. Normally, SYCP3 is detected along the length of every chromosome, while SYCP1 is expressed on all autosomal chromosomes and is visible as a punctate signal or absent immunostaining pattern in sex chromosomes (dashed circle, right panel). (B,C) In CD-derived males, meiotic cells with telomere connections and ring-like structure of sex chromosomes are notable. (D) The formation of “ring” like structures in sex chromosomes. X and Y sex chromosomes (sex bodies) are shown (dashed circle). The arrows point to chromosomes where telomeres are completely closed or fused.
Figure 4
Figure 4
RNA expression changes in F1 and F3 CD-derived adult males. (A) The RT-QPCR data of RNA expression in F1. The RNA from 5 animals for each condition was extracted, reverse transcribed and analysed by qPCR for each target gene. The copy numbers of each target gene were normalised to Actb copy numbers, and data were presented as normalised values compared to control +/−SEM, (*p < 0.05, **p < 0.001, t-test). (B) A heatmap of the differentially expressed genes in the testes. The hierarchical cluster analysis identified 8 gene groups that could be segregated according to their expression levels in testis fractions. Red indicates high and blue indicates low expression.
Figure 5
Figure 5
Histone H3K4me3 occupancy is globally affected in F1 and F3 generations following CD treatment. (A) The gene ontology (GO) terms are sorted based on p-value, calculated by DAVID, p-values are indicated against GO terms in the table, Fisher’s exact test. (B) Enrichment in GO terms located within the differential peaks identified by ChEA. Terms are sorted based on adjusted p-values and are indicated at the end of each bar. (C) The H3K4me3 occupancies in Nkx6-1 and Prkg1 have been altered in both F1 and F3 generations males.
Figure 6
Figure 6
ESR1 binding is altered in CD treated testes. The ChIP was performed using antibody against ESR1 in E15.5 testis. The immunoprecipitated DNA was quantitated with fluorescent method and equal amount of ChIP and Input DNAs was taken for each PCR using the primers indicated in SI. The ESR1 predicted binding sites were obtained by FIMO analysis and primers were designed after repeat masking of each target sequence. The copy number for each gene was normalized for quantity to control region without ESR1 binding sites (Gapdh gene) and compared to Input. The data was expressed as ChIP-to-input enrichment.

Similar articles

Cited by

References

    1. Zhao XD, et al. Whole-genome mapping of histone H3 Lys4 and 27 trimethylations reveals distinct genomic compartments in human embryonic stem cells. Cell stem cell. 2007;1:286–298. doi: 10.1016/j.stem.2007.08.004. - DOI - PubMed
    1. Barski A, et al. High-resolution profiling of histone methylations in the human genome. Cell. 2007;129:823–837. doi: 10.1016/j.cell.2007.05.009. - DOI - PubMed
    1. Mikkelsen TS, et al. Genome-wide maps of chromatin state in pluripotent and lineage-committed cells. Nature. 2007;448:553–560. doi: 10.1038/nature06008. - DOI - PMC - PubMed
    1. Lesch BJ, Dokshin GA, Young RA, McCarrey JR, Page DC. A set of genes critical to development is epigenetically poised in mouse germ cells from fetal stages through completion of meiosis. Proceedings of the National Academy of Sciences of the United States of America. 2013;110:16061–16066. doi: 10.1073/pnas.1315204110. - DOI - PMC - PubMed
    1. Brykczynska U, et al. Repressive and active histone methylation mark distinct promoters in human and mouse spermatozoa. Nature structural & molecular biology. 2010;17:679–687. doi: 10.1038/nsmb.1821. - DOI - PubMed

Publication types

MeSH terms