. 2018 Jul 6;8(1):10283.
doi: 10.1038/s41598-018-28486-8.

Multiple liver insults synergize to accelerate experimental hepatocellular carcinoma

Affiliations

Multiple liver insults synergize to accelerate experimental hepatocellular carcinoma

James M Henderson et al. Sci Rep. .

Abstract

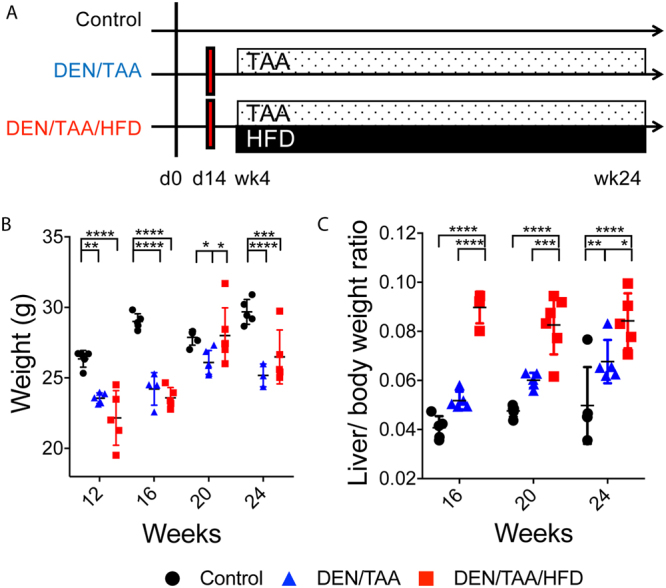
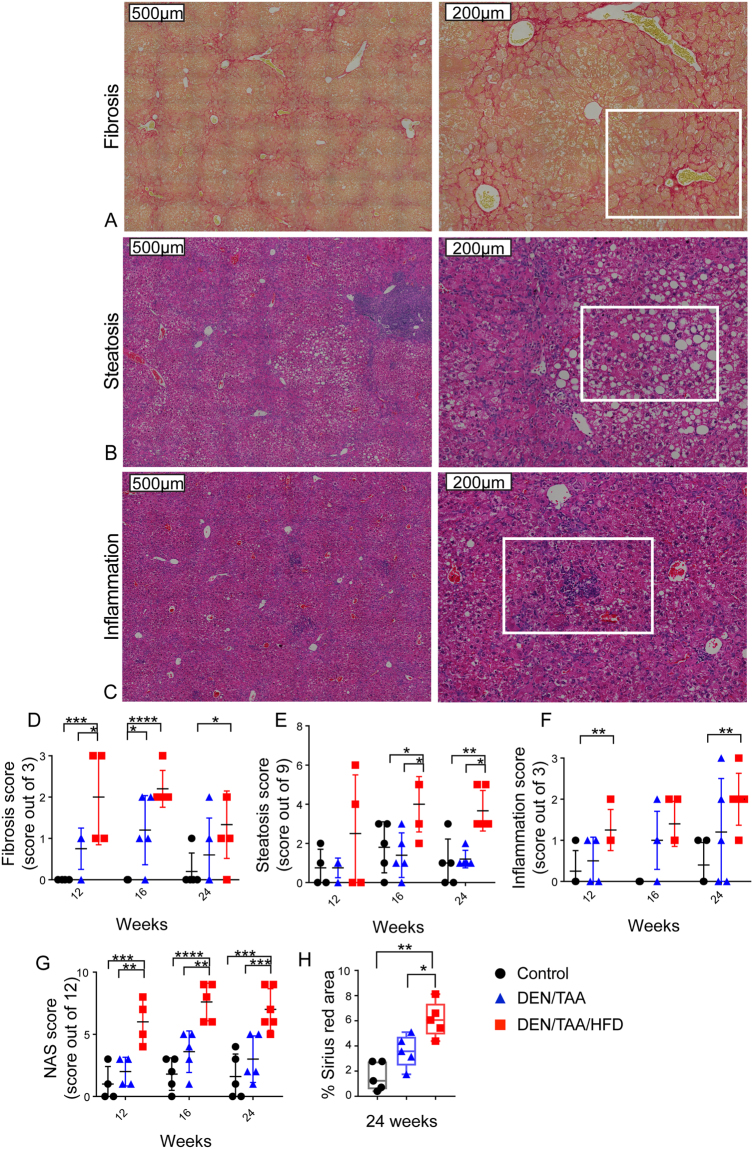
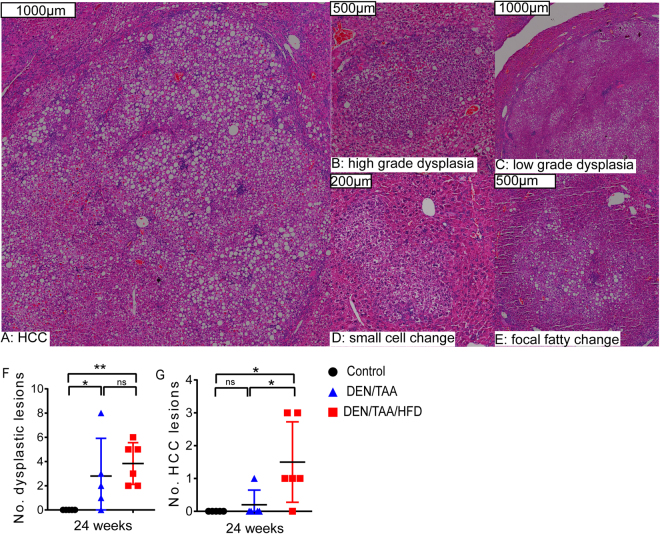
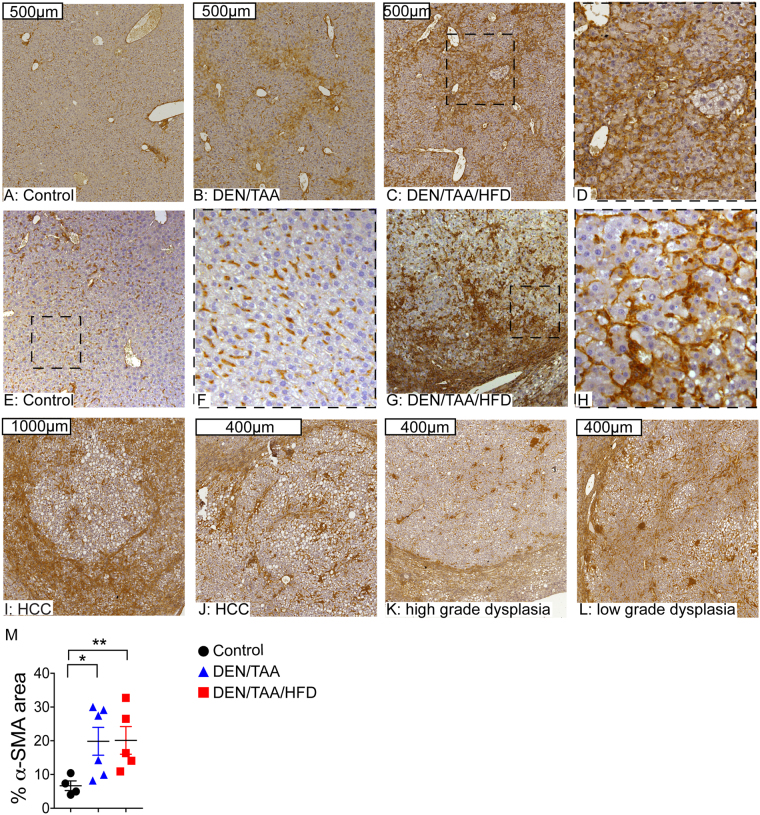
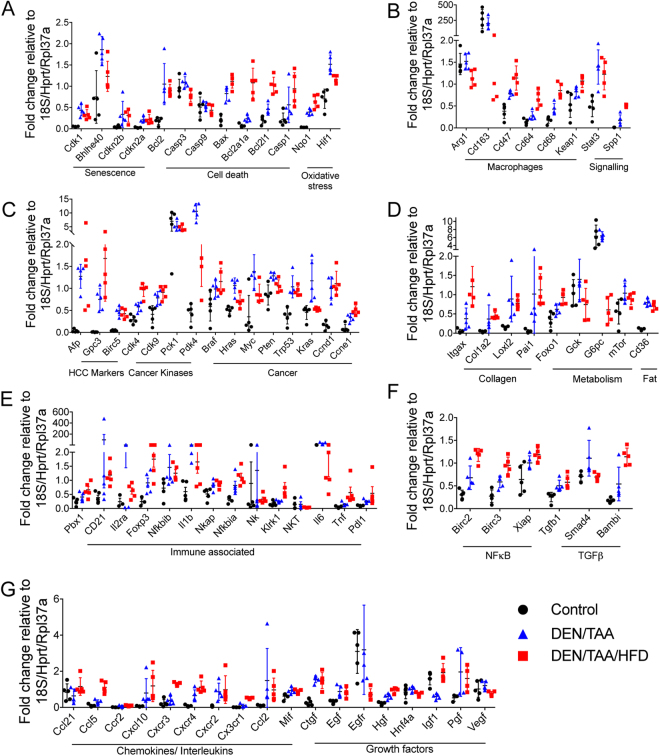
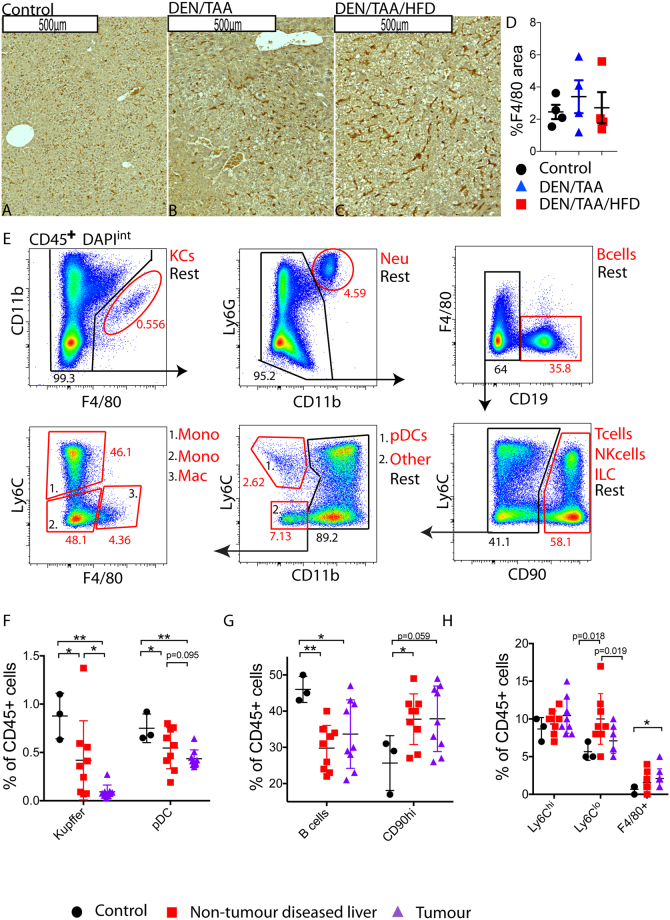
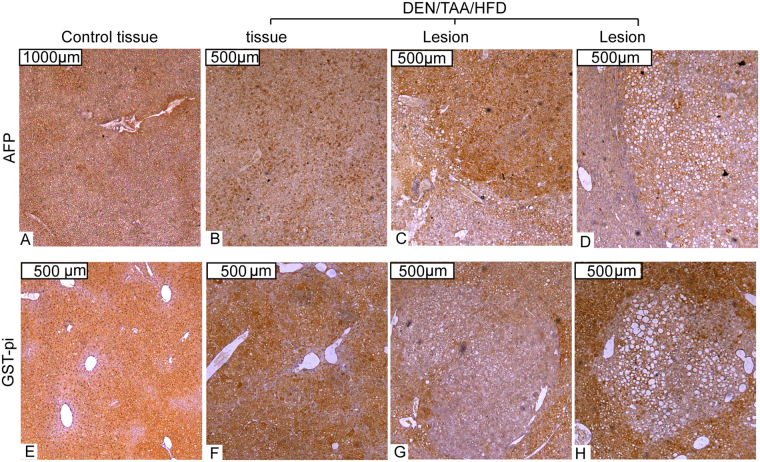
The urgent unmet need for hepatocellular carcinoma (HCC) therapies is addressed here by characterising a novel mouse model of HCC in the context of ongoing liver damage and overnutrition. Male C57Bl/6J mice were treated with diethylnitrosamine (DEN) and thioacetamide (TAA), and some were provided with an atherogenic high fat diet (HFD). Inflammation, steatosis, fibrosis, 87 genes, liver lesions and intratumoural leukocyte subsets were quantified up to 24 weeks of age. Adding HFD to DEN/TAA increased fibrosis, steatosis and inflammation, and the incidence of both HCC and non-HCC dysplastic lesions. All lesions contained α-SMA positive fibroblasts. Macrophage marker F4/80 was not significantly different between treatment groups, but the macrophage-associated genes Arg-1 and Cd47 were differentially expressed. Fibrosis, cancer and cell death associated genes were upregulated in DEN/TAA/HFD livers. Fewer Kupffer cells and plasmacytoid dendritic cells were in tumours compared to control liver. In conclusion, combining a hepatotoxin with an atherogenic diet produced more intrahepatic tumours, dysplastic lesions and fibrosis compared to hepatotoxin alone. This new HCC model provides a relatively rapid means of examining primary HCC and potential therapies in the context of multiple hepatotoxins including those derived from overnutrition.


Conflict of interest statement

The authors declare no competing interests.

Figures

Figure 1
Figure 1
Model of chronic liver injury. (A) Overview of treatments: N-nitrosodiethylamine (DEN; d14)/Thioacetamide (TAA; wk4–24)/High fat diet (HFD; wk4–24), DEN/TAA, and control. (B,C) Mouse body weight at death and liver to body weight ratio. n = 5–6. Mean and SEM. Statistical analysis used Two-way ANOVA with Tukey’s multiple comparison test, *p < 0.05, **p < 0.01, ***p < 0.001, ****p < 0.0001 compared to age-matched control.
Figure 2
Figure 2
Pathological changes in liver. Picro-Sirius red (A) and H&E (B,C) stained liver paraffin sections from a mouse treated with DEN/TAA/HFD. Areas of fibrosis (A), steatosis (B) and inflammatory cell aggregates (C) are boxed with white lines. Histological quantification of fibrosis (D), steatosis (E), inflammatory cell aggregates (F) and NAFLD activity scores (NAS) (G) were performed. Histological quantification of collagen from Sirius red staining of liver from 24-week-old mice (n = 5–6) treated with DEN/TAA/HFD (H). Statistical analysis used two-way ANOVA with Tukey’s multiple comparison test (D–G) or Kruskal-Wallis test (F), *p < 0.05, **p < 0.01, ***p < 0.001, **** p < 0.0001. Scale Bars = 200 μm or 500 μm.
Figure 3
Figure 3
Burden of tumours and other lesions in liver. The types (A–E) and numbers of dysplastic (F) and HCC (G) lesions observed. n = 5–6. Scale Bars = 1000 μm (A,C), 500 μm (B,E) and 200 μm (D). Statistical analysis used one-tailed Mann-Whitney U test, *p < 0.05, **p < 0.01.
Figure 4
Figure 4
α-SMA immunohistochemistry in liver. (A–D) α-SMA immunostaining (brown) and haematoxylin counterstain in control (A), DEN/TAA (B) and DEN/TAA/HFD (C,D) treatment groups. (E–L) Examples of the α-SMA expression in different types of lesions observed in DEN/TAA/HFD treated mice. Boxes formed by black dashes indicate higher magnification of adjacent images. (M) Quantitation of α-SMA immunopositivity by area in the whole liver section. Representative data from 5–6 mice per group. Statistical analysis used Kruskal-Wallis test, *p < 0.05, **p < 0.01. Scale Bars = 400 μm (J–L), 500 μm (A–C), and 1000 μm (I).
Figure 5
Figure 5
Gene expression in liver. Gene expression normalized to housekeepers 18S, Hprt and Rpl37a of individual mice plotted with mean and standard deviation (n = 5 mice per group). Statistical analyses used one-tailed Mann-Whitney U test. Statistical significance is shown in Table 1.
Figure 6
Figure 6
Leukocyte infiltration into HCC in the DEN/TAA/HFD model. (A–C) F4/80 immunostaining (brown) of liver sections, n = 5–6. Scale Bars = 500 μm. (D) Quantitation of F4/80 immunostains (n = 4 mice per group). (E) Clockwise gating strategy from CD45+ live cells, showing putative immune cell populations (sub-population number as % of parent population shown in red, remaining cells shown in black). (F–H) Flow cytometry analysis of immune cell sub-populations (n = 3–12 mice per group). KC; Kupffer cell, Neu; neutrophil, Mono; monocyte, pDC; plasmacytoid dendritic cell, NK; natural killer, ILC; innate lymphoid cell, Mac; non-Kupffer macrophages Ly6Chi; Ly6Chi monocyte, Ly6Clo; Ly6Clo monocyte. Statistical analysis used Kruskal-Wallis test (D), or one-tailed Mann-Whitney test (F–H), *p < 0.05, **p < 0.01.
Figure 7
Figure 7
Cancer Biomarkers. Alpha fetoprotein (AFP) (A–D), and glutathione S-transferase Pi (GST-pi) (E–H) immunostaining (brown) of liver sections of control and DEN/TAA/HFD treated mice. Lesions were identified by encapsulation, increased steatosis, and changes in hepatocyte architecture. Representative data from 4 mice per group. Scale Bars = 500 μm (B–H), 1000 μm (A).

Similar articles

Cited by

References

    1. Alazawi W, Cunningham M, Dearden J, Foster GR. Systematic review: outcome of compensated cirrhosis due to chronic hepatitis C infection. Aliment. Pharmacol. Ther. 2010;32:344–355. doi: 10.1111/j.1365-2036.2010.04370.x. - DOI - PubMed
    1. Llovet JM, et al. Hepatocellular carcinoma. Nat. Rev. Dis. Primers. 2016;2:16018. doi: 10.1038/nrdp.2016.18. - DOI - PubMed
    1. Sakurai T, Maeda S, Chang L, Karin M. Loss of hepatic NF-kappa B activity enhances chemical hepatocarcinogenesis through sustained c-Jun N-terminal kinase 1 activation. Proc. Natl. Acad. Sci. USA. 2006;103:10544–10551. doi: 10.1073/pnas.0603499103. - DOI - PMC - PubMed
    1. Henderson JM, Zhang HE, Polak N, Gorrell MD. Hepatocellular carcinoma: Mouse models and the potential roles of proteases. Cancer Lett. 2016;387:106–113. doi: 10.1016/j.canlet.2016.03.047. - DOI - PubMed
    1. Nakagawa H. Recent advances in mouse models of obesity- and nonalcoholic steatohepatitis-associated hepatocarcinogenesis. World J. Hepatol. 2015;7:2110–2118. doi: 10.4254/wjh.v7.i17.2110. - DOI - PMC - PubMed

Publication types

MeSH terms