. 2018 Nov;12(11):2619-2639.
doi: 10.1038/s41396-018-0208-8. Epub 2018 Jul 6.

Disentangling the drivers of functional complexity at the metagenomic level in Shark Bay microbial mat microbiomes

Affiliations

Disentangling the drivers of functional complexity at the metagenomic level in Shark Bay microbial mat microbiomes

Hon Lun Wong et al. ISME J. 2018 Nov.

Abstract

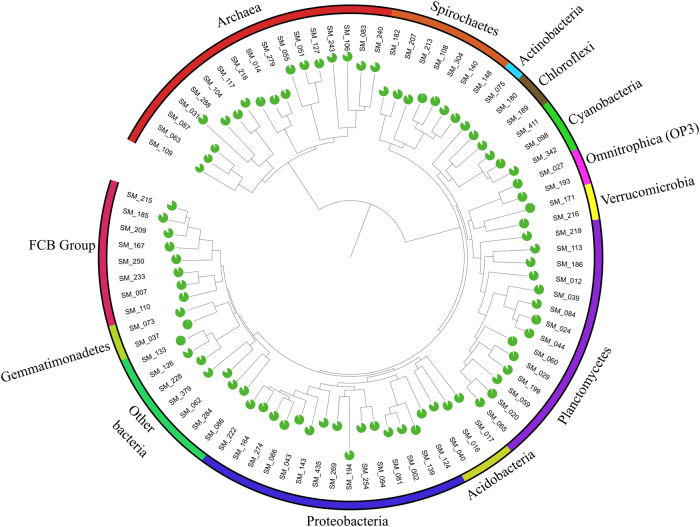
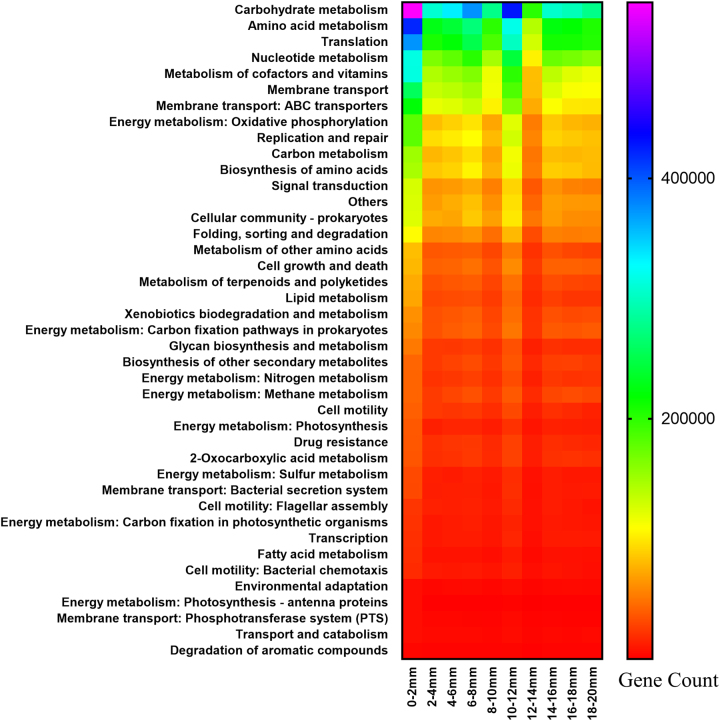
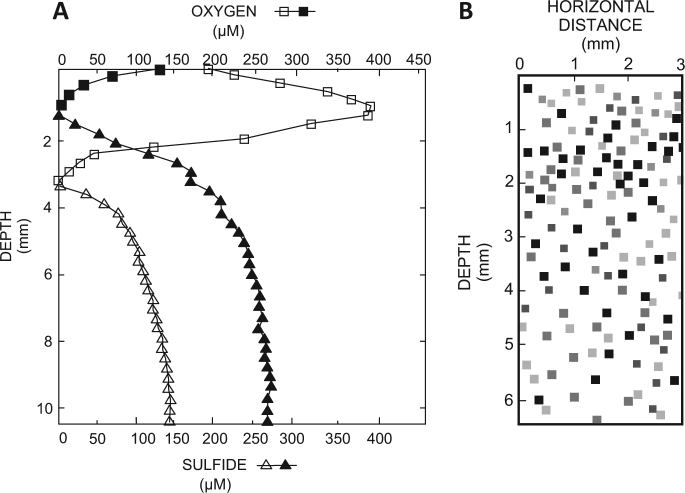
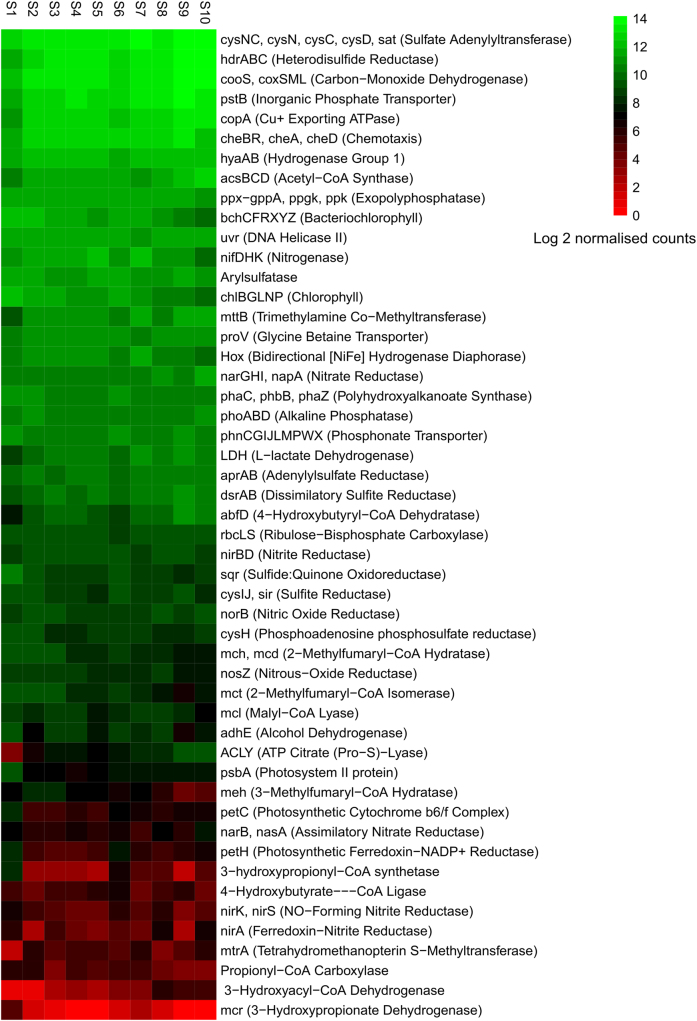
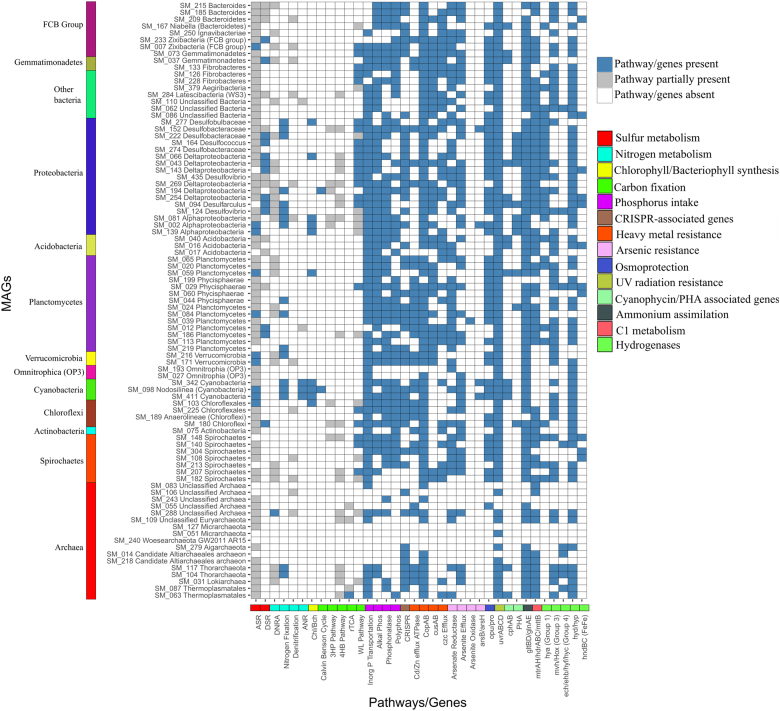
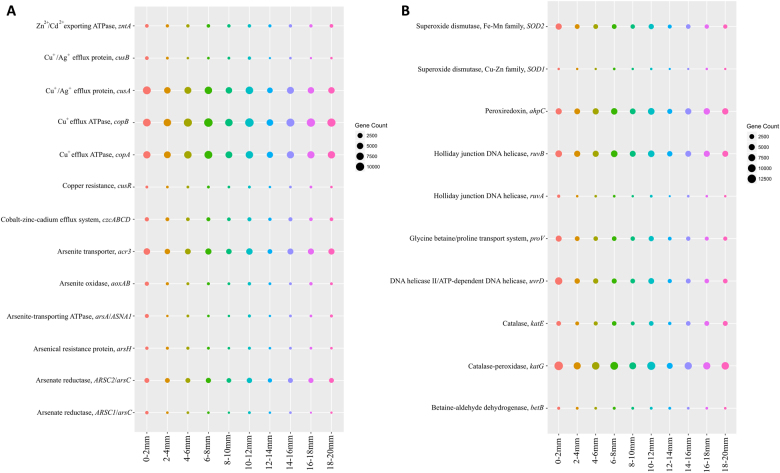
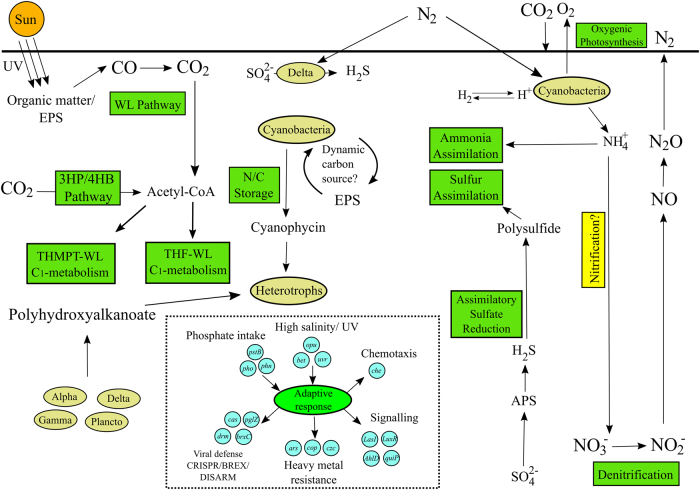
The functional metagenomic potential of Shark Bay microbial mats was examined for the first time at a millimeter scale, employing shotgun sequencing of communities via the Illumina NextSeq 500 platform in conjunction with defined chemical analyses. A detailed functional metagenomic profile has elucidated key pathways and facilitated inference of critical microbial interactions. In addition, 87 medium-to-high-quality metagenome-assembled genomes (MAG) were assembled, including potentially novel bins under the deep-branching archaeal Asgard group (Thorarchaetoa and Lokiarchaeota). A range of pathways involved in carbon, nitrogen, sulfur, and phosphorus cycles were identified in mat metagenomes, with the Wood-Ljungdahl pathway over-represented and inferred as a major carbon fixation mode. The top five sets of genes were affiliated to sulfate assimilation (cysNC cysNCD, sat), methanogenesis (hdrABC), Wood-Ljungdahl pathways (cooS, coxSML), phosphate transport (pstB), and copper efflux (copA). Polyhydroxyalkanoate (PHA) synthase genes were over-represented at the surface, with PHA serving as a potential storage of fixed carbon. Sulfur metabolism genes were highly represented, in particular complete sets of genes responsible for both assimilatory and dissimilatory sulfate reduction. Pathways of environmental adaptation (UV, hypersalinity, oxidative stress, and heavy metal resistance) were also delineated, as well as putative viral defensive mechanisms (core genes of the CRISPR, BREX, and DISARM systems). This study provides new metagenome-based models of how biogeochemical cycles and adaptive responses may be partitioned in the microbial mats of Shark Bay.


Conflict of interest statement

The authors declare that they have no conflict of interest.

Figures

Fig. 1
Fig. 1
Phylogenetic tree of 87 assembled Shark Bay smooth mat microbial metagenome-assembled genomes (MAGs). MAGs assigned to different phyla are highlighted in color, and the estimated completeness of each draft genome is represented by pie charts. SM_103, 152, 180, 194, 225, and 277 were excluded from the tree as coherent taxonomic classification could not be generated from these MAGs using Phylosift (color figure online)
Fig. 2
Fig. 2
Distribution of major functional pathways with depth in Shark Bay smooth mats. These are denoted at KEGG level 3 (defined as any kind of biological reaction and/or gene expression regulation), with the exception of the energy metabolism shown at KEGG level 2 (defined as molecular interactions/protein post-translational modifications). X-axis indicates the different smooth mat layers in 2 mm increments, and y-axis indicates major functional genes/pathways. Scale bar represents gene count as the relative abundance of relevant genes associated with the displayed functions
Fig. 3
Fig. 3
Measurement of key biogeochemical properties in Shark Bay smooth mats. a In situ depth profiles of oxygen and sulfide concentrations. Oxygen and sulfide concentrations were measured during peak photosynthesis (1200–1400 h, open symbols) and the end of the night (0400–0500 h, closed symbols). Multiple profiles (n = 3–7) were measured and representative profiles are shown. Squares represent oxygen, triangles sulfide concentrations. b Two-dimensional distribution of sulfate reduction visualized using the 35S-silver foil technique. Trace near the top of the panels indicates the surface of the mats. Pixels indicate hotspots of sulfate reduction; darker pixels represent higher rates
Fig. 4
Fig. 4
Heatmap of distribution with depth of major functional genes in Shark Bay smooth mats. Differential analysis of count data (given as log2 normalized counts) was obtained using the DESeq2 package in R and used to compare the abundance of genes with depth in the mats. A gradient from green to red indicates gene abundance across mat layers. Green represents genes that are more over-represented and red indicates genes that have the least relative abundance. X-axis indicates the different smooth layers in 2 mm increments (S1, 0–2 mm; S2, 2–4 mm; S3, 4–6 mm; S4, 6–8 mm; S5, 8–10 mm; S6, 10–12 mm; S7, 12–14 mm; S8, 14–16 mm; S9, 16–18 mm; S10, 18–20 mm), and the y-axis the major functional genes identified (color figure online)
Fig. 5
Fig. 5
Color-coded table indicating major functional genes identified and their abundance in Shark Bay smooth mat draft MAGs. X-axis indicates specific genes likely involved in either nutrient cycling or environmental adaptation and y-axis the genome bin designations. Key: blue indicates the complete pathway identified in carbon, sulfur, and nitrogen nutrient cycles, genes present in heavy metal resistance, environmental adaptation, and hydrogenases; gray indicates the partial pathway identified in the carbon, sulfur, and nitrogen nutrient cycles; white indicates genes and pathways that are absent. On the left the color panel correspond to the phyla as shown in Fig. 1. On the right the colors represent different genes and pathways. Abbreviations, ASR assimilatory sulfate reduction, DSR dissimilatory sulfate reduction, ANR assimilatory nitrate reduction, Chl/Bch chlorophyll/bacteriochlorophyll production, 3HP pathway 3-hydroxypropinate pathway, 4HB pathway 4-hydroxybutyrate pathway, rTCAd reverse Krebs cycle, WL pathway Wood–Ljungdahl pathway (color figure online)
Fig. 6
Fig. 6
Heatmap of distribution of genes encoding carbohydrate-active enzymes (CaZY) in Shark Bay smooth mats. Differential analysis of count data (given as log2 normalized counts) was obtained using the DESeq2 package in R and used to compare the abundance of the top most 50 CaZY genes with depth in the mats. Green represents genes that are more over-represented and red indicates genes that have the least relative abundance. X-axis indicates the different smooth layers in 2 mm increments (S1, 0–2 mm; S2, 2–4 mm; S3, 4–6 mm; S4, 6–8 mm; S5, 8–10 mm; S6, 10–12 mm; S7, 12–14 mm; S8, 14–16 mm; S9, 16–18 mm; S10, 18–20 mm), and the y-axis the major functional genes identified. GH glycoside hydrolase, CBM carbohydrate-binding modules, GT glycosyltransferase, PL polysaccharide lyase
Fig. 7
Fig. 7
Bubble plot illustrating traits of environmental adaptation at the metagenomic level in Shark Bay smooth mats delineated with depth. a Distribution of genes related to heavy metal resistance. b Distribution of genes related to hypersalinity, UV radiation, and oxidative stress adaptation. X-axis indicates the different smooth mat layers in 2 mm increments, and y-axis indicates major functional genes/pathways. Circular scale bar represents gene count as relative abundance of genes associated with the displayed functions
Fig. 8
Fig. 8
Schematic illustrating major putative microbial functions and interactions in Shark Bay mats inferred from metagenomic data. Microbial processes that appear to be important in the cycling of major nutrients (carbon, nitrogen, sulfur, phosphorous) and for energy metabolism and adaptation are shown. Major pathways are indicated by rectangles, and organismal groups as ellipses. Putative major metabolisms/pathways are indicated in green, while those in yellow represent pathways where a major gene was not detected in the present study, and is potentially incomplete. Examples of genes identified here putatively associated with a given process are shown in blue circles. Abbreviations: Alpha, Delta and Gamma refer to the corresponding Proteobacterial class; Plancto Planctomycetes, HM hydrogenotrophic methanogens, WL Wood–Ljungdahl pathway, mvh, hdr, mtr, mtt genes associated with methane metabolism, czc cobalt/zinc/cadmium; Cu (copper), As (arsenic) export mechanisms, LasI/Luxr genes associated with signal molecule synthesis/response, AhlD/quiP genes associated with signal molecule degradation, BREX bacteriophage exclusion systems, CRISPR clustered, regularly interspaced, short palindromic repeat systems (color figure online)

References

    1. Dupraz C, Visscher PT. Microbial lithification in marine stromatolites and hypersaline mats. Trends Microbiol. 2005;13:429–38. - PubMed
    1. Allen MA, Goh F, Burns BP, Neilan BA. Bacterial, archaeal and eukaryotic diversity of smooth and pustular microbial mat communities in the hypersaline lagoon of Shark Bay. Geobiology. 2009;7:82–96. - PubMed
    1. Wong HL, Smith DL, Visscher PT, Burns BP. Niche differentiation of bacterial communities at a millimetre scale in Shark Bay microbial mats. Sci Rep. 2015;5:15607. - PMC - PubMed
    1. Burns BP, Goh F, Allen M, Neilan BA. Microbial diversity of extant stromatolites in the hypersaline marine environment of Shark Bay, Australia. Environ Microbiol. 2004;6:1096. - PubMed
    1. Ruvindy R, White RA, III, Neilan BA, Burns BP. Unravelling core microbial metabolisms in the hypersaline microbial mats of Shark Bay using high-throughput metagenomics. ISME J. 2016;10:183–96. - PMC - PubMed

Publication types