. 2018 Dec 15;34(24):4305-4306.
doi: 10.1093/bioinformatics/bty517.

iS-CellR: a user-friendly tool for analyzing and visualizing single-cell RNA sequencing data

Affiliations

iS-CellR: a user-friendly tool for analyzing and visualizing single-cell RNA sequencing data

Mitulkumar V Patel. Bioinformatics. .

Abstract

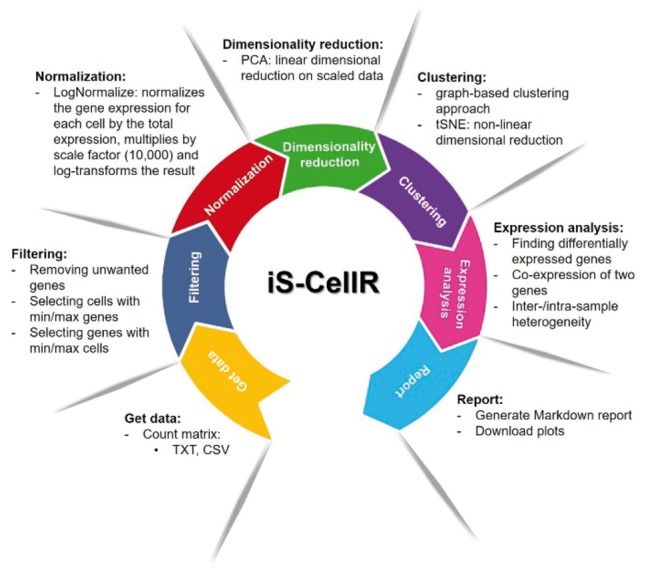
Summary: Interactive platform for single-cell RNA-sequencing (iS-CellR) is a web-based Shiny application that is designed to provide user-friendly, comprehensive analysis of single-cell RNA sequencing data. iS-CellR has the capability to run on any modern web browser and provides an accessible graphical user interface that enables the user to perform complex single-cell RNA-sequencing analysis without requiring programming skills.

Availability and implementation: iS-CellR is open source and available through GitHub at https://github.com/immcore/iS-CellR. iS-CellR is implemented in Docker and can be launched on any operating system with Docker installed.

Supplementary information: Supplementary data are available at Bioinformatics online.


Figures

Fig. 1.
Fig. 1.
iS-CellR pipeline overview. iS-CellR is organized into a seven-step process for complete scRNA-seq analysis. The user can interactively select steps to perform analysis using single-cell data. After uploading, the raw data are filtered and normalized. The normalized data are then subjected to dimensionality reduction for principle component analysis (PCA). Further dimensionality reduction can be performed using t-distributed stochastic neighbour embedding (tSNE). After a clustering step, differentially expressed marker genes can be visualized on cell clusters. The user can also visualize co-expression of two genes simultaneously. Inter-/intra-sample heterogeneity requires the user to upload a file with a list of genes in a two-column format (GeneSet1, GeneSet2). Finally, the user can generate a HTML report containing all results produced or download plots individually

References

    1. DeTomaso D., Yosef N. (2016) FastProject: a tool for low-dimensional analysis of single-cell RNA-Seq data. BMC Bioinformatics, 17, 315. - PMC - PubMed
    1. Diaz A. et al. (2016) SCell: integrated analysis of single-cell RNA-seq data. Bioinformatics, 32, 2219–2220. - PMC - PubMed
    1. Finak G. et al. (2015) MAST: a flexible statistical framework for assessing transcriptional changes and characterizing heterogeneity in single-cell RNA sequencing data. Genome Biol., 16, 278.. - PMC - PubMed
    1. Gardeux V. et al. (2017) ASAP: a web-based platform for the analysis and interactive visualization of single-cell RNA-seq data. Bioinformatics, 33, 3123–3125. - PMC - PubMed
    1. Garvin T. et al. (2015) Interactive analysis and assessment of single-cell copy-number variations. Nat. Methods, 12, 1058–1060. - PMC - PubMed

Publication types