. 2018 Dec 31;122(7):1173-1185.
doi: 10.1093/aob/mcy116.

Are compound leaves more complex than simple ones? A multi-scale analysis

Affiliations

Are compound leaves more complex than simple ones? A multi-scale analysis

Garance Koch et al. Ann Bot. .

Abstract

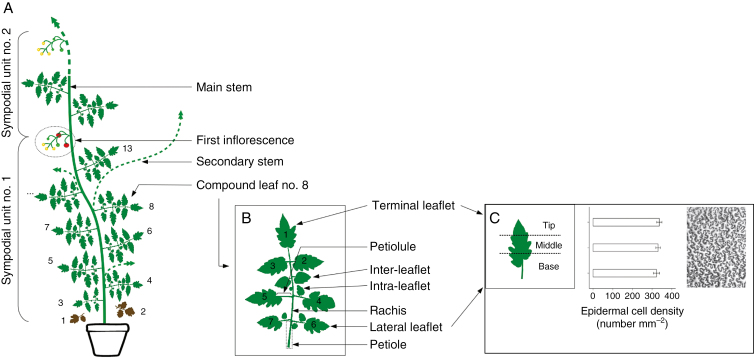
Background and aims: The question of which cellular mechanisms determine the variation in leaf size has been addressed mainly in plants with simple leaves. It is addressed here in tomato taking into consideration the expected complexity added by the several lateral appendages making up the compound leaf, the leaflets.

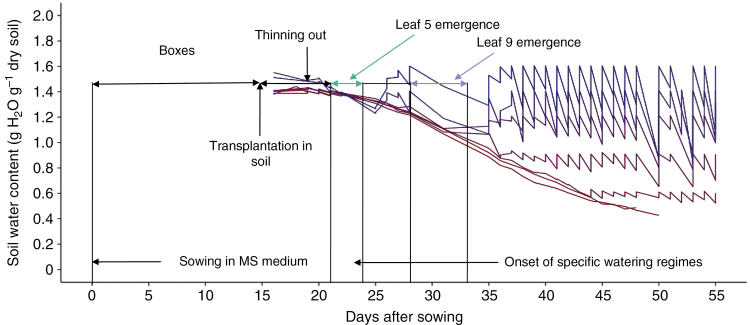
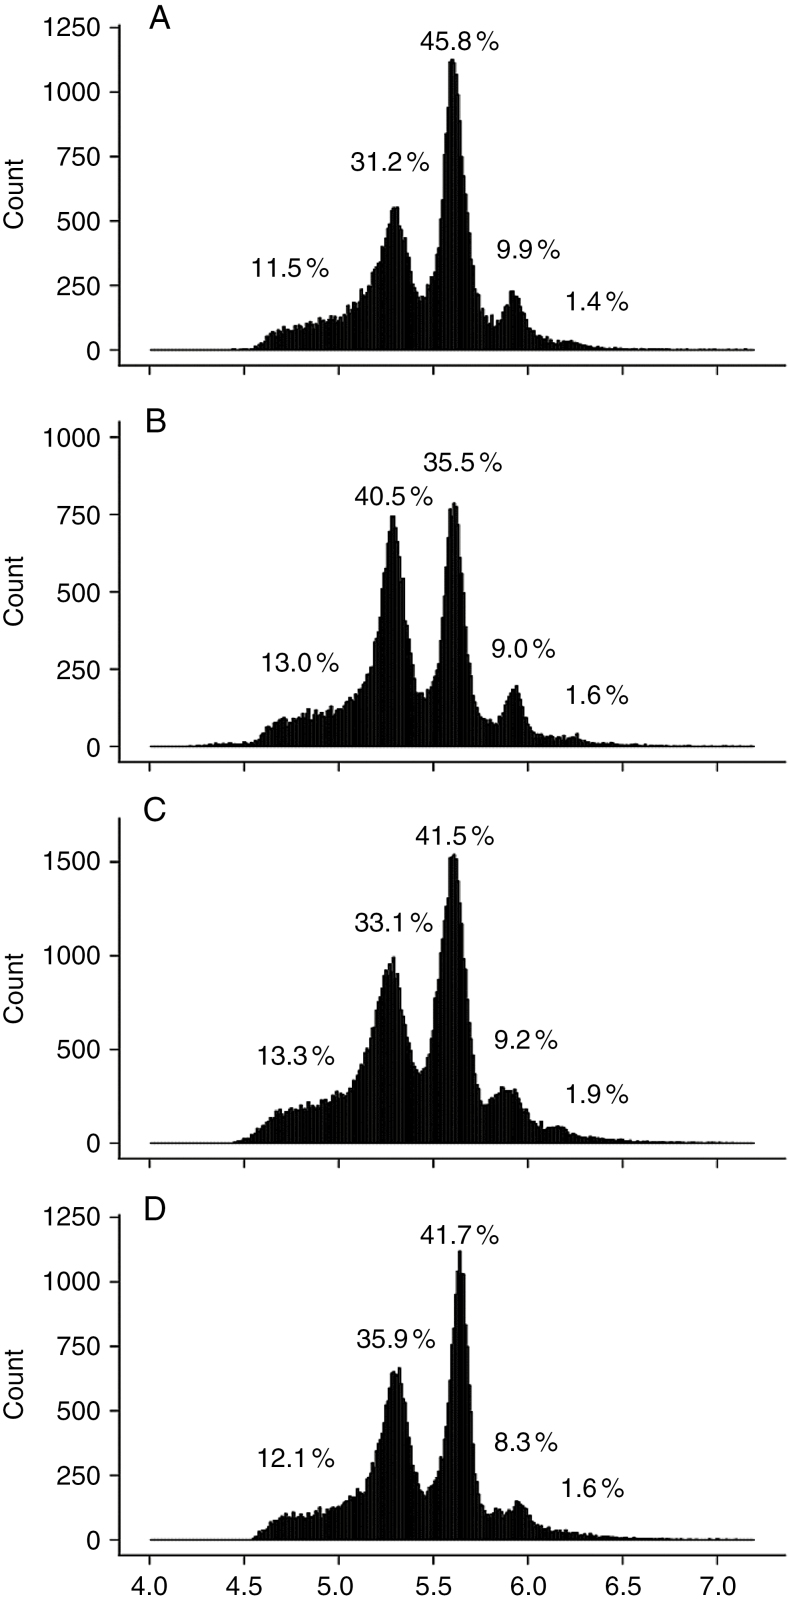
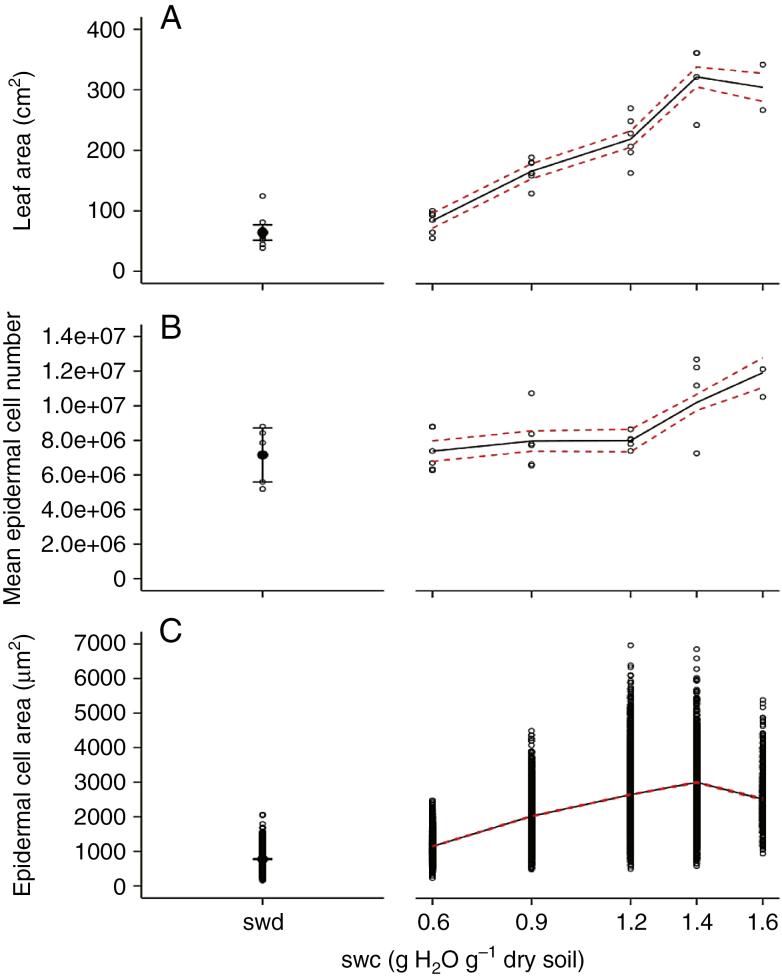
Methods: Leaf and leaflet areas, epidermal cell number and areas, and endoreduplication (co-) variations were analysed in Solanum lycopersicum considering heteroblastic series in a wild type (Wva106) and an antisense mutant, the Pro35S:Slccs52AAS line, and upon drought treatments. All plants were grown in an automated phenotyping platform, PHENOPSIS, adapted to host plants grown in 7 L pots.

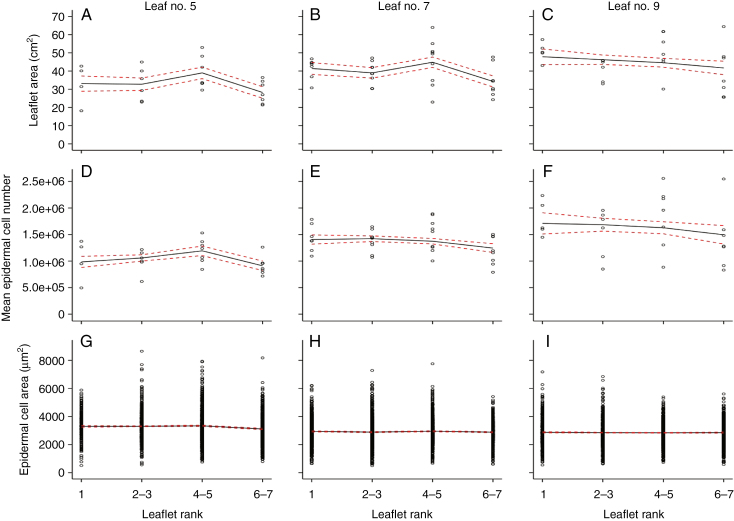
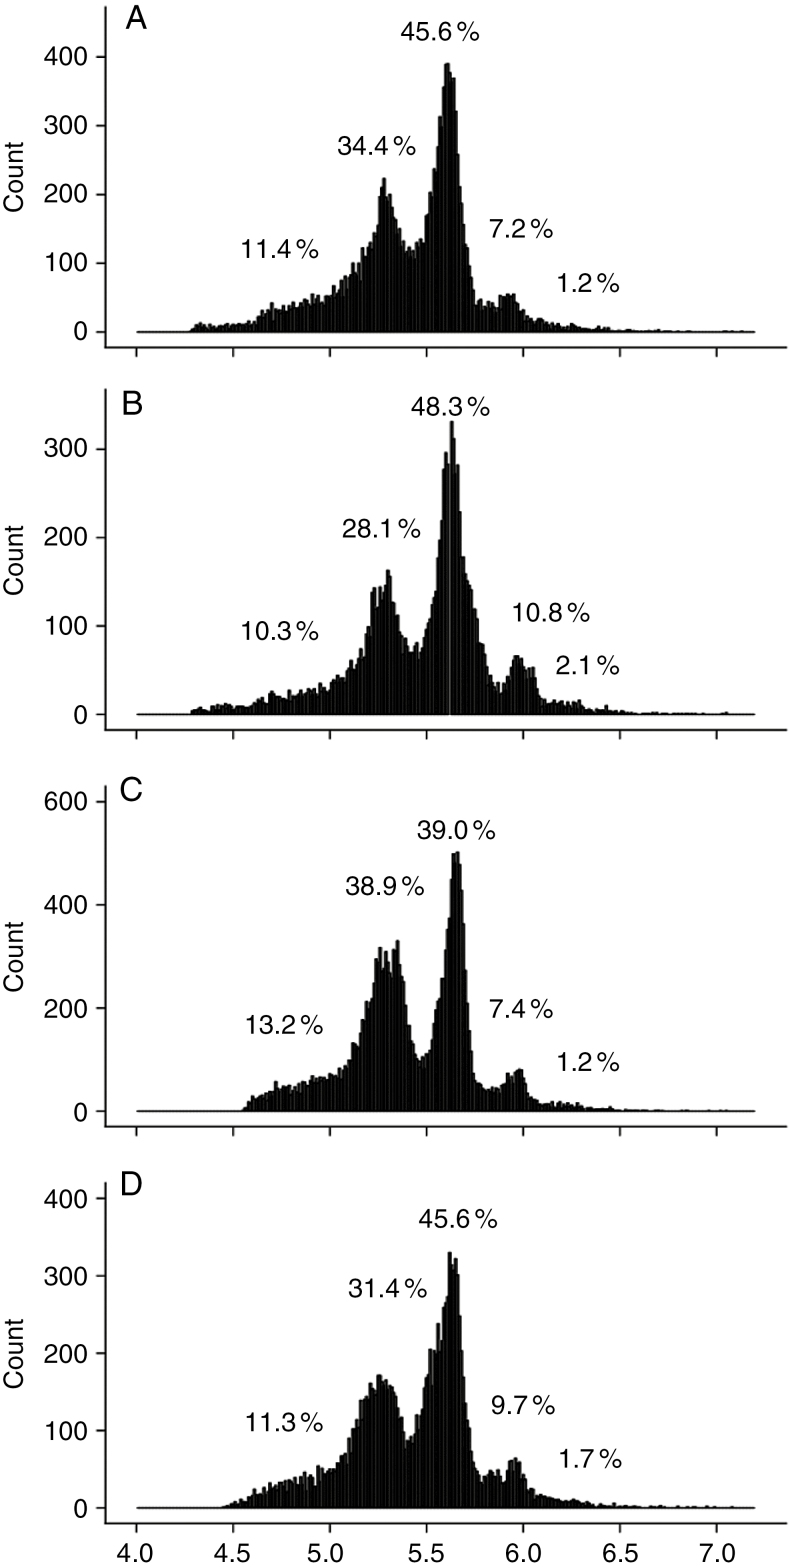
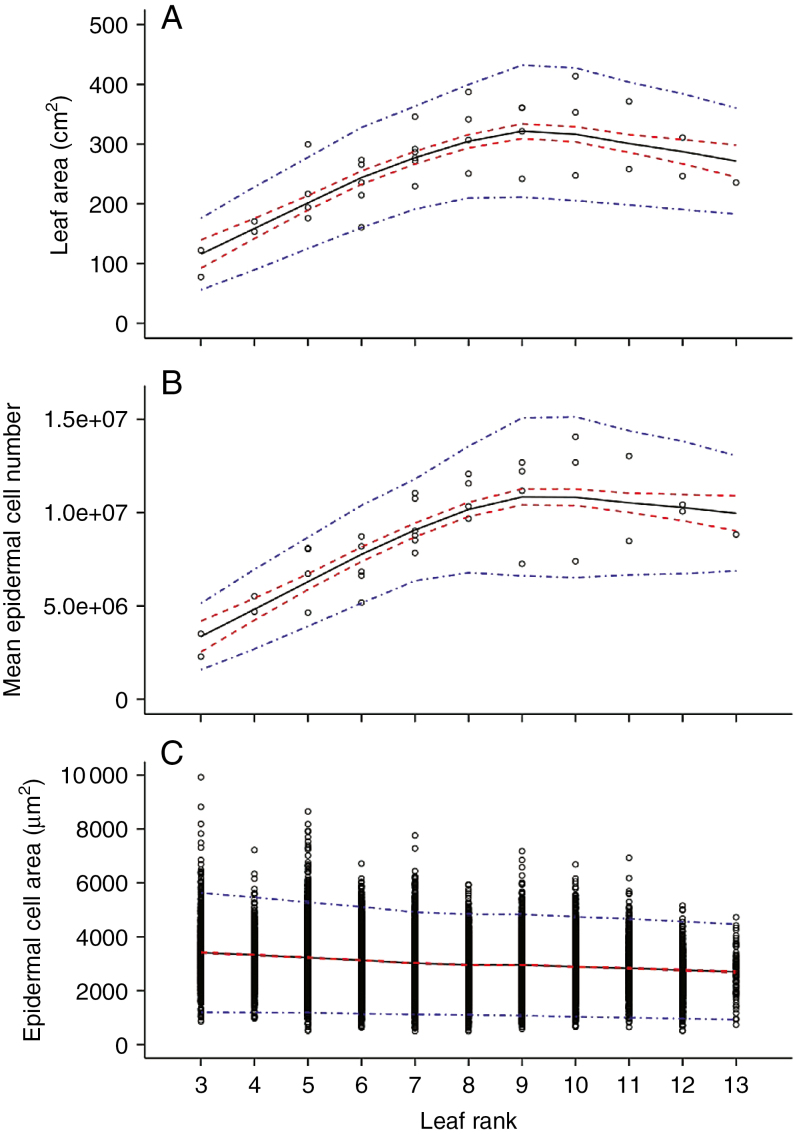
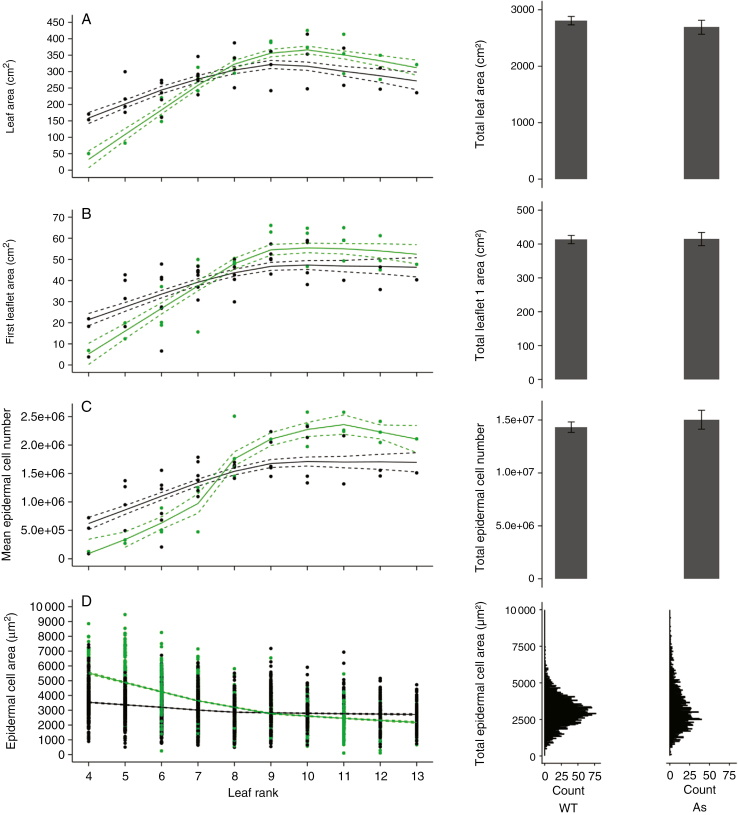
Key results: Leaf area, leaflet area and cell number increased with leaf rank until reaching a plateau. In contrast, cell area slightly decreased and endoreduplication did not follow any trend. In the transgenic line, leaf area, leaflet areas and cell number of basal leaves were lower than in the wild type, but higher in upper leaves. Reciprocally, cell area was higher in basal leaves and lower in upper leaves. When scaled up at the whole sympodial unit, all these traits did not differ significantly between the transgenic line and the wild type. In response to drought, leaf area was reduced, with a clear dose effect that was also reported for all size-related traits, including endoreduplication.

Conclusions: These results provide evidence that all leaflets have the same cellular phenotypes as the leaf they belong to. Consistent with results reported for simple leaves, they show that cell number rather than cell size determines the final leaf areas and that endoreduplication can be uncoupled from leaf and cell sizes. Finally, they re-question a whole-plant control of cell division and expansion in leaves when the Wva106 and the Pro35S:Slccs52AAS lines are compared.


Figures

Fig. 1.
Fig. 1.
Experimental set-up from sowing to harvest. Tomato seeds of Wva106 wild type and of the Pro35S:Slccs52AAS transgenic line were sown in MS medium. Seedlings were grown for 3 weeks in boxes set up in the growth chamber. Two to three young plants were then transplanted into each of the 52 individual pots filled with soil. Pots were irrigated manually for 1 week. Around 17 d after sowing, plants were thinned out to keep one plant per pot and pots were irrigated by the PHENOPSIS automaton to reach a soil water content of 1.4 g H2O g–1 dry soil. All plants were grown at 1.4 g H2O g–1 dry soil until the emergence of the fifth leaf. At this time (represented by a horizontal green line illustrating the variability of dates depending on plant and genotypes), seven specific watering regimes were set up with seven Wva106 plants per watering regime. The three pots of the transgenic Pro35S:Slccs52AAS line were grown at 1.4 g H2O g–1 dry soil only. Among the seven watering regimes, five were stabilized at: 1.6, 1.4, 1.2, 0.9 and 0.6 g H2O g–1 dry soil over time, whereas for the other two regimes, soil water content decreased over time without re-irrigation. These two last treatments were considered together hereafter and called severe water deficit (swd). Treatments are represented by coloured lines with a gradient increasing from the lowest (red) to the highest (blue) soil water content. For each watering regime, data are means of soil water content calculated before and after daily irrigation considering the seven pots in each treatment for Wva106. Depending on plant to plant variability within the same genotype and treatment but also depending on genotypes and drought treatments, leaf 9 emerged between 28 and 33 d after sowing, as shown by the horizontal blue line.
Fig. 2.
Fig. 2.
Layout of the Solanum lycopersicum Wva106 aerial architecture in well-watered conditions. (A) The aerial part is composed of successive sympodial units formed by the main stem and successive compound leaves and inflorescences. The number of compound leaves varies from one sympodial unit to the other. In our experiment, the first sympodial unit bears up to 13 compound leaves. (B) Each compound leaf is attached by a petiole to the main stem and is composed of a rachis with a terminal leaflet (numbered 1) and six other leaflets (lateral leaflets) positioned in pairs on the left and right side of the rachis. Leaflets are attached to the rachis by a petiolule. Inter-leaflets that are smaller than regular leaflets are present between successive pairs of leaflets (attached to the rachis), whereas intra-leaflets of small size are attached to the petiolule of leaflets. Inter- and intra-leaflets were not considered in our study. (C) The absence of a gradient in adaxial epidermal cell area within a mature leaflet was previously tested in three zones from tip to base. Mean epidermal cell density and confidence interval are show for the three zones. A representative image obtained from an imprint of the adaxial epidermis in the middle part of the first leaflet of a mature leaf 8 in well-watered conditions for Wva106 is shown.
Fig. 3.
Fig. 3.
Profiles of leaflet size-related traits in Wva106 plants grown in the well-watered condition. Data are shown for the successive leaflets numbered from 1 to 7 according to their order of emergence along the fifth, sixth and ninth compound leaf (left, middle and right columns, respectively) of the first sympodial unit. Data were pooled for leaflets emerging by pairs (2–3, 4–5 and 6–7) and data for the terminal leaflet are shown alone (see Fig. 2). Each point represents individual leaflet area (A–C), mean epidermal cell number per leaflet (D–F) and epidermal cell area (G–I). Trends (black full lines) of final leaflet area (A–C, 4 < n < 9), mean final epidermal cell number per leaf (D–F, 4 < n < 9) and final epidermal cell area (G–I, 300 < ncell < 675) are shown with confidence intervals (red dashed lines).
Fig. 4.
Fig. 4.
Ploidy level distribution as measured by flow cytometry in mature tomato leaflets of the ninth leaf of the first sympodial unit of Wva106 plants grown in well-watered conditions. Data are shown for leaflets 1 (A), 2 and 3 (B), 4 and 5 (C), and 6 and 7 (D). Each single distribution was obtained by pooling distributions obtained for three different plants. For each distribution, the percentage of nuclei in 2C, 4C, 8C, 16C and 32C is noted on the distributions.
Fig. 5.
Fig. 5.
Profiles of leaf size-related traits considering successive compound leaves of the first sympodial unit in Wva106 plants grown in well-watered conditions. Each point represents the final leaf area (A), mean epidermal cell number per leaf (B) and epidermal cell area distribution (C) that were calculated by pooling all leaflets within each compound leaf. Trends (black full lines) of final leaf area (A, 1 < n < 6), final mean epidermal cell number per leaf (B, 1 < n < 6) and epidermal cell area (C, 525 < ncell < 3150) are shown with confidence intervals (red dashed lines) and prediction intervals (blue dot-dashed lines).
Fig. 6.
Fig. 6.
Ploidy level distribution as measured by flow cytometry in mature tomato leaves considering leaves at rank 4 (A), 6 (B), 8 (C) and 12 (D) on the first sympodial unit of Wva106 plants grown in well-watered conditions. Each single distribution was obtained by pooling distributions of all leaflets within each compound leaf of three different plants. For each distribution, the percentage of nuclei in 2C, 4C, 8C, 16C and 32C is noted on the distributions.
Fig. 7.
Fig. 7.
Profiles of leaf size-related traits considering successive compound leaves of the first sympodial unit in Wva106 (WT; black symbols) and in the transgenic line Pro35S:Slccs52AAS (As; green symbols) grown in well-watered conditions. Each point represents final leaf area (A), first final leaflet area (B), first leaflet mean final epidermal cell number (C) and first leaflet final epidermal cell area (D). Trends (black full lines) of final leaf area (A, 1 < n < 6), final first leaflet area (B, 1 < n < 6), mean final epidermal cell number per leaflet 1 (C, 1 < n < 6) and final epidermal cell area of the first leaflet (D, 1050 < ncell < 3150) are shown with confidence intervals (dashed lines). On the right panels, the mean cumulative leaf area of the first sympodial unit (E), the mean cumulative leaf area of all the first leaflets of the first sympodial unit (F) and the mean cumulative epidermal cell number considering the first leaflets of the first sympodial unit (G) are represented with associated confidence intervals for the two genotypes. The final epidermal cell area distribution considering all leaflets of the first sympodial unit (H) is also shown for the two genotypes.
Fig. 8.
Fig. 8.
Soil water content (swc) dose response of leaf size-related traits in Wva106 plants grown at five different soil water contents: 0.6, 0.9, 1.2, 1.4 and 1.6 g H2O g–1 dry soil and a severe soil water deficit (swd) for which soil water content was never stabilized after cessation of irrigation (this is why the x-axis is broken and soil water content is not quantified by its stable value). Data are shown for the ninth compound leaf of the first sympodial unit. Each point represents final leaf area (A), mean epidermal cell number per leaf (B) and epidermal cell areas (C). They were calculated by pooling all leaflets of each leaf. Trends (black full lines) of final leaf area (A, 3 < n < 6), final mean epidermal cell number per leaf (B, 3 < n < 6) and final epidermal cell area (C, 1575 < ncell < 3150) are shown with confidence intervals (red dashed lines).
Fig. 9.
Fig. 9.
Ploidy level distribution as measured by flow cytometry in mature tomato leaflets of the ninth leaf of the first sympodial unit of Wva106 plants grown in well-watered conditions (A, soil water content of 1.4 g H2O g–1 dry soil), in a moderate soil water deficit treatment (B, soil water content of 0.9 g H2O g–1 dry soil) and in a severe soil water deficit treatment (C, drought without re-irrigation). Each single distribution was obtained by pooling distributions obtained for all leaflets of three different plants. For each distribution, the percentage of nuclei in 2C, 4C, 8C, 16C and 32C is noted on the distributions.

References

    1. Ashby E. 1948. Studies in the morphogenesis of leaves. 2. The area, cell size and cell number of leaves of Ipomoea in relation to their position on the shoot. New Phytologist 47: 177–195.
    1. Autran D, Jonak C, Belcram K, et al. . 2002. Cell numbers and leaf development in Arabidopsis: a functional analysis of the STRUWWELPETER gene. EMBO Journal 21: 6036–6049. - PMC - PubMed
    1. Baerenfaller K, Massonnet C, Walsh S, et al. . 2012. Systems-based analysis of Arabidopsis leaf growth reveals adaptation to water deficit. Molecular Systems Biology 8: 606. doi: 10.1038/msb.2012.39. - DOI - PMC - PubMed
    1. Breuer C, Ishida T, Sugimoto K. 2010. Developmental control of endocycles and cell growth in plants. Current Opinion in Plant Biology 13: 654–660. - PubMed
    1. Champagne C, Sinha N. 2004. Compound leaves, equal to the sum of their parts?Development 131: 4401–4412. - PubMed

Publication types

MeSH terms

LinkOut - more resources