. 2018 Sep 19;46(16):8261-8274.
doi: 10.1093/nar/gky573.

Rpd3L HDAC links H3K4me3 to transcriptional repression memory

Affiliations

Rpd3L HDAC links H3K4me3 to transcriptional repression memory

Bo Bae Lee et al. Nucleic Acids Res. .

Abstract

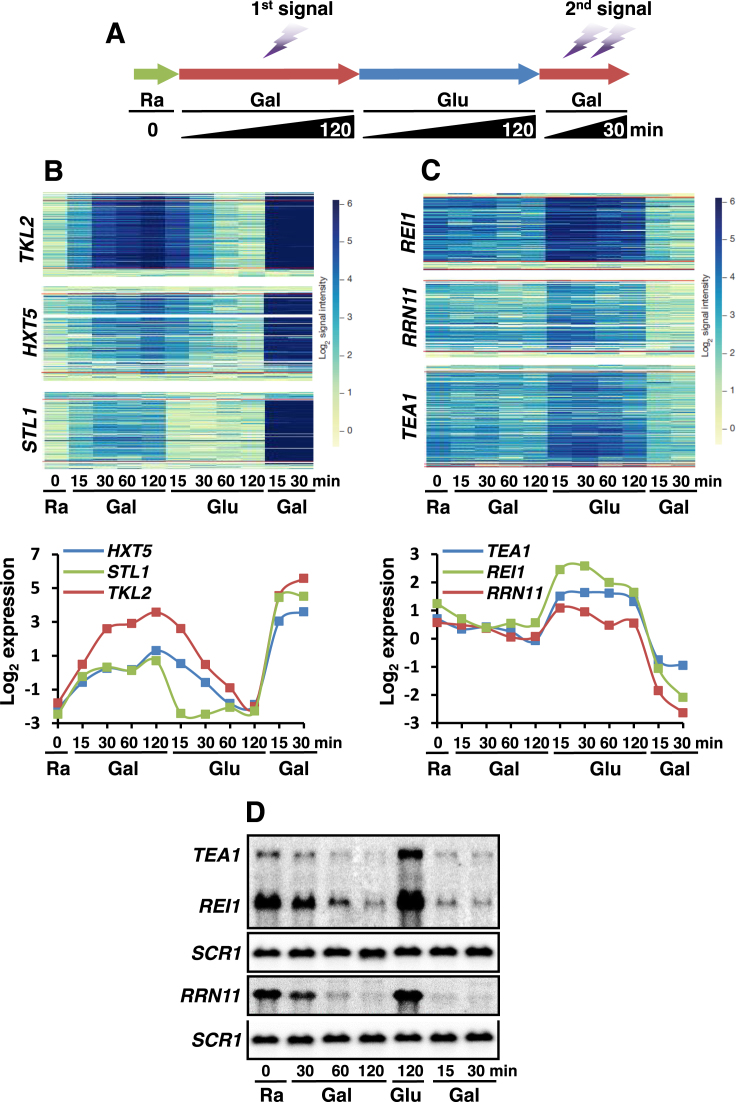
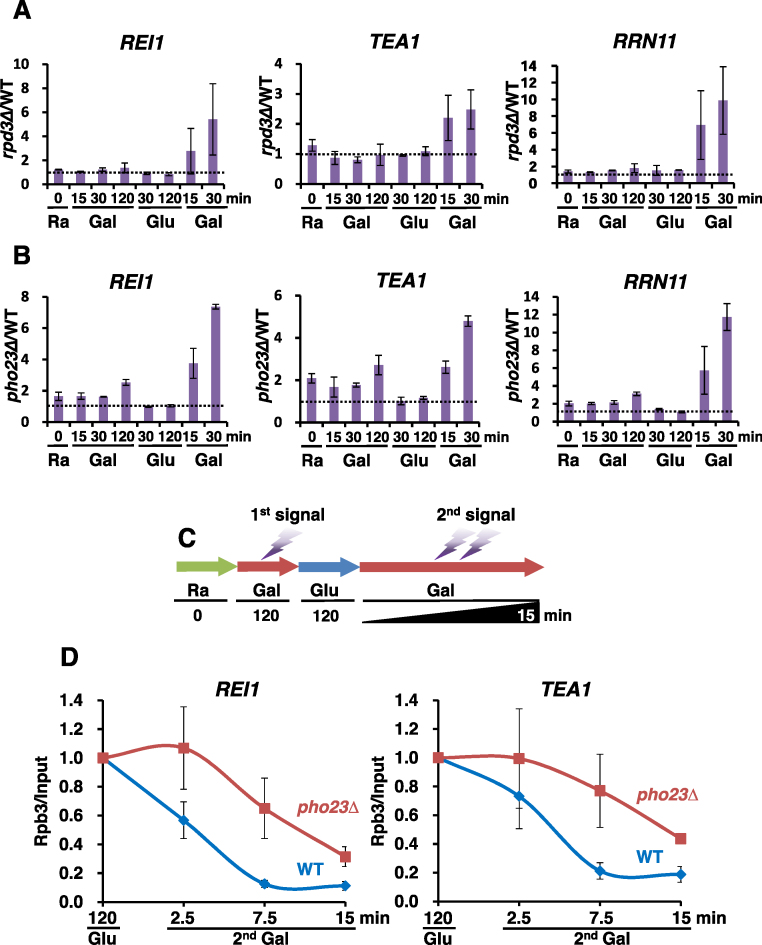
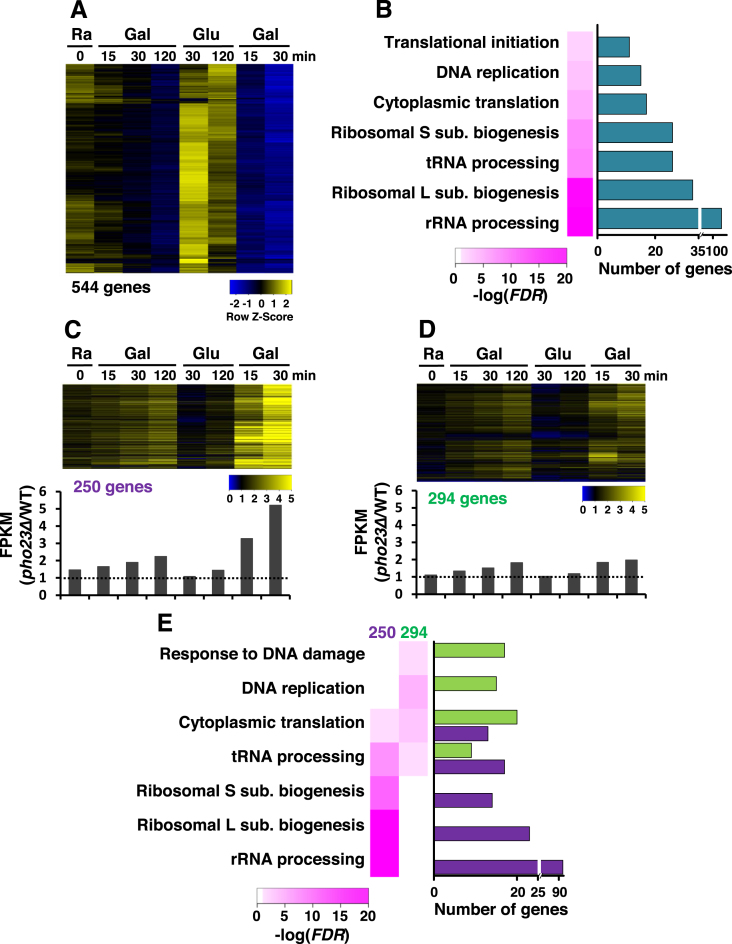
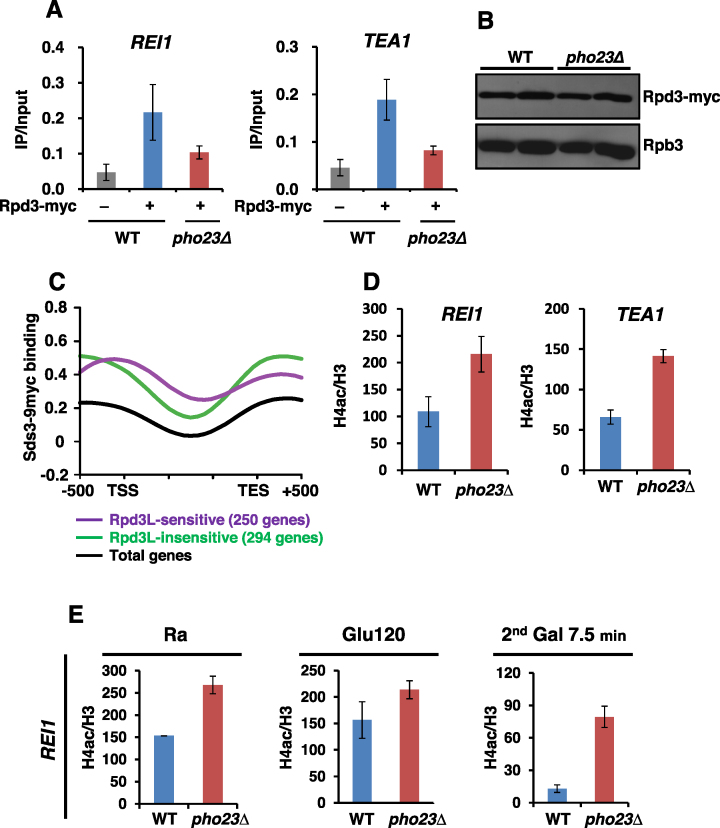
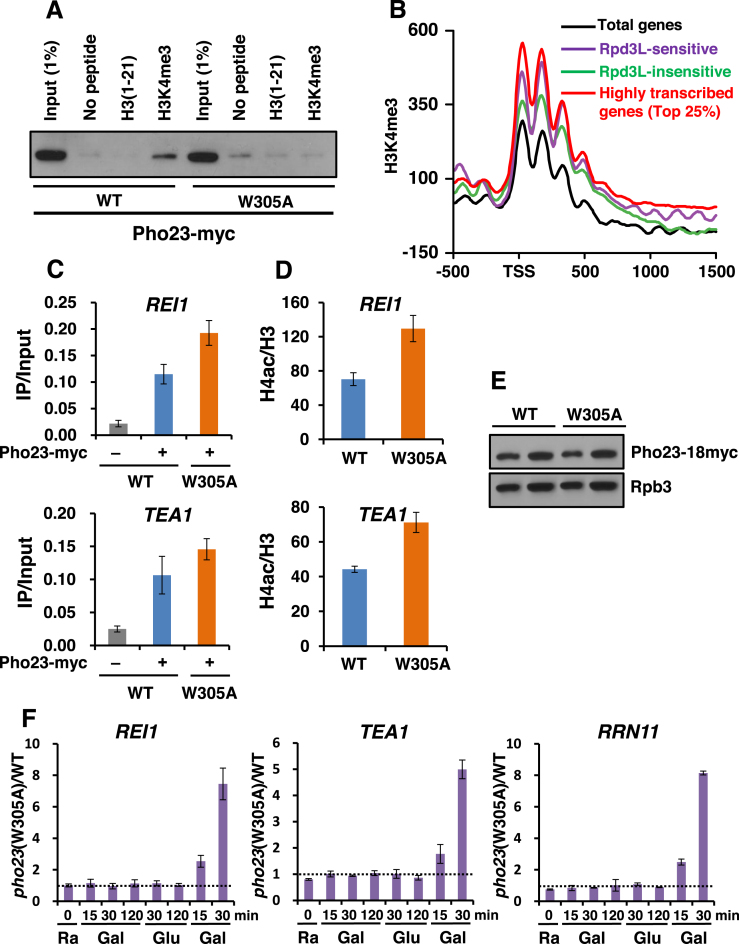
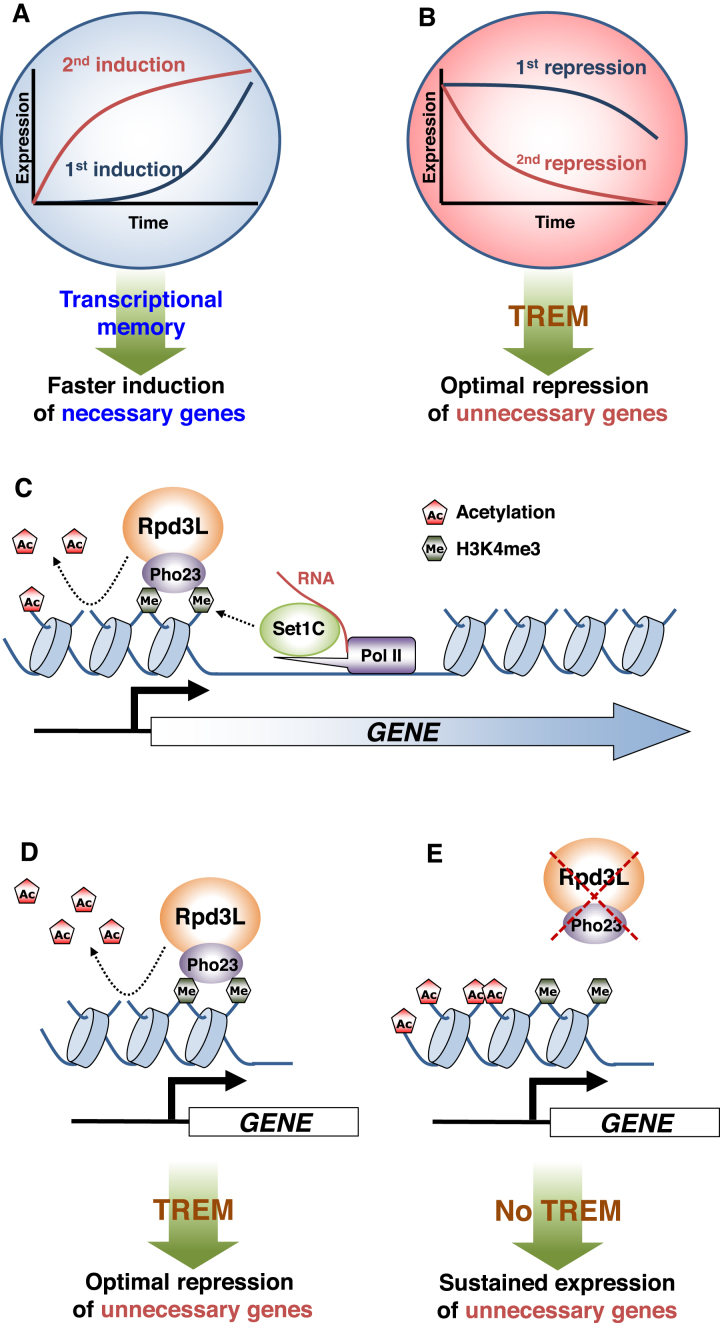
Transcriptional memory is critical for the faster reactivation of necessary genes upon environmental changes and requires that the genes were previously in an active state. However, whether transcriptional repression also displays 'memory' of the prior transcriptionally inactive state remains unknown. In this study, we show that transcriptional repression of ∼540 genes in yeast occurs much more rapidly if the genes have been previously repressed during carbon source shifts. This novel transcriptional response has been termed transcriptional repression memory (TREM). Interestingly, Rpd3L histone deacetylase (HDAC), targeted to active promoters induces TREM. Mutants for Rpd3L exhibit increased acetylation at active promoters and delay TREM significantly. Surprisingly, the interaction between H3K4me3 and Rpd3L via the Pho23 PHD finger is critical to promote histone deacetylation and TREM by Rpd3L. Therefore, we propose that an active mark, H3K4me3 enriched at active promoters, instructs Rpd3L HDAC to induce histone deacetylation and TREM.


Figures

Figure 1.
Figure 1.
Transcriptional activation memory versus transcriptional repression memory. (A) Schematic representation of the time course experiments to monitor changes in transcript levels during carbon-source shifts. (B) Transcriptional activation memory. The microarray hybridization signals for each probe arrayed at positions along the galactose-induced genes, TKL2, HXT5 and STL1 from Kim et al. (33). Increased blue color indicates more transcription. Red lines show the annotated start and stop of the mRNAs. The time course as in (A) is arrayed from left to right. Bottom graph shows normalized, log2-transformed mRNA expression levels at each time point. (C) Transcriptional repression memory. The microarray hybridization signals and log2-transformed expression levels are shown for the three TREM genes, REI1, RRN11 and TEA1 as in (B). (D) Northern blot analyses of the TREM genes, TEA1, REI1 and RRN11 upon carbon-source shifts. Cells were grown in SC-raffinose media and then shifted to galactose, glucose, and then back to galactose media for the indicated times. SCR1 was used for a loading control.
Figure 2.
Figure 2.
Rpd3L induces transcriptional repression memory. (A) RPD3 and rpd3Δ strains were grown in SC medium containing raffinose and then sequentially shifted to SC media containing the indicated carbon sources for the times specified in (A). The mRNA levels were determined by RT-PCR with two independent RNA samples. The ratios of transcript levels in rpd3Δ over those in RPD3 were plotted. The original data appear in Supplementary Figure S2A. Error bars show the standard deviation (S.D.) calculated from two biological replicates, each with three technical replicates. (B) pho23Δ shows a significant delay of TREM. Transcript levels of TREM genes were analyzed as in (B). (C) Schematic representation of the time course experiments to monitor changes in RNA Pol II occupancy at TREM genes during carbon-source shifts. (D) Loss of Pho23 delays dissociation of RNA Pol II. PHO23 and pho23Δ strains were grown in SC medium containing raffinose and then sequentially shifted to SC media containing the indicated carbon sources for the times specified under the graphs. Crosslinked chromatin was precipitated with anti-Rpb3 and PCR analysis of the precipitated DNA was carried out on promoters of REI1 and TEA1. A non-transcribed region near the telomere of chromosome VI was used for an internal control. The signals for Rpb3 were quantitated and normalized to the input signal, and the ratios were graphed. Error bars show the standard deviation (S.D.) calculated from two biological replicates, each with three technical replicates.
Figure 3.
Figure 3.
Rpd3L is required for global TREM. (A) Expression profiles of 544 TREM genes. RNA samples from PHO23 and pho23Δ strains in Figure 2C were analyzed by strand-specific RNA sequencing. The TREM genes identified in PHO23 strains are visualized. (B) GO analysis of TREM genes. The number of genes and false discovery rates (FDRs) obtained from GeneCodis3 (http://genecodis.cnb.csic.es/) showed that many TREM genes are involved in ribosomal RNA processing and ribosomal large or small subunit biogenesis. (C) TREM of 250 genes is significantly delayed in pho23Δ cells. The ratio of transcript levels for 250 genes in pho23Δ over those in PHO23 are visualized. Bottom panel shows the averaged expression ratios at each time point. A strong difference in transcript levels is seen during the second galactose pulse. (D) TREM of 294 genes is not regulated by Pho23. The ratio of transcript levels is shown as in (C). (E) GO analysis of Pho23-sensitive and Pho23-insensitive genes. Whereas Pho23-sensitive genes are enriched for rRNA processing and ribosomal subunit biogenesis, Pho23-insensitive genes are mostly involved in DNA replication and DNA damage response.
Figure 4.
Figure 4.
Rpd3L binds to active promoters to deacetylate histones. (A) Rpd3 binds to promoters of TREM genes. Crosslinked chromatin from the indicated strains grown in SC medium containing glucose was precipitated with an anti-myc antibody. PCR analysis of the precipitated DNA was carried out on the promoter regions of REI1 and TEA1. The signals for Rpd3-myc were quantitated and normalized to the input signal, and the ratios were graphed. Error bars show the S.D. calculated from two biological replicates, each with three technical replicates. (B) Deletion of PHO23 did not affect Rpd3 protein levels. Total proteins extracted from wild type and pho23Δ cells grown in YPD were separated by SDS-PAGE and probed with antibodies indicated on the right. Rpb3 was used as a loading control. (C) Rpd3L occupancy of TREM genes was analyzed using the data sets from Drouin et al. (5). The graph shows the average occupancy of Sds3, a component of Rpd3L, for total genes (black), for 250 Rpd3L-sensitive genes (purple), and for 294 Rpd3L-insensitive genes (green). (D) Rpd3L deacetylates histones at TREM gene promoters. Crosslinked chromatin from the indicated strains grown in SC medium containing glucose was precipitated with anti-H3 or anti-acetyl H4 as indicated. PCR analysis of the precipitated DNA was carried out on the promoters of REI1 and TEA1 as in (A). A non-transcribed region near the telomere of chromosome VI was used for an internal control. The signals for acetyl H4 were quantitated and normalized to the total H3 signal, and the ratios were graphed. Error bars show the standard deviation (S.D.) calculated from two biological replicates, each with three technical replicates. (E) Loss of Pho23 delays deacetylation at the REI1 promoter upon the second galactose incubation. Histone acetylation at the indicated time points was analyzed as in (D).
Figure 5.
Figure 5.
The interaction between the Pho23 PHD finger and H3K4me3 induces deacetylation and TREM. (A) The Pho23 PHD finger binds to H3K4me3. Histone peptide pulldown assays were performed with whole cell extracts expressing Pho23-myc or a PHD finger mutant, pho23W305A-myc, and 1 μg of the indicated histone peptides immobilized on magnetic beads. Precipitated Pho23 protein was analyzed by immunoblot analyses with an anti-myc antibody. (B) H3K4me3 patterns of TREM genes were analyzed using the data sets from Weiner et al., (40). The graph shows the average enrichment of H3K4me3 for total genes (black), for Rpd3L-sensitive genes (purple), for Rpd3L-insensitive genes (green), and for top 25% highly transcribed genes (red). (C) Pho23 occupancy to two TREM genes was analyzed as in Figure 4A. Crosslinked chromatin from the indicated strains grown in SC medium containing glucose was precipitated with an anti-myc antibody. PCR analyses of the precipitated DNA was carried out on the promoter regions of REI1 and TEA1. (D) The interaction between the Pho23 PHD finger and H3K4me3 promotes deacetylation by Rpd3L. Histone H4 acetylation was analyzed as in Figure 4D. (E) A mutation in the Pho23 PHD finger does not affect its protein levels. Total proteins extracted from wild type (WT) and a PHD finger mutant, pho23 (W305A) cells grown in YPD were separated by SDS-PAGE and probed with the antibodies indicated on the right. Rpb3 was used as a loading control. (F) Pho23 binding to H3K4me3 is crucial for TREM. Transcript levels from PHO23 and pho23 (W305A) cells during carbon-source shifts were determined by RT-PCR as in Figure 2B. The ratio of transcript levels in pho23 (W305A) cells over those in PHO23 cells were plotted. Error bars show the standard deviation (S.D.) calculated from two biological replicates, each with three technical replicates.
Figure 6.
Figure 6.
Transcriptional memory and models for regulation of TREM by Rpd3L. (A) When cells are exposed to a stimulus, the genes necessary for cellular functions are induced (first induction). Transcriptional memory upon re-exposure to the same stimulus significantly increases the rate of gene activation (second induction). (B) In contrast, unnecessary genes are repressed by a stimulus (first repression). TREM upon re-exposure to the same stimulus promotes optimal gene repression (second repression). (C) During early stage of transcription, Set1C, also termed Set1/COMPASS, is recruited by RNA Pol II and/or mRNA transcripts to methylate histone H3 at K4. The Pho23 PHD finger binds to H3K4me3 to enhance histone deacetylation by Rpd3L. (D) Hypoacetylation mediated by the Rpd3L–H3K4me3 interaction results in optimal repression of unnecessary genes by TREM. (E) Hyperacetylation by the loss of Rpd3L or by the loss of the Pho23 PHD finger-H3K4me3 interaction result in sustained expression of unnecessary genes.

References

    1. Kouzarides T. Chromatin modifications and their function. Cell. 2007; 128:693–705. - PubMed
    1. Li B., Carey M., Workman J.L.. The role of chromatin during transcription. Cell. 2007; 128:707–719. - PubMed
    1. Carrozza M.J., Li B., Florens L., Suganuma T., Swanson S.K., Lee K.K., Shia W.J., Anderson S., Yates J., Washburn M.P. et al. . Histone H3 methylation by Set2 directs deacetylation of coding regions by Rpd3S to suppress spurious intragenic transcription. Cell. 2005; 123:581–592. - PubMed
    1. Keogh M.C., Kurdistani S.K., Morris S.A., Ahn S.H., Podolny V., Collins S.R., Schuldiner M., Chin K., Punna T., Thompson N.J. et al. . Cotranscriptional set2 methylation of histone H3 lysine 36 recruits a repressive Rpd3 complex. Cell. 2005; 123:593–605. - PubMed
    1. Drouin S., Laramee L., Jacques P.E., Forest A., Bergeron M., Robert F.. DSIF and RNA polymerase II CTD phosphorylation coordinate the recruitment of Rpd3S to actively transcribed genes. PLos Genet. 2010; 6:e1001173. - PMC - PubMed

Publication types

MeSH terms

LinkOut - more resources