. 2018 Aug;7(8):3921-3934.
doi: 10.1002/cam4.1624. Epub 2018 Jul 7.

Spatiotemporal heterogeneity of tumor vasculature during tumor growth and antiangiogenic treatment: MRI assessment using permeability and blood volume parameters

Affiliations

Spatiotemporal heterogeneity of tumor vasculature during tumor growth and antiangiogenic treatment: MRI assessment using permeability and blood volume parameters

Cherry Kim et al. Cancer Med. 2018 Aug.

Abstract

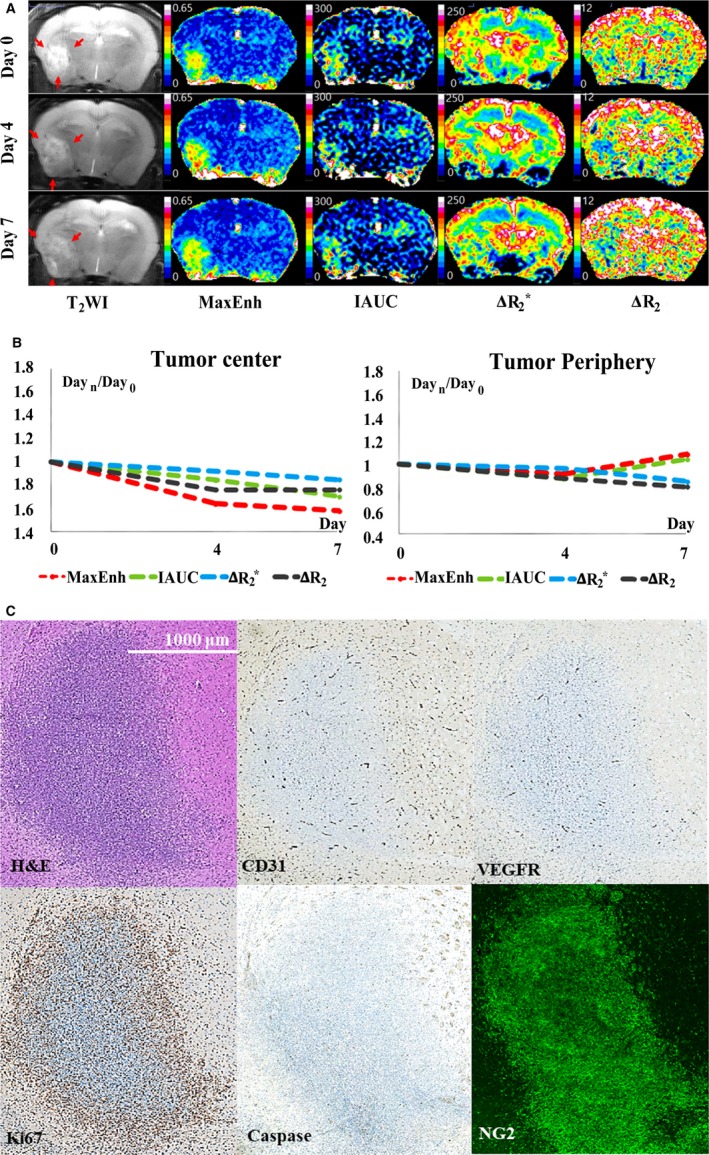
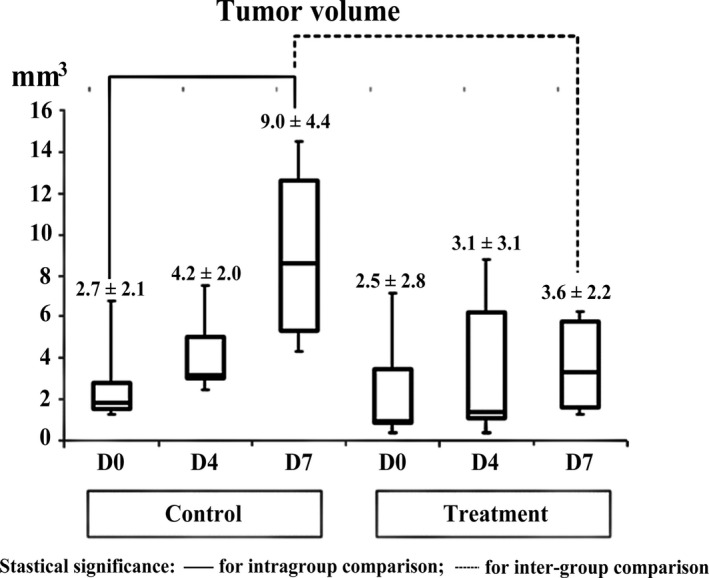
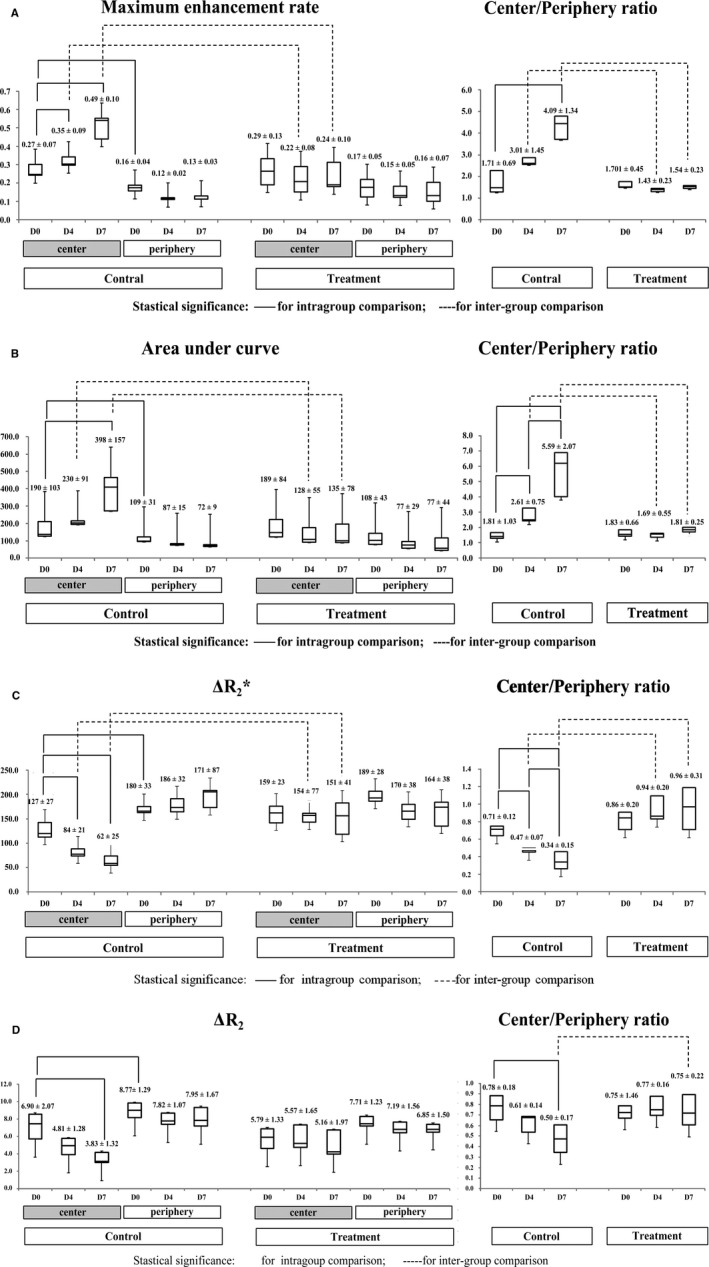
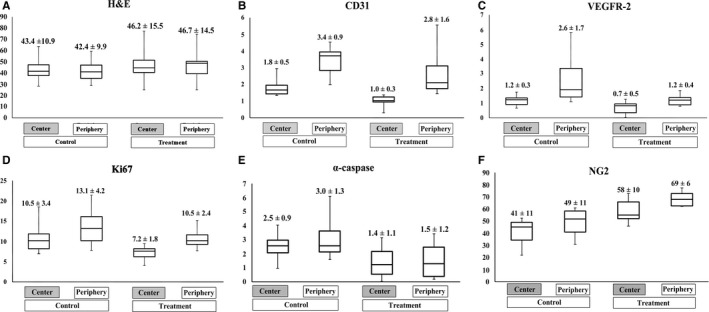
Tumor heterogeneity is an important concept when assessing intratumoral variety in vascular phenotypes and responses to antiangiogenic treatment. This study explored spatiotemporal heterogeneity of vascular alterations in C6 glioma mice during tumor growth and antiangiogenic treatment on serial MR examinations (days 0, 4, and 7 from initiation of vehicle or multireceptor tyrosine kinase inhibitor administration). Transvascular permeability (TP) was quantified on dynamic-contrast-enhanced MRI (DCE-MRI) using extravascular extracellular agent (Gd-DOTA); blood volume (BV) was estimated using intravascular T2 agent (SPION). With regard to region-dependent variability in vascular phenotypes, the control group demonstrated higher TP in the tumor center than in the periphery, and greater BV in the tumor periphery than in the center. This distribution pattern became more apparent with tumor growth. Antiangiogenic treatment effect was regionally heterogeneous: in the tumor center, treatment significantly suppressed the increase in TP and decrease in BV (ie, typical temporal change in the control group); in the tumor periphery, treatment-induced vascular alterations were insignificant and BV remained high. On histopathological examination, the control group showed greater CD31, VEGFR2, Ki67, and NG2 expression in the tumor periphery than in the center. After treatment, CD31 and Ki67 expression was significantly suppressed only in the tumor center, whereas VEGFR2 and α-caspase 3 expression was decreased and NG2 expression was increased in the entire tumor. These results demonstrate that MRI can reliably depict spatial heterogeneity in tumor vascular phenotypes and antiangiogenic treatment effects. Preserved angiogenic activity (high BV on MRI and high CD31) and proliferation (high Ki67) in the tumor periphery after treatment may provide insights into the mechanism of tumor resistance to antiangiogenic treatment.

Keywords: magnetic resonance imaging; spatial heterogeneity; tumor vessels.


Figures

Figure 1
Figure 1
Summary of study results. Magnetic resonance imaging depicts spatial heterogeneity of tumor vascular phenotypes as high transvascular permeability in the tumor center, whereas blood volume was high in the periphery. This pattern became more apparent with tumor growth. The response to antiangiogenic treatment (tyrosine kinase inhibitor) was also heterogeneous according to tumor region, as permeability was predominantly decreased in the tumor center, whereas high blood volume in the periphery was preserved. This MRI findings can be histologically interpreted as treatment‐induced vascular normalization (ie, decreased apoptosis and increased pericyte volume) in the tumor center, whereas high VEGFR2, CD31, and NG2 in tumor periphery support MRI findings of high blood volume in the tumor periphery
Figure 2
Figure 2
Magnetic resonance imaging and histopathology results in a representative control mouse. A, T2‐weighted imaging (T2 WI) and vascular parameters. T2 WI demonstrated tumor growth from day 0 to day 7. Color maps of vascular parameters demonstrate apparent spatial heterogeneity in the distribution of vascular parameters. Maximum enhancement rate (MaxEnh) and initial area under the curve (IAUC) (ie, indicators of transvascular permeability) are higher in the tumor center than in the tumor periphery. In contrast, ΔR2* and ΔR2 (ie, indicators of blood volume) are higher in the tumor periphery than in the tumor center. This spatial heterogeneity of vascular phenotypes becomes stronger from day 0 to day 7. B, Plots of time‐dependent relative changes in vascular parameters (ie, parameterday n/day 0). MaxEnh and IAUC increased in the tumor center, but not in the periphery. ΔR2* and ΔR2 tended to decrease in the tumor center, but maintained at initial value in the periphery. C, On histopathological examination, the tumor periphery exhibits higher expression of CD31, VEGFR‐2, and Ki67 than the tumor center, thereby indicating spatial heterogeneity in the activity of angiogenesis and cell proliferation
Figure 3
Figure 3
Magnetic resonance imaging and histopathology results in a representative treatment mouse. A, T2‐weighted imaging (T2 WI) and vascular parameters. T2 WI demonstrates treatment‐induced suppression of tumor growth, compared with control mice (see Figure 1A). Color maps of vascular parameters demonstrate apparent spatial heterogeneity in treatment effect within the tumor. Significant treatment‐induced vascular alterations are identified predominantly in the tumor center. Compared with the control group, in the tumor center, antiangiogenic treatment significantly suppressed the increase in transvascular permeability (maximum enhancement rate [MaxEnh] and initial area under the curve [IAUC]) and the decrease in blood volume (ΔR2* and ΔR2) during the follow‐up period, which are typical temporal changes in control mice (see Figure 1A,B). B, Plots of time‐dependent relative changes in vascular parameters (ie, Parameterday n/day 0). Due to significant antiangiogenic treatment effect in the tumor center, treatment mouse exhibits significantly lower MaxEnh and IAUC and higher ΔR2* in the tumor center than the control mouse (see Figure 2A,B). In contrast to the tumor center, the tumor periphery exhibits no obvious difference between control and treatment mice. In particular, high ΔR2* and ΔR2 maintained at the initial value in tumor periphery during follow‐up period. C, CD31 and Ki67 staining demonstrates spatial heterogeneity in the effect of antiangiogenic treatment, as their expression is suppressed predominantly in the tumor center, whereas the tumor periphery preserves active expression (see Figure 1C). VEGFR2 expression is apparently decreased in both the tumor center and periphery compared with a control mouse (see Figure 2C)
Figure 4
Figure 4
Comparison of tumor volume change between control and treatment mice. Although tumor volume on day 0 was similar between the two groups, the control group revealed statistically significant tumor growth from day 0 to day 7. Accordingly, the control group showed significantly greater tumor volume than the treatment group on day 7. Statistical significance was marked with solid line for intra‐group comparison and with dotted line for intergroup comparison
Figure 5
Figure 5
Spatiotemporal analysis of tumor vascular phenotypes. Statistically significant differences are indicated by solid lines (intra‐group comparisons) and dashed lines (intergroup comparisons). A and B, Temporal changes and center‐to‐periphery ratios of maximum enhancement rate (MaxEnh) (A) and initial area under the curve (IAUC) (B). The initial magnetic resonance image day 0 revealed higher MaxEnh and IAUC in the tumor center than in the periphery. With tumor growth in the control group, both parameters increased in the tumor center and similarly maintained in the tumor periphery, thereby demonstrating tendencies toward increasing center‐to‐periphery ratios. Antiangiogenic treatment suppressed such temporal changes only in the tumor center but not in the periphery. Consequently, the treatment group exhibits lower MaxEnh and IAUC in the tumor center than in the control group. C and D, Temporal changes and center‐to‐periphery ratios of ΔR2* (C) and ΔR2 (D). On day 0, both groups demonstrated higher ΔR2* and ΔR2 in the tumor periphery than in the center. With tumor growth in the control group, both parameters demonstrated a tendency toward decrease in the tumor center from day 0 to day 7, whereas being similar in the tumor periphery. These changes demonstrated a strong tendency toward decreasing ΔR2*center/periphery with tumor growth. Antiangiogenic treatment suppressed such temporal changes in control mice. Consequently, the treatment group demonstrated higher center‐to‐periphery ratios of ΔR2*(day 4 and 7) and ΔR2 (day 7) than in the control group
Figure 6
Figure 6
Spatial analysis of histologic study. Box‐and‐Whisker graphs demonstrate the region‐oriented comparison of cell density on hematoxylin‐eosin staining (A), vascular density on CD31 staining (B), angiogenic activity on VEGFR2 staining (C), proliferation activity on Ki67 staining (D), apoptosis on α‐caspase 3 staining (E), and amount of pericyte on NG2 staining (F). The control group demonstrated higher expression of CD31, VEGFR2, Ki67, and NG2 in the tumor periphery than in the center, whereas the cell density was not spatially different. Antiangiogenic treatment yielded significant suppression of CD31 and Ki67, predominantly in the tumor center, whereas the tumor periphery showed no significant treatment effect. VEGFR2 and α‐caspase 3 expression demonstrated apparent treatment‐induced decrease in both the tumor center and periphery. NG2 expression exhibited significant treatment‐driven increase in both the tumor center and periphery

References

    1. Gerlinger M, Rowan AJ, Horswell S, et al. Intratumor heterogeneity and branched evolution revealed by multiregion sequencing. N Engl J Med. 2012;366:883‐892. - PMC - PubMed
    1. Nakasone ES, Askautrud HA, Kees T, et al. Imaging tumor‐stroma interactions during chemotherapy reveals contributions of the microenvironment to resistance. Cancer Cell. 2012;21:488‐503. - PMC - PubMed
    1. Marusyk A, Almendro V, Polyak K. Intra‐tumour heterogeneity: a looking glass for cancer? Nat Rev Cancer. 2012;12:323‐334. - PubMed
    1. Nagy JA, Dvorak HF. Heterogeneity of the tumor vasculature: the need for new tumor blood vessel type‐specific targets. Clin Exp Metastasis. 2012;29:657‐662. - PMC - PubMed
    1. Nagy JA, Chang SH, Shih SC, Dvorak AM, Dvorak HF. Heterogeneity of the tumor vasculature. Semin Thromb Hemost. 2010;36:321‐331. - PMC - PubMed

Publication types

MeSH terms

LinkOut - more resources