. 2018 Jul 19;71(2):244-255.e5.
doi: 10.1016/j.molcel.2018.06.001. Epub 2018 Jul 5.

Mettl1/Wdr4-Mediated m7G tRNA Methylome Is Required for Normal mRNA Translation and Embryonic Stem Cell Self-Renewal and Differentiation

Affiliations

Mettl1/Wdr4-Mediated m7G tRNA Methylome Is Required for Normal mRNA Translation and Embryonic Stem Cell Self-Renewal and Differentiation

Shuibin Lin et al. Mol Cell. .

Abstract

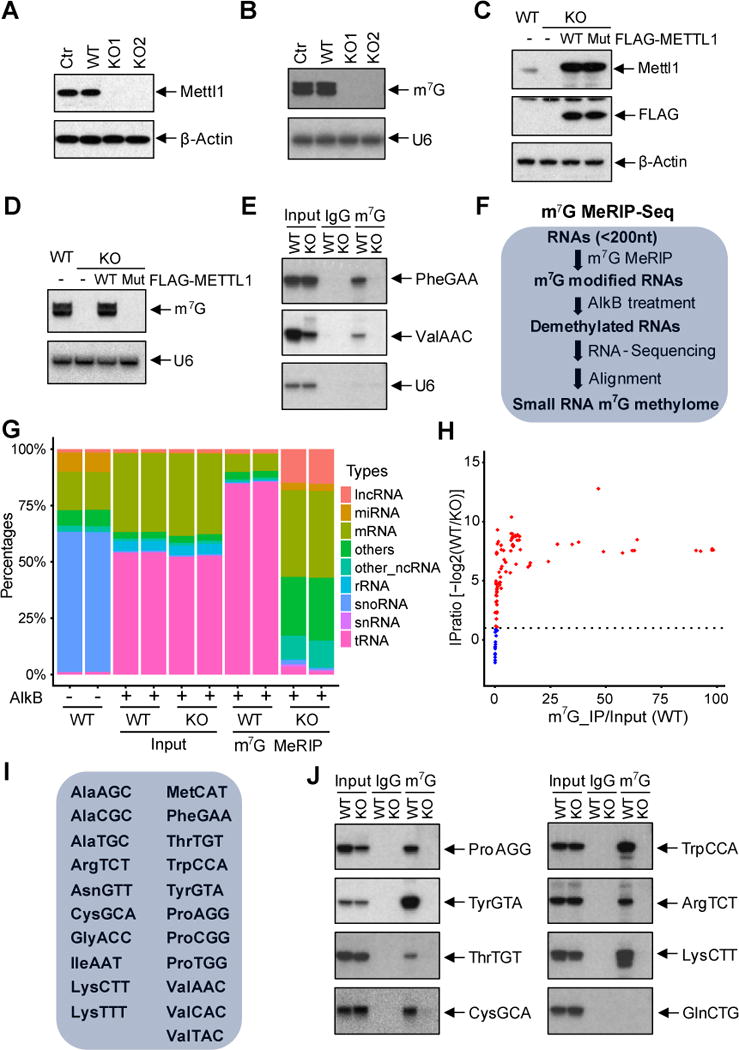
tRNAs are subject to numerous modifications, including methylation. Mutations in the human N7-methylguanosine (m7G) methyltransferase complex METTL1/WDR4 cause primordial dwarfism and brain malformation, yet the molecular and cellular function in mammals is not well understood. We developed m7G methylated tRNA immunoprecipitation sequencing (MeRIP-seq) and tRNA reduction and cleavage sequencing (TRAC-seq) to reveal the m7G tRNA methylome in mouse embryonic stem cells (mESCs). A subset of 22 tRNAs is modified at a "RAGGU" motif within the variable loop. We observe increased ribosome occupancy at the corresponding codons in Mettl1 knockout mESCs, implying widespread effects on tRNA function, ribosome pausing, and mRNA translation. Translation of cell cycle genes and those associated with brain abnormalities is particularly affected. Mettl1 or Wdr4 knockout mESCs display defective self-renewal and neural differentiation. Our study uncovers the complexity of the mammalian m7G tRNA methylome and highlights its essential role in ESCs with links to human disease.

Keywords: MeRIP-seq; Mettl1; N(7)-methylguanosine; RNA methylation; TRAC-seq; Wdr4; embryonic stem cells; m(7)G; neural development; tRNA; translation.


Conflict of interest statement

DECLARATION OF INTERESTS

The authors declare no competing interests

Figures

Figure 1
Figure 1. Global profiling of tRNA m7G modifications by m7G MeRIP-Seq
(A) Western blot of the control and Mettl1 KO samples with indicated antibodies. (B) Anti-m7G Northwestern blot of m7G modifications (Upper panel). RNA samples were separated on a TBE-urea gel, then transferred to nylon membrane for Western blotting using anti-m7G antibody. Northern blot of U6 snRNA was used a loading control (Lower panel). (C) Western blot of the METTL1 rescue samples with indicated antibodies. (D) Anti-m7G Northwestern blot of m7G modifications (Upper panel) and Northern blot of U6 snRNA (Lower panel). (E) Small RNA Northern blot of the anti-m7G IP products with indicated probes. (F) Schematic diagram of small RNA m7G MeRIP-seq to identify the m7G methylome. Small RNAs were isolated and treated with Alkb to remove modifications and then used for cDNA library construction. (G) Population of small RNA mapping in m7G MeRIP-Seq. Samples without Alkb treatment (Alkb-) were used as controls. n=2. (H) Scatter plot of tRNA relative enrichment of tRNA in m7G MeRIP-Seq. Relative enrichment was calculated by comparing the IP/Input ratio in the WT samples to the KO samples. (I) List of m7G modified tRNAs identified by m7G MeRIP-Seq. (J) Confirmation of m7G modified tRNAs by anti-m7G IP and Northern blot with indicated probes. No m7G modification was identified in GlnCTG, which was used as a control.
Figure 2
Figure 2. Single nucleotide resolution mapping of m7G modifications by m7G TRAC-Seq
(A) Schematic diagram of tRNA reduction and cleavage at m7G sites. RNA samples were treated with NaBH4 and aniline to induce the site-specific cleavage of RNA at m7G modified guanosines. (B) Northern blot of the chemical treated RNA samples with indicated probes. (C) Schematic diagram of the m7G TRAC-Seq. (D) Representative images of reads alignment to indicated tRNAs in the Integrative Genomics Viewer (IGV) using m7G TRAC-Seq data. Chemical treatment resulted in a site specific decrease of reads at m7G modified position. n=2. (E) Schematic diagram of the method to calculate the cleavage score at individual positions using TRAC-Seq data. (F) Representative images of cleavage scores of indicated tRNAs. Pictures show a specific increase of cleavage score at the m7G sites. (G) Overlap of m7G modified tRNAs identified in m7G MeRIP-Seq and m7G TRAC-Seq.
Figure 3
Figure 3. Evolutionary sequence conservation and function of m7G tRNA modifications
(A) Sequence motif in the m7G sites identified by m7G TRAC-Seq in mouse cells. (B) Sequences of Gly-tRNAs in mouse and yeast. GlyAAC tRNA exists in mouse but not in the yeast. Green box labels the anticodon and red box indicates the m7G motif. (C) Sequences of ArgTCT and AsnGTT tRNAs in different species. Green box labels the anticodon and red box indicates the m7G motif. (D) Scatter plot of tRNA expression levels in the Mettl1 KO and control cells. Each dot represents one tRNA genes. x- axis indicates the changes of tRNA expression levels, y-axis indicates p-value. (E) Mann-Whitney test on the expression of the m7G and non-m7G tRNAs. (F) Expression profile of the 22 m7G modified tRNAs. Each box plot shows the expression of a tRNA type that was calculated from the combined expression of all the tRNA genes for the same tRNA type. (G) Small RNA Northern blot of the METTL1 rescue samples with indicated probes. U6 snRNA was used as a loading control.
Figure 4
Figure 4. Mettl1 depletion causes ribosome pausing at m7G tRNA-dependent codon containing cell cycle and disease genes
(A) Polysome profiling of the Mettl1 KO and WT cells. (B) Scatter plot of translation efficiency (TE) in the Mettl1 KO and WT cells. TE was calculated by dividing the ribosome protected fragments (RPF) signals to the input RNA-Seq signals. (C) Codon frequency in the CDS region of the genes with increased TE (up), decreased TE (down) and other genes (non) in the Mettl1 KO cells. (D) Ribosome occupancy at individual codon at A sites and A+1 sites. Data were presented as the relative ribosome footprinting signals from Mettl1 KO and WT cells. The codons are separated into four groups based on the modification and expression status of their corresponding tRNAs: codons decoded the m7G tRNAs (red); codons decoded by m7G tRNAs by wobble effect because of the not detected levels of their corresponding tRNAs (pink); codons decoded by non-m7G tRNAs by wobble effect because of the not detected levels of their corresponding tRNAs (grey); codons decoded by non-m7G tRNAs (black). (E) Gene ontology analysis of function enrichment in human phenotype and biological process using the TE down-regulated genes upon Mettl1 KO. (F-G) Cell cycle analysis of Mettl1 KO and WT cells. n=3, *p<0.05, **p<0.01.
Figure 5
Figure 5. Mettl1 is required for mESCs self-renewal
(A) qRT-PCR analysis of mRNA expression in Mettl1 KO and control cells with indicated primers. Error bars = mean ±SEM, n=3. (B) Western blot with indicated antibodies. (C) Cellular proliferation in the Mettl1 KO and control cells. 105 cells were seeded in 100 mm tissue culture dishes and then the cell numbers were counted at Day 3 and Day 5. n=3. (D-F) Colony formation assay of Mettl1 KO and control cells. 500 cells were seeded in 6 well plate, one week later, the colony size and number were measured. (D) The representative images of the colonies. Scale bar, 50uM. (E) Colony diameters. n=8, ***p<0.001. (F) Colony numbers. n=6, **p<0.01, ***p<0.001. (G-H) AP staining of the Mettl1 KO and control cells. Scale bar, 100uM. (G) Representative images; (H) Percentage of AP positive colonies. n=10, *p<0.05, ***p<0.001. (I) Scatter plot of mRNA expression using the RNA-Seq data from the Mettl1 KO and control cells. (J-K) Gene ontology analysis of the up-regulated and down-regulated genes upon Mettl1 knockout in mESCs. (L-M) q-RT-PCR analysis of mRNA expression in Mettl1 KO and control cells with indicated primers. Error bars = mean ±SEM, n=3.
Figure 6
Figure 6. Mettl1 knockout disrupts balance of ESC differentiation and impairs neural lineage differentiation
(A) Upper panel: schematic diagram of ESC embryoid body differentiation procedure. Lower panel: qRT-PCR analysis of mRNA expression in Mettl1 KO and control cells (after differentiation for 6 days) with indicated primers. Error bars = mean ±SEM, n=3. (B) Scatter plot of mRNA expression using the RNA-Seq data from the Mettl1 KO and control embryonic bodies (differentiated for 6 days). (C) Gene ontology analysis of functional enrichment in biological process using the differentially expression genes between the Day6 Mettl1 KO and control embryoid bodies. (D) Upper panel: schematic diagram of ESC neural lineage differentiation procedure. Lower panel: qRT-PCR analysis of mRNA expression in Mettl1 KO and control cells (after differentiation for 6 days) with indicated primers. Error bars = mean ±SEM, n=3. (E) Western blot of the METTL1 rescue samples with indicated antibodies. (F) qRT-PCR analysis of mRNA expression in METTL1 rescue samples (after differentiation for 6 days) with indicated primers. Error bars = mean ±SEM, n=3.
Figure 7
Figure 7. Wdr4 knockdown abolishes m7G tRNA modification and impairs ESC proliferation and neural differentiation
(A) Schematic diagram of CRISPR mediated knockout of Wdr4 expression in mESCs. (B) PCR to confirm the knockout of Wdr4 in mESCs using genome DNA samples from the knockout and control cells. (C) qRT-PCR analysis of Wdr4 mRNA expression in knockout and control cells. Error bars = mean ±SEM, n=3. (D) Anti-m7G Northwestern blot of m7G modifications. RNA samples were separated with TBE-UREA gel, when transferred to nylon membrane for Western blotting using anti-m7G antibody. Northern blot of U6 snRNA was used a loading control. (E) Small RNA Northern blot of the anti-m7G IP products with indicated probes. (F) Northern blot of the chemical treated RNA samples with indicated probes. (G) Cellular proliferation in the Wdr4 and control cells. 105 cells were seeded in 100 mm tissue culture dishes and then the cell numbers were counted at Day 3 and Day 5. (H) Upper panel: schematic diagram of ESC neural lineage differentiation procedure. Lower panel: qRT-PCR analysis of mRNA expression in Mettl1 KO and control cells (after differentiation for 6 days) with indicated primers. Error bars = mean ±SEM, n=3.

References

    1. Alexandrov A, Chernyakov I, Gu W, Hiley SL, Hughes TR, Grayhack EJ, Phizicky EM. Rapid tRNA decay can result from lack of nonessential modifications. Molecular cell. 2006;21:87–96. - PubMed
    1. Alexandrov A, Grayhack EJ, Phizicky EM. tRNA m7G methyltransferase Trm8p/Trm82p: evidence linking activity to a growth phenotype and implicating Trm82p in maintaining levels of active Trm8p. Rna. 2005;11:821–830. - PMC - PubMed
    1. Alexandrov A, Martzen MR, Phizicky EM. Two proteins that form a complex are required for 7- methylguanosine modification of yeast tRNA. Rna. 2002;8:1253–1266. - PMC - PubMed
    1. Anders S, Pyl PT, Huber W. HTSeq–a Python framework to work with high-throughput sequencing data. Bioinformatics. 2015;31:166–169. - PMC - PubMed
    1. Barbieri I, Tzelepis K, Pandolfini L, Shi J, Millan-Zambrano G, Robson SC, Aspris D, Migliori V, Bannister AJ, Han N, et al. Promoter-bound METTL3 maintains myeloid leukaemia by m(6)A- dependent translation control. Nature. 2017;552:126–131. - PMC - PubMed

Publication types

MeSH terms