. 2018 Jun 19;9(47):28717-28730.
doi: 10.18632/oncotarget.25617.

Cancer-predicting transcriptomic and epigenetic signatures revealed for ulcerative colitis in patient-derived epithelial organoids

Affiliations

Cancer-predicting transcriptomic and epigenetic signatures revealed for ulcerative colitis in patient-derived epithelial organoids

Samaneh K Sarvestani et al. Oncotarget. .

Abstract

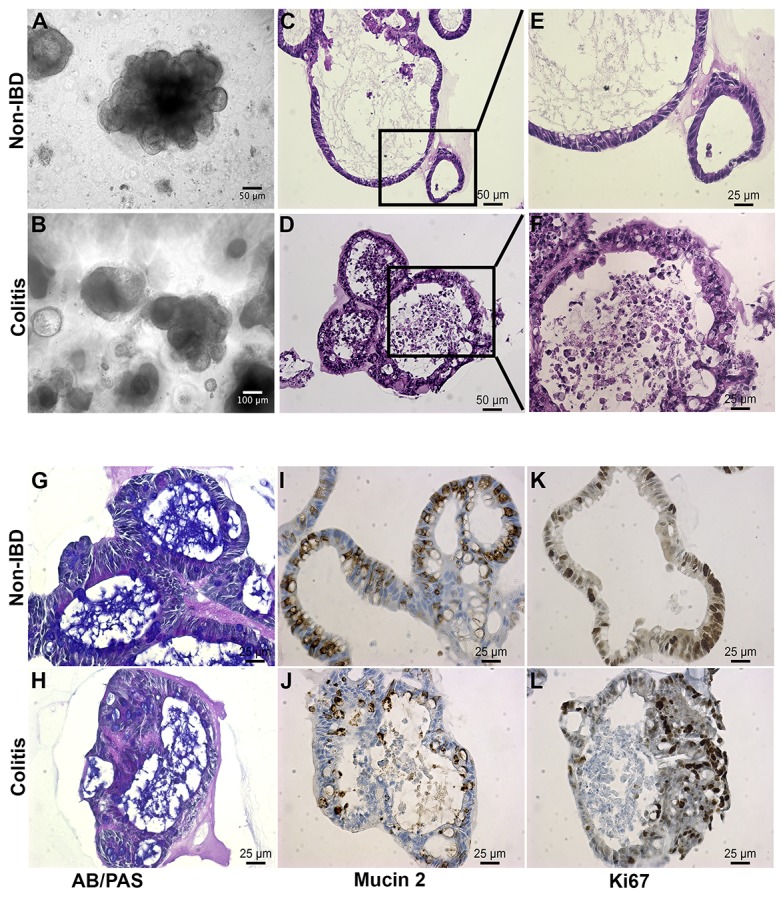
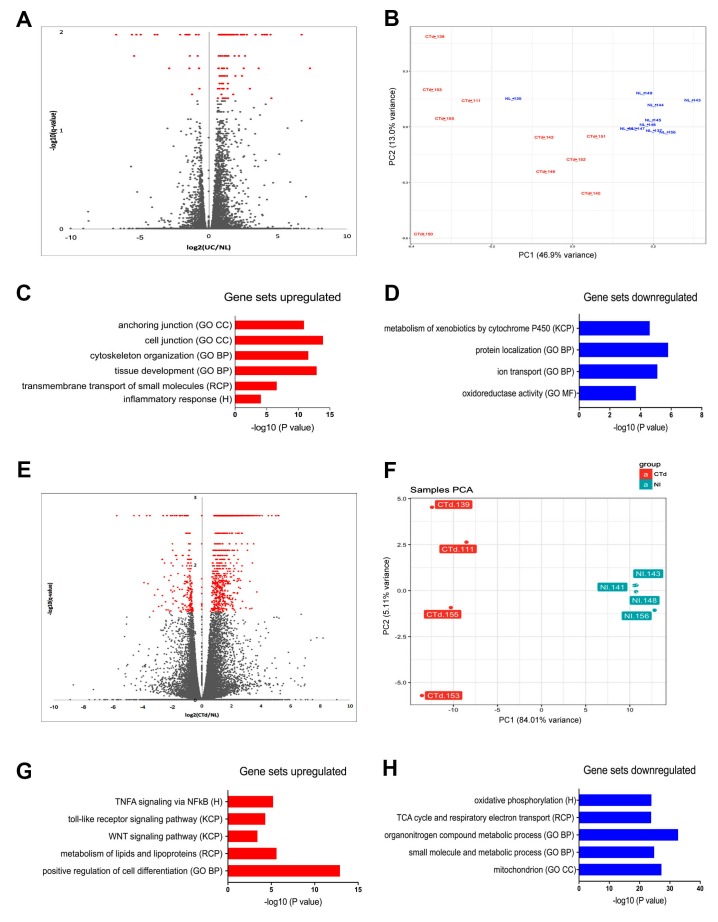
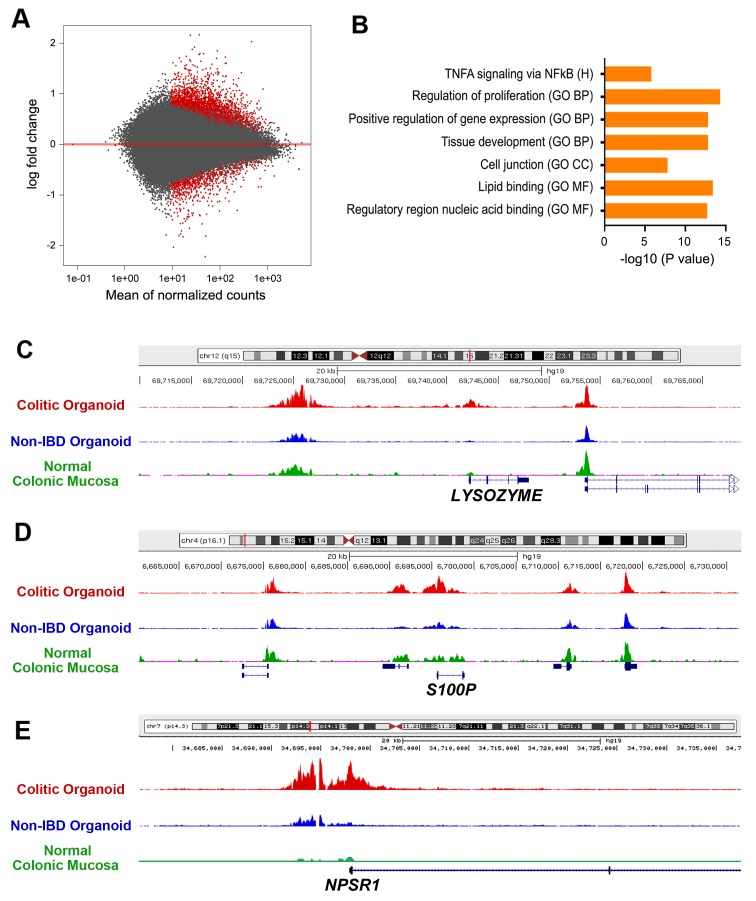
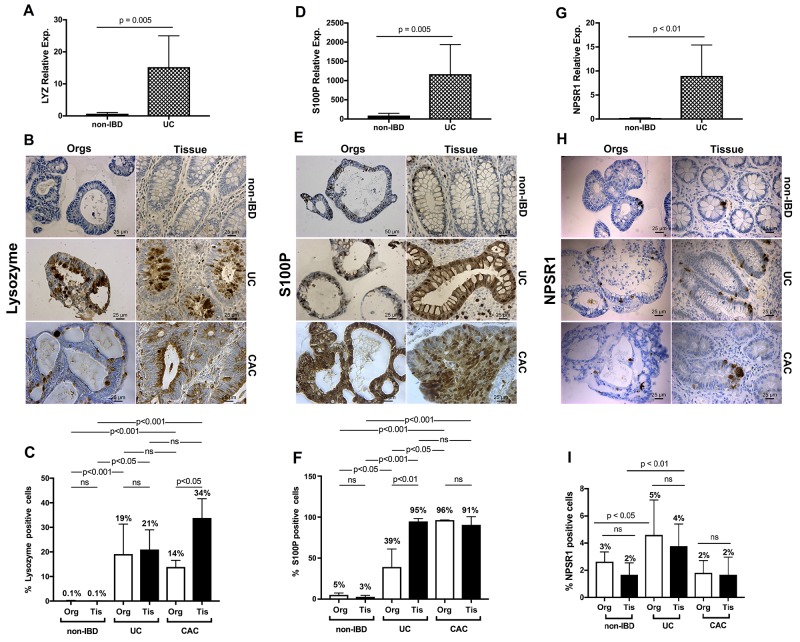
Ulcerative colitis (UC) is a prevalent form of inflammatory bowel disease (IBD) whose pathogenic mechanisms remain unclear. Elucidating these mechanisms is important to reduce UC symptoms and to prevent UC progression into colitis-associated colon cancer (CAC). Our goal was to develop and validate faithful, human-derived, UC models and analyze them at histologic, transcriptomic and epigenetic levels to allow mechanistic studies of UC and CAC pathogenesis. We generated patient-derived primary-organoid cultures from UC and non-IBD colonic epithelium. We phenotyped them histologically and used next-generation-sequencing approaches to profile whole transcriptomes and epigenomes of organoids and primary tissues. Tissue organization and expression of mucin 2 (MUC2) and lysozyme (LYZ) demonstrated histologic faithfulness of organoids to healthy and diseased colonic epithelium. Transcriptomic analyses showed increased expression of inflammatory pathways in UC patient-derived organoids and tissues. Profiling for active enhancers using the H3K27ac histone modification revealed UC-derived organoid enrichment for pathways indicative of gastrointestinal cancer, including S100 calcium-binding protein P (S100P), and revealed novel markers for GI cancer, including both LYZ and neuropeptide S receptor 1 (NPSR1). Immunolocalization showed increased levels of LYZ, S100P, and NPSR1 proteins in UC and CAC. In conclusion, primary colonic organoid cultures from UC and non-IBD patients can be established that faithfully represent diseased or normal colonic states. These models reveal precancerous molecular pathways that are already activated in UC. The findings demonstrate the suitability of primary organoids for dissecting UC and CAC pathogenic mechanisms and suggest new targets for therapeutic intervention.

Keywords: H3K27Ac enhancer chromatin mark; colitis associated cancer; inflammation; organoids; ulcerative colitis.


Conflict of interest statement

CONFLICTS OF INTEREST The authors declare no conflicts of interest.

Figures

Figure 1
Figure 1. Colitic organoids phenocopy primary disease
(A, B) Bright field images reveal polypoid 3D configurations with budding excrescences. (C, E) These images of embedded organoids document the relatively simple epithelium surrounding a cystic lumen containing mucus in the non-IBD organoid. (D, F) Contrast this epithelium with the more complex stratified epithelium from the colitis-derived organoid (n>20 each). (G, H) Alcian Blue (blue)/Periodic Acid Schiff (purple) staining is relatively weaker in colitis-derived organoids than in non-IBD organoids. (I, J) MUC2 level is reduced in colitic organoids relative to non-IBD derived organoids. (K, L) Ki67, a proliferation marker, is present in both non-IBD and colitic organoids. (n ≥ 3 per stain; Scale bars as shown).
Figure 2
Figure 2. Transcriptome analysis of UC and non-IBD colonic organoids reveal distinct populations with clustering of gene set expression analyses consistent with colitic vs. non-IBD colon
(A) Volcano plot of entire cohort indicates transcriptome differences based on the disease. FDR < 0.05 (Benjamini-Hochberg). Red - Colitis: Grey - non-IBD. (B) Principal component analysis of entire cohort reveals clustering of the populations of colitic organoids (red) versus non-IBD organoids (blue). (C) Enrichment of hits in Molecular Signatures Database (MSigDB) Gene Set Expression analysis of upregulated genes (colitis compared to non-IBD) reveals differential expression consistent with development and inflammation. Log 2-fold changes > 1.5, FDR p< 0.05. (D) Enrichment of hits in MSigDB Gene Set Expression analysis of genes demonstrates pathways downregulated in colitis compared to non-IBD. Log 2-fold changes > 1.5, FDR p< 0.05. (E) Volcano plot reveals enrichment of hits in MSigDB subset analysis (subset “B”) of colitic organoids versus non-IBD organoids. Log 2-fold changes > 1.5, FDR < 0.05. This subset was defined by examining more stringent clustering based on principal component analysis. Increased number of genes is now apparent (>1100 genes), log2 UC/non-IBD, FDR < 0.05 (Benjamini-Hochberg). Red; Colitis, Grey, non-IBD. (F) Principal component analysis subset B. Colitic organoids (red) versus non-IBD organoids (blue) for clustered analysis demonstrating a subset of the organoids exhibiting polarized clustering (subset B). (G) Gene Set Expression analysis of upregulated genes in subset B compares UC versus non-IBD organoids revealing inflammatory and metabolic pathways. Log2-fold changes > 1.5, FDR < 0.05. (H) Gene Set Expression analysis of downregulated genes in subset B comparing UC to non-IBD organoids demonstrates mitochondrial and metabolic pathway enrichment. Log2-fold changes > 1.5, FDR < 0.05.
Figure 3
Figure 3. ChIP-seq analysis of H3K27ac enrichment UC versus non-IBD colonic organoids
(A) Volcano plot representing enrichment by H3K27ac ChIP followed by deep sequencing on a subset of UC versus non-IBD organoids demonstrates differences in expression based on disease, FDR < 0.05. Red: colitis; Grey: non-IBD. (B) Molecular signatures database (MSigDB) analyses revealing multiple upregulated gene sets. Log2-fold changes > 1.5, FDR p< 0.05. GO CC: gene ontogeny cellular component; GO BP: gene ontogeny biological process; RCP: reactome curated pathways; H: Hallmark; KCP: KEGG curated pathways; GO MF: Gene ontogeny molecular function. [50] (C-E) Normalized H3K27ac ChIP-seq tracks at the LYZ (C), S100P (D), and NPSR1 (E) loci, respectively. Red track originates from UC organoids, blue track from non-IBD organoids. Green track is from ENCODE standard for normal colonic mucosa.
Figure 4
Figure 4. qRT-PCR and IHC validation of enrichment delineated by ChIP-seq and transcriptome analysis for UC and extended to colitis-associated cancer
(A) LYZ quantitative real-time PCR. Quantitative PCR for LYZ comparing UC organoids to non-IBD organoids. Relative expression compared to GAPDH with relative 2-ΔΔCT expression (B) LYZ IHC for non-IBD, colitis-derived, and colitis-associated cancer organoids compared to primary non-IBD, UC and CAC primary tissues. (C) Quantification of the percentages of cells positive for LYZ protein. LYZ graphical summaries reflect the differences in enumerated expression. P-value for non-IBD organoids and non-IBD tissues vs. UC and CAC organoids and tissues = 0.0002. (D-F) Same data as in panels A – C, for S100P reveal increased expression at the transcription and protein levels for both the UC and the CAC organoids. (G-I) Same data as for panels A – C for NPSR1 demonstrates increased expression at the transcriptome and protein levels for both the colitic organoids and tissues but no differences for CAC at the protein level compared to non-IBD tissues. Scale bars as denoted. Colitis, UC; colitis-associated cancer, CAC. N ≥ 4 each. Quantification performed with unpaired two-sided Student’s t-test, one-way ANOVA. NS: not significant. At least 4 technical replicates were done except where indicated. Results are represented as mean +/- SEM of ≥ 4 independent experiments.

References

    1. Danese S, Fiocchi C. Ulcerative colitis. N Engl J Med. 2011;365:1713–25. doi: 10.1056/NEJMra1102942. - DOI - PubMed
    1. Dorofeyev AE, Vasilenko IV, Rassokhina OA, Kondratiuk RB. Mucosal barrier in ulcerative colitis and Crohn’s disease. Gastroenterol Res Pract. 2013;2013:431231. doi: 10.1155/2013/431231. - DOI - PMC - PubMed
    1. Dotti I, Mora-Buch R, Ferrer-Picon E, Planell N, Jung P, Masamunt MC, Leal RF, Martin de Carpi J, Llach J, Ordas I, Batlle E, Panes J, Salas A. Alterations in the epithelial stem cell compartment could contribute to permanent changes in the mucosa of patients with ulcerative colitis. Gut. 2017;66:2069–79. doi: 10.1136/gutjnl-2016-312609. - DOI - PMC - PubMed
    1. McCole DF. IBD candidate genes and intestinal barrier regulation. Inflamm Bowel Dis. 2014;20:1829–49. doi: 10.1097/MIB.0000000000000090. - DOI - PMC - PubMed
    1. Anderson CA, Boucher G, Lees CW, Franke A, D’Amato M, Taylor KD, Lee JC, Goyette P, Imielinski M, Latiano A, Lagace C, Scott R, Amininejad L, et al. Meta-analysis identifies 29 additional ulcerative colitis risk loci, increasing the number of confirmed associations to 47. Nat Genet. 2011;43:246–52. doi: 10.1038/ng.764. - DOI - PMC - PubMed