. 2018 Jun 6;9(7):2955-2973.
doi: 10.1364/BOE.9.002955. eCollection 2018 Jul 1.

Pixel-wise segmentation of severely pathologic retinal pigment epithelium and choroidal stroma using multi-contrast Jones matrix optical coherence tomography

Affiliations

Pixel-wise segmentation of severely pathologic retinal pigment epithelium and choroidal stroma using multi-contrast Jones matrix optical coherence tomography

Shinnosuke Azuma et al. Biomed Opt Express. .

Abstract

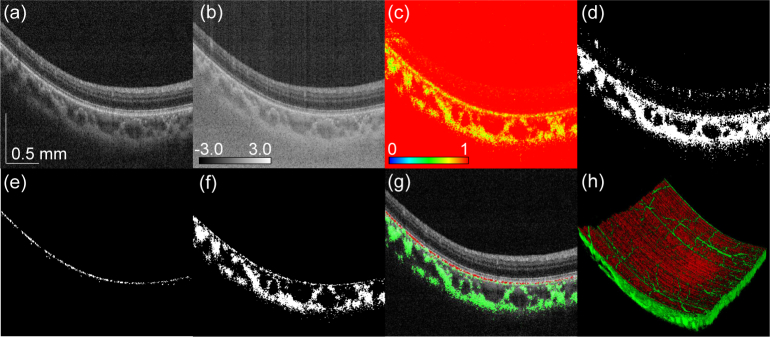
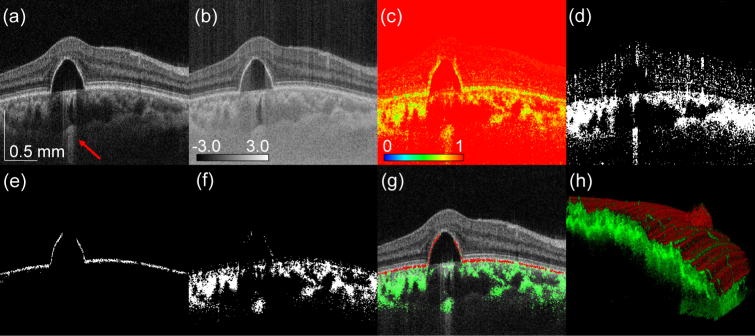
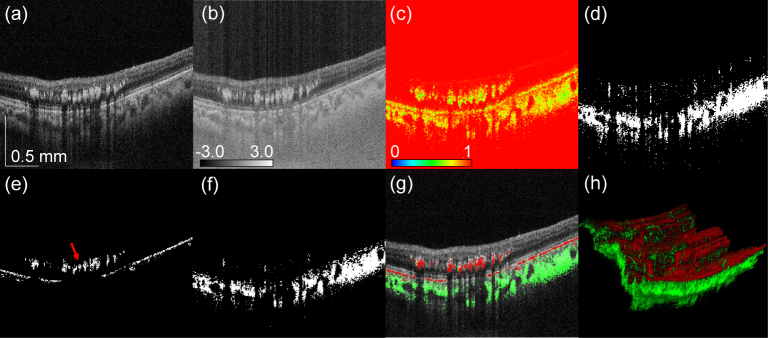
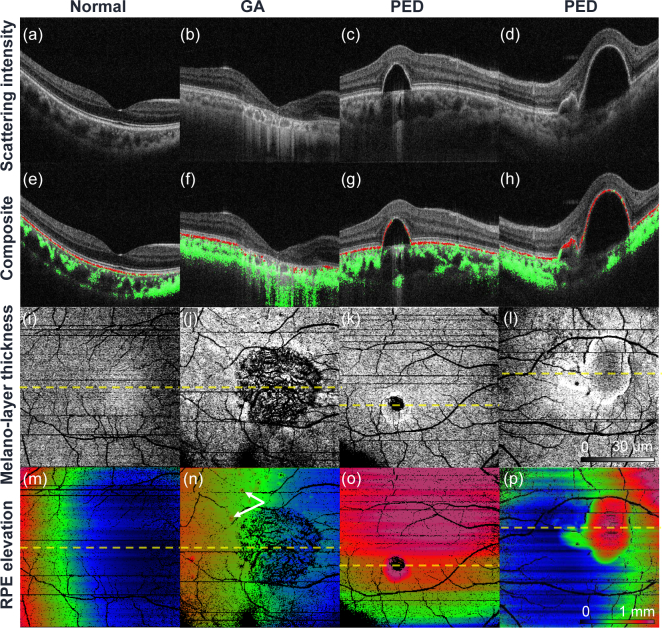
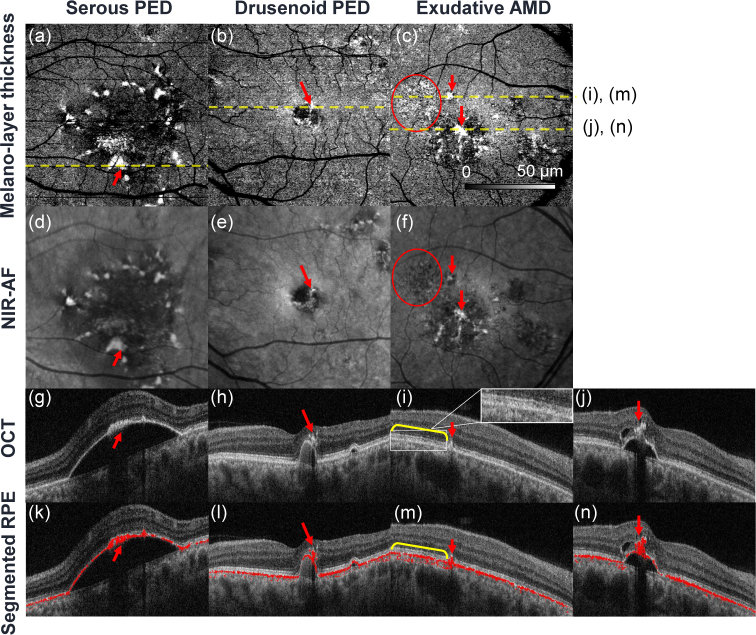
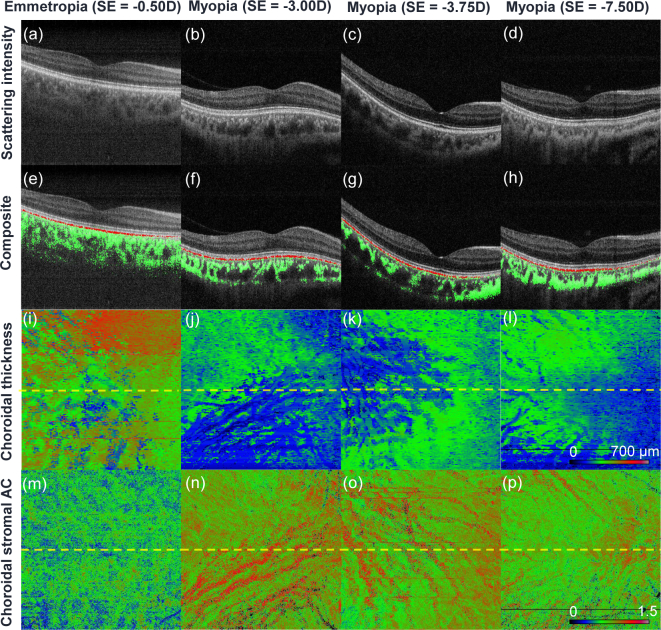
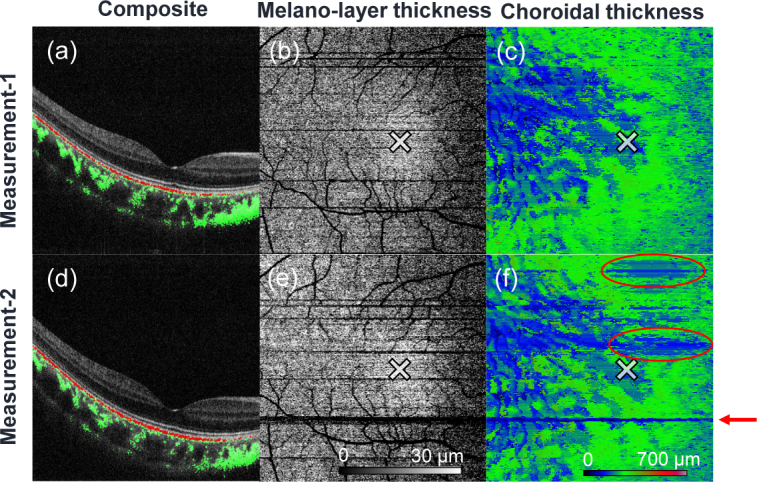
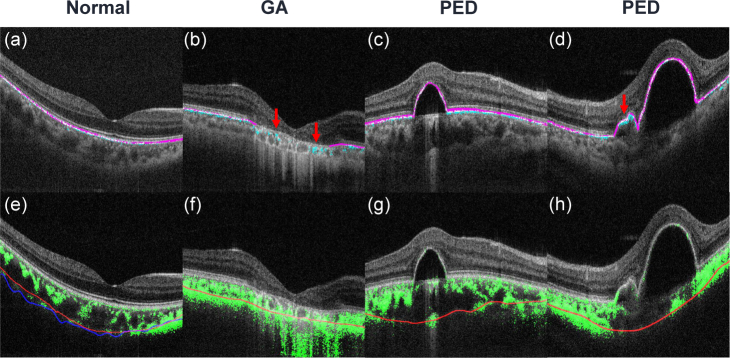
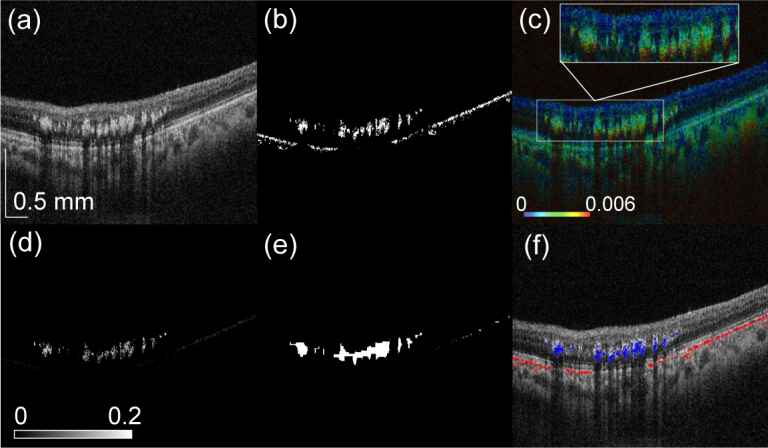
Tissue segmentation of retinal optical coherence tomography (OCT) is widely used in ophthalmic diagnosis. However, its performance in severe pathologic cases is still insufficient. We propose a pixel-wise segmentation method that uses the multi-contrast measurement capability of Jones matrix OCT (JM-OCT). This method is applicable to both normal and pathologic retinal pigment epithelium (RPE) and choroidal stroma. In this method, "features," which are sensitive to specific tissues of interest, are synthesized by combining the multi-contrast images of JM-OCT, including attenuation coefficient, degree-of-polarization-uniformity, and OCT angiography. The tissue segmentation is done by simple thresholding of the feature. Compared with conventional segmentation methods for pathologic maculae, the proposed method is less computationally intensive. The segmentation method was validated by applying it to images from normal and severely pathologic cases. The segmentation results enabled the development of several types of en face visualizations, including melano-layer thickness maps, RPE elevation maps, choroidal thickness maps, and choroidal stromal attenuation coefficient maps. These facilitate close examination of macular pathology. The melano-layer thickness map is very similar to a near infrared fundus autofluorescence image, so the map can be used to identify the source of a hyper-autofluorescent signal.

Keywords: (100.2960) Image analysis; (110.4500) Optical coherence tomography; (170.4470) Ophthalmology; (170.4500) Optical coherence tomography; (170.5755) Retina scanning; (170.6935) Tissue characterization.


Conflict of interest statement

SA, AM: Tomey Corp. (F), TOPCON (F), Nidek (F), Kao (F); SM, YY; Tomey Corp. (F, P), TOPCON (F), Nidek (F), Kao (F); YI: Bayer (F), Tomey Corp. (F); MM Allergan (F), Alcon (F), Novartis (F,R), Santen (F,R), Bayer(F).

Figures

Fig. 1
Fig. 1
Multi-contrast images and segmentation results for a normal case. (a) Scattering intensity, (b) AC presented in the decadic logarithm of the attenuation coefficient in mm1 unit, (c) DOPU, (d) binarized OCTA, (e) segmented RPE, (f) segmented choroidal stroma, (g) RPE (red) and choroidal stroma (green) overlaid on scattering intensity, and (h) volume rendering of RPE (red) and choroidal stroma (green). The scale bar indicates 0.5 mm × 0.5 mm.
Fig. 2
Fig. 2
Multi-contrast images and segmentation results for a PED case. (a) Scattering intensity, (b) AC, (c) DOPU, (d) binarized OCTA, (e) segmented RPE, (f) segmented choroidal stroma, (g) RPE (red) and choroidal stroma (green) overlaid on scattering intensity, and (h) volume rendering of RPE (red) and choroidal stroma (green). The scale bar indicates 0.5 mm × 0.5 mm.
Fig. 3
Fig. 3
Multi-contrast images and segmentation results for a case of AMD with hard exudates. (a) Scattering intensity, (b) AC, (c) DOPU, (d) binarized OCTA, (e) segmented RPE, (f) segmented choroidal stroma, (g) RPE (red) and choroidal stroma (green) overlaid on scattering intensity, and (h) volume rendering of RPE (red) and choroidal stroma (green). The scale bar indicates 0.5 mm × 0.5 mm.
Fig. 4
Fig. 4
Examples of en face RPE analysis. The first row shows representative OCT cross-sections. The second row shows the same OCT cross-section, but with the segmented RPE and choroidal stroma overlaid as red and green pixels, respectively. The third and fourth rows are melano-layer thickness maps and RPE elevation maps, respectively. The first to fourth columns represent normal and GA cases, and two PED cases. The positions of the OCT cross-sections (first and second rows) are indicated by horizontal dashed lines on the en face images (third and fourth rows).
Fig. 5
Fig. 5
Comparisons between melano-layer thickness maps [(a)-(c)] and NIR-AF images [(d)–(f)]. The third row [(g)–(j)] shows representative OCT cross-sections, and the fourth row [(k)-(n)] shows the same OCT images but with the segmented RPE overlaid as red pixels. The position of each cross-sectional image is indicated on the corresponding sub-figure (a)–(c). The columns represent serous PED, drusenoid PED, and exudative AMD cases from left to right.
Fig. 6
Fig. 6
Examples of en face maps representing choroidal characteristics. The first row shows representative OCT cross-sections. The second row shows the same OCT cross-sections, but with the segmented RPE and choroidal stroma overlaid as red and green pixels, respectively. The third and fourth rows show choroidal thickness maps and choroidal stromal AC maps, respectively. The first to fourth columns represent normal to myopic cases with the spherical equivalent refractive errors of -0.50, -3.00, -3.75, -7.50 D, respectively. The position of the OCT cross-sections (first and second rows) are indicated by horizontal dashed lines on the en face images (third and fourth rows).
Fig. 7
Fig. 7
Comparison of pairs of measurements of the same subject. The two rows represent the two different measurements. The first column shows OCT cross-sections overlaid with the segmented RPE (red) and the choroidal stroma (green). The second and third columns show the melano-layer thickness maps and the choroidal thickness maps, respectively. The ‘×’ symbols indicate the foveal positions, while the red circles and the arrow shown in (f) indicate the discrepancies between the two measurements.
Fig. 8
Fig. 8
Comparisons of results obtained using the present method, manual segmentation, and the previously demonstrated PS-OCT-based chorio-scleral interface (CSI) segmentation method [44]. From left to right, the columns represent the normal case, the GA case, and two PED cases. The first row compares the results of RPE segmentations using the present method (cyan pixels) with those obtained by manual segmentation (magenta). The second row compares choroidal stromata segmented using the present method (green) and CSIs delineated using the previous PS-OCT-based method (blue) and by a human expert (red). Because the previous PS-OCT-based method is not applicable to pathologic cases, it is only shown in (e).
Fig. 9
Fig. 9
The process to distinguish hard exudates from RPE. (a) shows a representative OCT cross-section (scattering intensity). (b) shows the RPE as segmented by the method presented in Section 3.1. (c) The corresponding birefringence cross-section. (d) The feature for hard exudate segmentation [FHX, Eq. (3)] (e) The binary map created from (d) by applying a threshold and subsequent morphological filtering. (f) Segmented RPE (red) and hard exudates (blue) overlaid on the OCT cross-section. The scale bar indicates 0.5 mm × 0.5 mm.

References

    1. Huang D., Swanson E. A., Lin C. P., Schuman J. S., Stinson W. G., Chang W., Hee M. R., Flotte T., Gregory K., Puliafito C. A., Fujimoto J. G., “Optical coherence tomography,” Science 254, 1178–1181 (1991). 10.1126/science.1957169 - DOI - PMC - PubMed
    1. Baumann B., Götzinger E., Pircher M., Sattmann H., Schütze C., Schlanitz F., Ahlers C., Schmidt-Erfurth U., Hitzenberger C. K., “Segmentation and quantification of retinal lesions in age-related macular degeneration using polarization-sensitive optical coherence tomography,” J. Biomed. Opt. 15, 061704 (2010). 10.1117/1.3499420 - DOI - PMC - PubMed
    1. Chiu S. J., Allingham M. J., Mettu P. S., Cousins S. W., Izatt J. A., Farsiu S., “Kernel regression based segmentation of optical coherence tomography images with diabetic macular edema,” Biomed. Opt. Express 6, 1172–1194 (2015). 10.1364/BOE.6.001172 - DOI - PMC - PubMed
    1. Fernández D. C., Salinas H. M., Puliafito C. A., “Automated detection of retinal layer structures on optical coherence tomography images,” Opt. Express 6, 10200–10216 (2005). 10.1364/OPEX.13.010200 - DOI - PubMed
    1. Chiu S. J., Li X. T., Nicholas P., Toth C. A., Izatt J. A., Farsiu S., “Automatic segmentation of seven retinal layers in SDOCT images congruent with expert manual segmentation,” Opt. Express 18, 19413–19428 (2010). 10.1364/OE.18.019413 - DOI - PMC - PubMed

LinkOut - more resources