. 2018 Jun 21;9(7):3220-3243.
doi: 10.1364/BOE.9.003220. eCollection 2018 Jul 1.

Machine-learning based segmentation of the optic nerve head using multi-contrast Jones matrix optical coherence tomography with semi-automatic training dataset generation

Affiliations

Machine-learning based segmentation of the optic nerve head using multi-contrast Jones matrix optical coherence tomography with semi-automatic training dataset generation

Deepa Kasaragod et al. Biomed Opt Express. .

Abstract

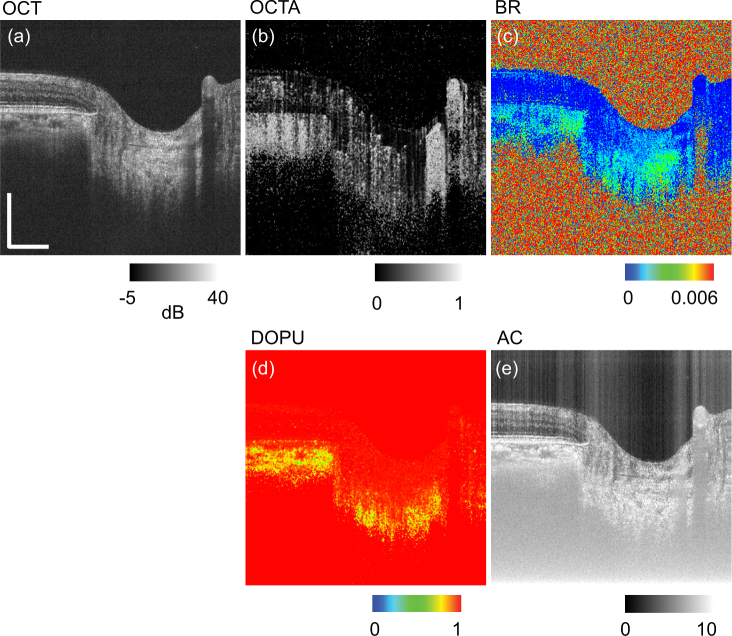
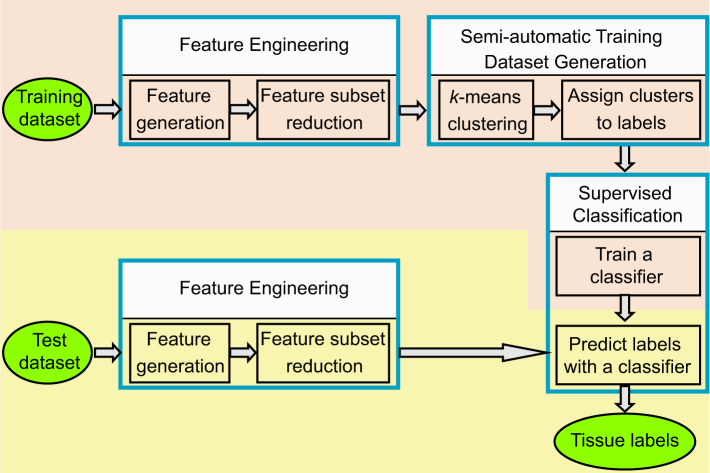
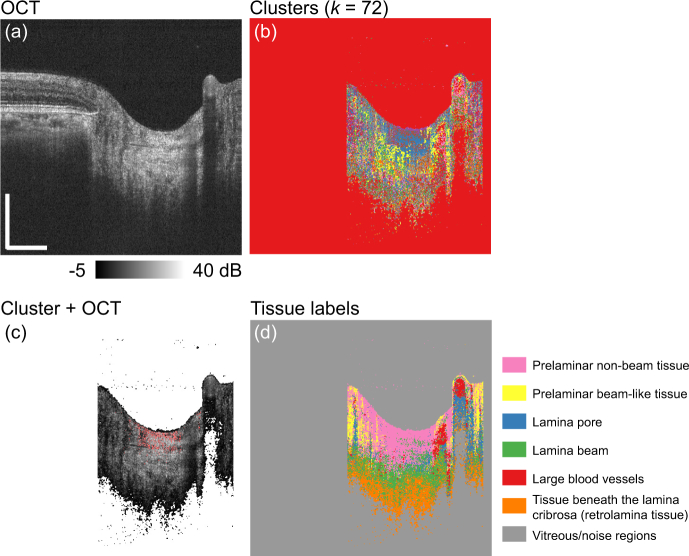
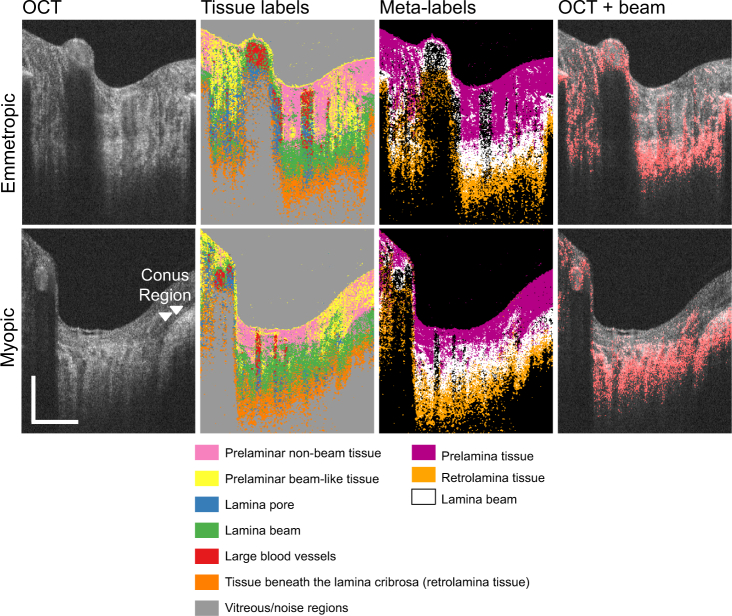
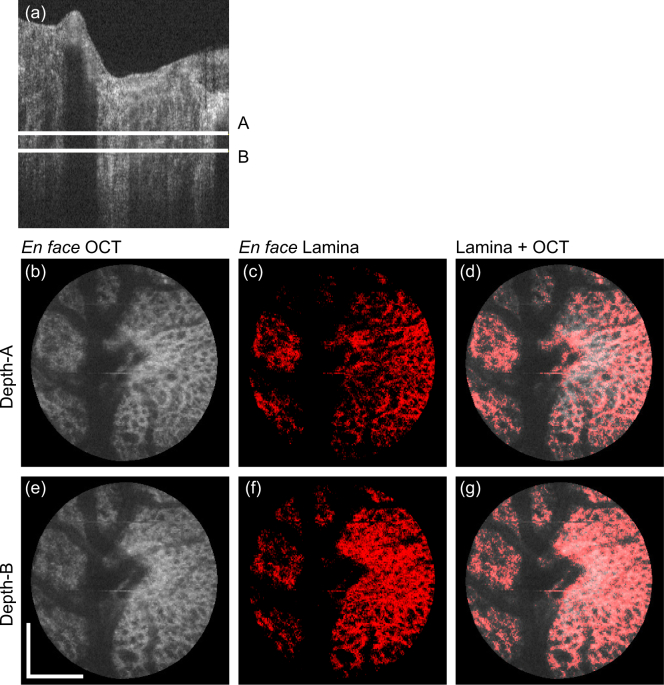
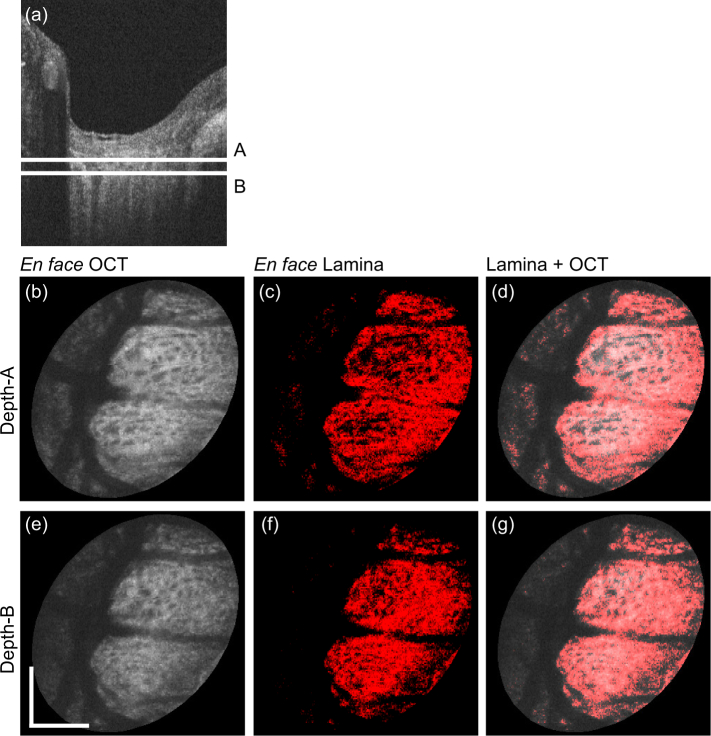
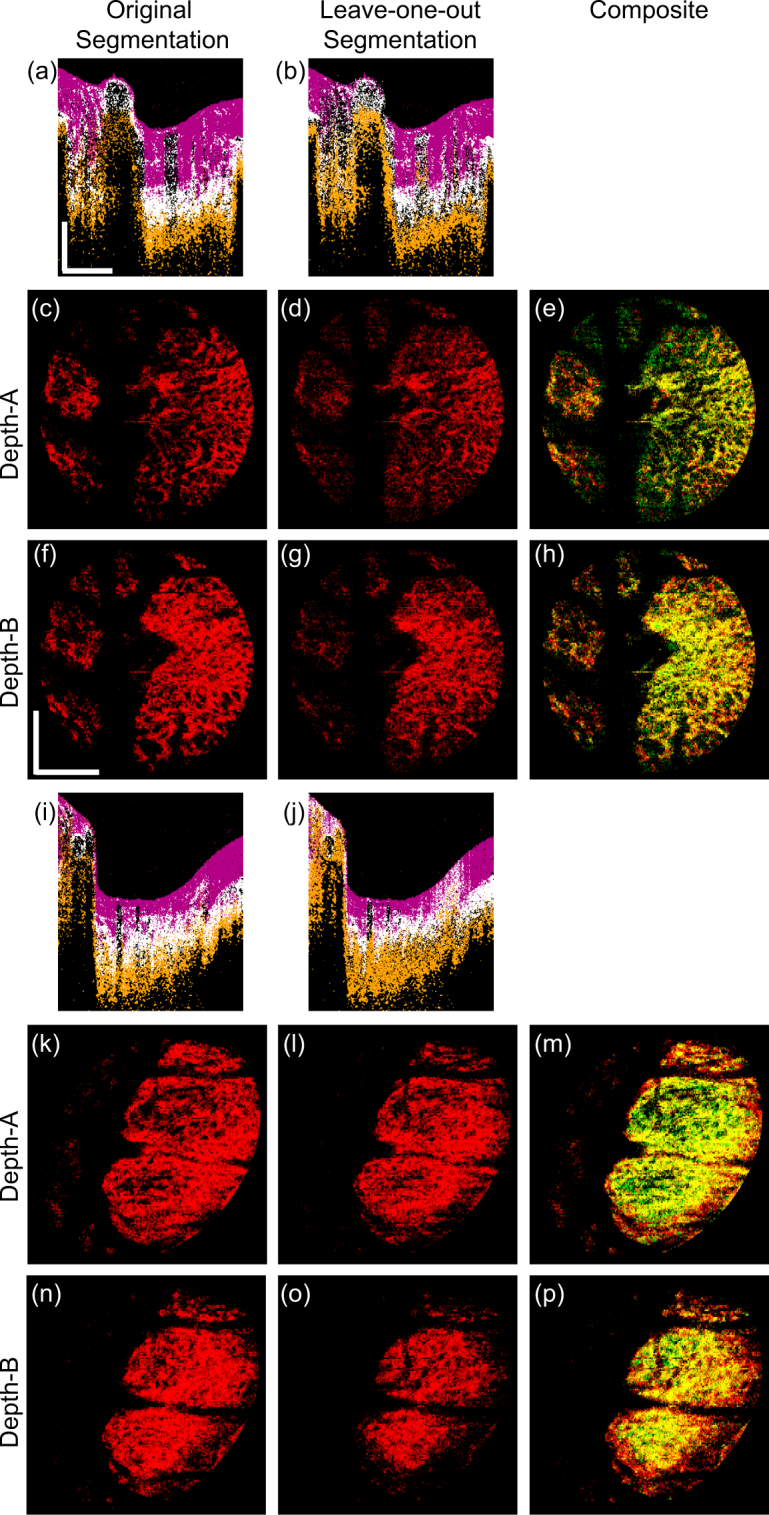
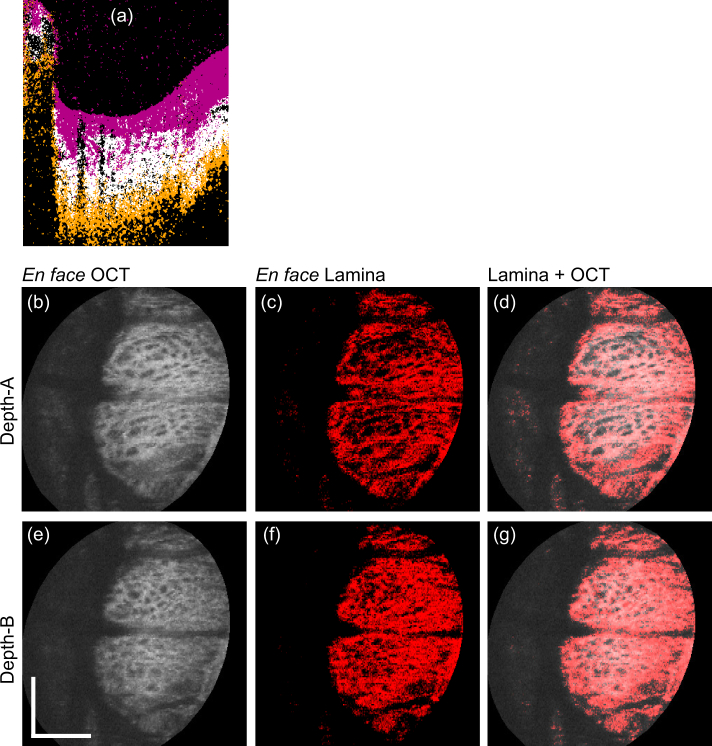
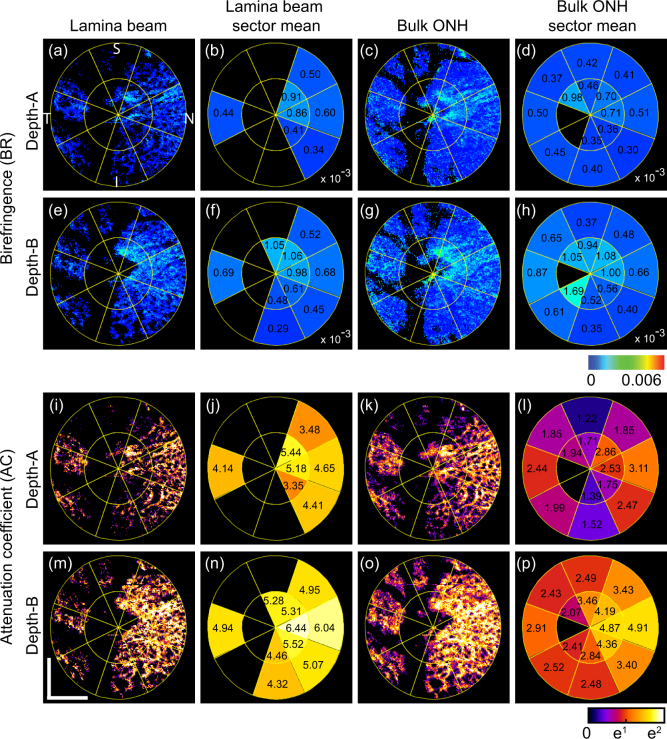
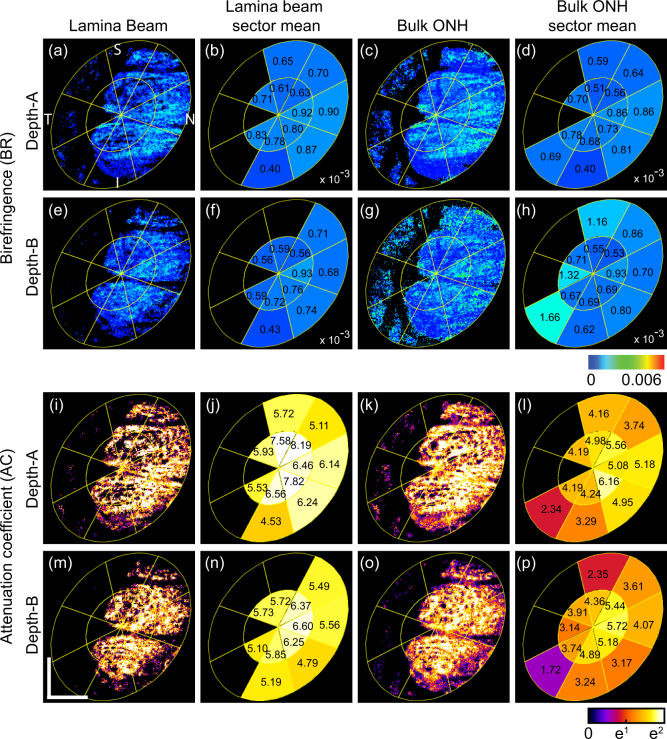
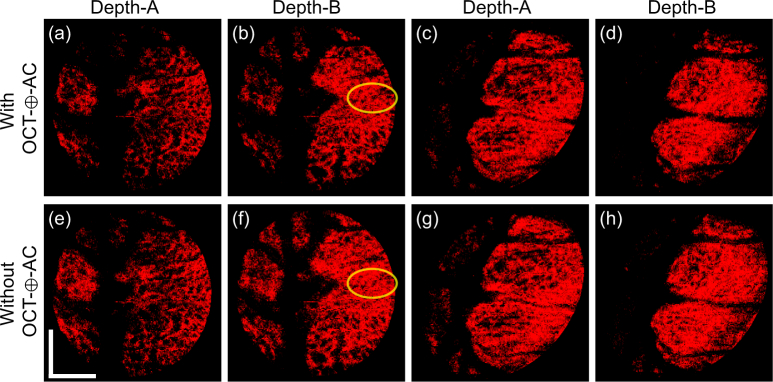
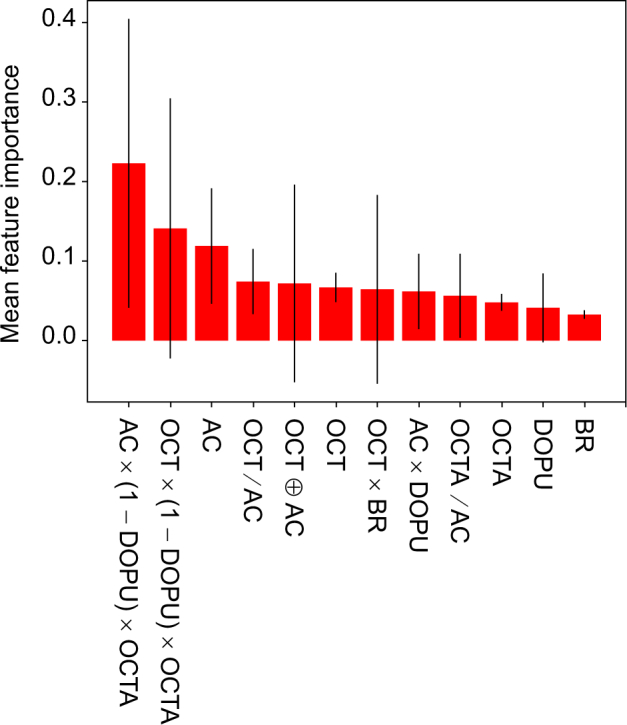
A pixel-by-pixel tissue classification framework using multiple contrasts obtained by Jones matrix optical coherence tomography (JM-OCT) is demonstrated. The JM-OCT is an extension of OCT that provides OCT, OCT angiography, birefringence tomography, degree-of-polarization uniformity tomography, and attenuation coefficient tomography, simultaneously. The classification framework consists of feature engineering, k-means clustering that generates a training dataset, training of a tissue classifier using the generated training dataset, and tissue classification by the trained classifier. The feature engineering process generates synthetic features from the primary optical contrasts obtained by JM-OCT. The tissue classification is performed in the feature space of the engineered features. We applied this framework to the in vivo analysis of optic nerve heads of posterior eyes. This classified each JM-OCT pixel into prelamina, lamina cribrosa (lamina beam), and retrolamina tissues. The lamina beam segmentation results were further utilized for birefringence and attenuation coefficient analysis of lamina beam.

Keywords: (110.4500) Optical coherence tomography; (110.5405) Polarimetric imaging; (170.4460) Ophthalmic optics and devices; (170.4470) Ophthalmology; (170.4500) Optical coherence tomography.


Conflict of interest statement

DK, YJH: Tomey Corp. (F), Nidek (F), Kao (F); YY, SM: Tomey Corp. (F, P), Nidek (F), Kao (F). YJH is currently employed by Koh Young Technology.

Figures

Fig. 1
Fig. 1
Example of multiple contrasts of an ONH cross-section obtained by JM-OCT: (a) OCT intensity (OCT), (b) OCT angiography (OCTA), (c) birefringence (BR), (d) degree of polarization uniformity (DOPU), and (e) attenuation coefficient (AC). Scale bars indicate 0.5 mm × 0.5 mm.
Fig. 2
Fig. 2
The framework of our tissue classification method. It consists of training set generation (pink region) and classification process (yellow region). The circle and rectangle objects represent the data and the operations, respectively.
Fig. 3
Fig. 3
Example of manual tissue label assignment: (a) an OCT image, (b) clusters with each different color, (c) example of a cluster (red) overlaid on the OCT, (d) tissue labels as each label is displayed with each color. Scale bars indicate 0.5 mm × 0.5 mm.
Fig. 4
Fig. 4
Examples of tissue classification results. First and second rows are for an emmetropic case (left eye of Subject-3) and a myopic case (left eye of Subject-1), respectively. Each column, from left to right, represents the images: OCT, tissue labels, meta-labels, and lamina beam pixels (red) overlaid on the OCT. Meta-labels are for prelamina tissue, lamina beam, and retrolamina tissue. Scale bars indicate 0.5 mm × 0.5 mm.
Fig. 5
Fig. 5
En face projection images of the emmetropic case that corresponds to the first row of Fig. 4. (a) Representative B-scan, where two depth positions (A and B) are indicated. (b)–(d) and (e)–(g) are en face slices obtained at the depth-A and depth-B, respectively. (b) and (e) are the OCT intensity, (c) and (f) are the segmented lamina beam, and (d) and (g) are the OCT intensity on which the lamina beam pixels are overlaid in red. Scale bars indicate 0. 5 mm × 0.5 mm.
Fig. 6
Fig. 6
En face projection images of the myopic case that corresponds to the second row of Fig. 4. Subfigure configuration is identical to Fig. 5. Scale bars indicate 0.5 mm × 0.5 mm.
Fig. 7
Fig. 7
A comparison of the original and leave-one-out segmentations. The upper half of the figure shows the images of the left eye of Subject-3 (emmetropia); and the lower half shows the left eye of Subject-1 (myopia). The first and second columns show the original and leave-one-out segmentations. The third column shows the red-green composite of the first and second column images, where the original and leave-one-out segmentation results are in red and green, respectively. The first and fourth rows show the cross-sectional meta-label images, the second and fifth rows show the en face lamina beam at Depth-A, and the third and sixth rows show that at Depth-B. Scale bars indicate 0.5 mm × 0.5 mm.
Fig. 8
Fig. 8
Segmentation results of the myopic eye (Subject-1). Segmentation was performed using the same trained classifier as Fig. 6 however, the data were acquired 6 months after the training dataset was acquired. (a) represents the cross-sectional image of the meta-labels. The alignment of (b)–(g) was identical to that of Fig. 6. Scale bars indicate 0.5 mm × 0.5 mm.
Fig. 9
Fig. 9
En face birefringence maps (first and second rows) and attenuation coefficient maps (third and fourth rows) for the emmetropic case (Subject-3) that corresponds to Fig. 5. The first and the third rows correspond to depth-A, while the second and the fourth rows correspond to depth-B as shown in Fig. 5(a). (a) and (e) are en face lamina beam birefringence, where the non-lamina beam tissues were masked out by using the segmented lamina beam. (b) and (f) are sectorized birefringence maps of the lamina beam. (c) and (g) are bulk ONH birefringence, while (d) and (h) are sectorized birefringence maps of the bulk ONH. (i) and (m) are en face lamina beam attenuation coefficient. (j) and (n) are sectorized attenuation coefficient maps of the lamina beam. (k) and (o) are bulk ONH attenuation coefficient, while (l) and (p) are sectorized attenuation coefficient maps of the bulk ONH. Scale bars indicate 0. 5 mm × 0.5 mm.
Fig. 10
Fig. 10
En face birefringence maps (first and second rows) and attenuation coefficient maps (third and fourth rows) for the myopic case (Subject-1) that corresponds to Fig. 6. Subfigure configuration is identical to Fig. 9. Scale bars indicate 0. 5 mm × 0.5 mm.
Fig. 11
Fig. 11
The comparison of lamina beam segmentation results with and without OCT-⊕-AC feature. (a)–(d) are segmented lamina beam with the OCT-⊕-AC feature, while (e)–(h) are without the OCT-⊕-AC feature. The images are obtained at two depths as indicated in the figure The left four images (a), (b), (e), and (f) are from the emmetropic subject (Subject-3) and right four images (c), (d), (g), and (h) are from the myopic subject (Subject-1). (a)–(d) are identical to Figs. 5(c), 5(f), 6(c), and 6(f), respectively.
Fig. 12
Fig. 12
The mean and standard deviations of the Gini importance for each feature. The mean was computed over 10 decision trees in the trained random forest classifier. The heights of the red bars indicate the mean importance of each feature; and the black lines indicate the standard deviation.

References

    1. Sigal I. A., Wang B., Strouthidis N. G., Akagi T., Girard M. J. A., “Recent advances in OCT imaging of the lamina cribrosa,” Br. J. Ophthalmol. 98, ii34–ii39 (2014). 10.1136/bjophthalmol-2013-304751 - DOI - PMC - PubMed
    1. Mari J.-M., Aung T., Cheng C.-Y., Strouthidis N. G., Girard M. J. A., “A digital staining algorithm for optical coherence tomography images of the optic nerve head,” Transl. Vis. Sci. Technol. 6, 1–12 (2017). 10.1167/tvst.6.1.8 - DOI - PMC - PubMed
    1. Kennedy B. F., Kennedy K. M., Sampson D. D., “A Review of Optical Coherence Elastography: Fundamentals, Techniques and Prospects,” IEEE J. Sel. Topics Quantum Electron. 20, 272–288 (2014). 10.1109/JSTQE.2013.2291445 - DOI
    1. Larin K. V., Sampson D. D., “Optical coherence elastography - OCT at work in tissue biomechanics [Invited],” Biomed. Opt. Express 8, 1172–1202 (2017). 10.1364/BOE.8.001172 - DOI - PMC - PubMed
    1. Nadler Z., Wang B., Wollstein G., Nevins J. E., Ishikawa H., Kagemann L., Sigal I. A., Ferguson R. D., Hammer D. X., Grulkowski I., Liu J. J., Kraus M. F., Lu C. D., Hornegger J., Fujimoto J. G., Schuman J. S., “Automated lamina cribrosa microstructural segmentation in optical coherence tomography scans of healthy and glaucomatous eyes,” Biomed. Opt. Express 4, 2596–2608 (2013). 10.1364/BOE.4.002596 - DOI - PMC - PubMed

LinkOut - more resources