. 2018 Jun 25;9(7):3266-3283.
doi: 10.1364/BOE.9.003266. eCollection 2018 Jul 1.

Weighting function effects in a direct regularization method for image-guided near-infrared spectral tomography of breast cancer

Affiliations

Weighting function effects in a direct regularization method for image-guided near-infrared spectral tomography of breast cancer

Jinchao Feng et al. Biomed Opt Express. .

Abstract

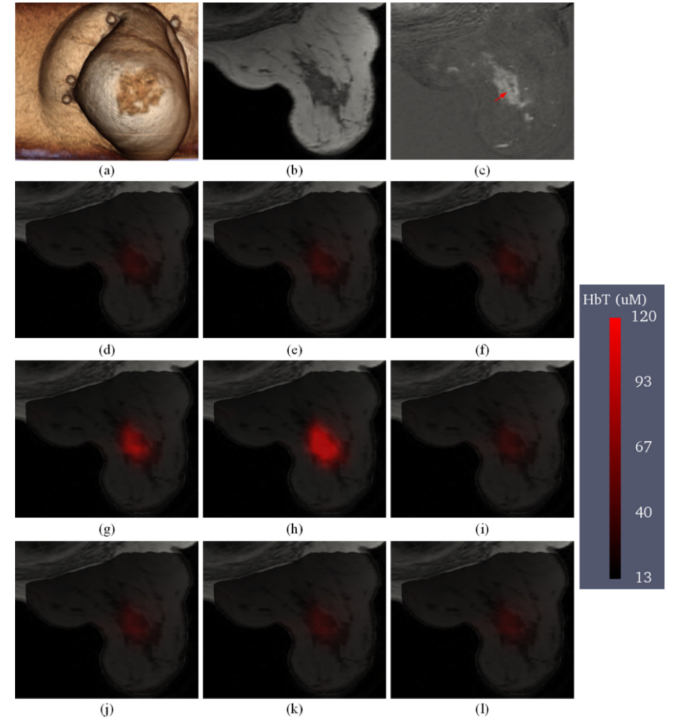
Structural image-guided near-infrared spectral tomography (NIRST) has been developed as a way to use diffuse NIR spectroscopy within the context of image-guided quantification of tissue spectral features. A direct regularization imaging (DRI) method for NIRST has the value of not requiring any image segmentation. Here, we present a comprehensive investigational study to analyze the impact of the weighting function implied when weighting the recovery of optical coefficients in DRI based NIRST. This was done using simulations, phantom and clinical patient exam data. Simulations where the true object is known indicate that changes to this weighting function can vary the contrast by 10%, the contrast to noise ratio by 20% and the full width half maximum (FWHM) by 30%. The results from phantoms and human images show that a linear inverse distance weighting function appears optimal, and that incorporation of this function can generally improve the recovered total hemoglobin contrast of the tumor to the normal surrounding tissue by more than 15% in human cases.

Keywords: (100.3010) Image reconstruction techniques; (170.3880) Medical and biological imaging; (170.6960) Tomography.


Conflict of interest statement

The authors declare that there are no conflicts of interest related to this article.

Figures

Fig. 1
Fig. 1
Plots of the 9 weighting functions used in Eq. (4) with normalized distance (x-axis) investigated in this study. a. u., arbitrary unit.
Fig. 2
Fig. 2
The geometries of the phantom (top row) and the corresponding MRI images (bottom row) used for the simulation studies 1 and 2. The absorption and scattering coefficients of a homogeneous phantom in study 1(a), and simulation study 2(b) were 0.01 mm−1 and 1.0 mm−1 in background and inclusions were 0.02 mm−1 and 1.0 mm−1, respectively.
Fig. 3
Fig. 3
(a) The MRI T1 image of the phantom and (b) a schematic of the sources and detectors setup. The red arrows represent fiducial markers, and ‘o’ and ‘x’ denote sources and detectors, respectively.
Fig. 4
Fig. 4
The reconstructed contrast with varied σg for 9 functions (a) and the profiles from the reconstructed images through the center of the inclusion and along the x-axis when σg = 0.01, (b) in simulation study 1.
Fig. 5
Fig. 5
Reconstructed images for different weighting functions. (a) - (i) are the reconstructed absorption images using different weighting functions (Function 1 to Function 9) in the case of two inclusions.
Fig. 6
Fig. 6
The profiles of reconstructed absorption coefficient from the reconstructed images in simulation study 2, which are through the centers of the inclusions and along the X-axis.
Fig. 7
Fig. 7
Resulting HbT images from a gelatin phantom with one inclusion was used for evaluation. The images were reconstructed with different weighting functions, as shown where (a) - (i) are the results using each of the Function 1 to Function 9, respectively.
Fig. 8
Fig. 8
The first patient example shown by: (a) 3D volume rendering; (b) T1 MRI; (c) DCE MRI; (d) - (l) are reconstructed HbT images overlaid on the T1 MRI cross-section using the Functions 1 to 9, respectively. The red arrow in (c) indicates the tumor.
Fig. 9
Fig. 9
The second patient example shown by: (a) 3D volume rendering; (b) T1 MRI; (c) DCE MRI; (d) - (l) are reconstructed HbT images overlaid on the T1 MRI cross-section using the Functions 1 to 9, respectively. The red arrows in (c) indicate the tumor location.
Fig. 10
Fig. 10
The plots of (a) ABE, (b) MSE, (c) PSNR and (d) CNR with increased target size in the single inclusion simulation experiment are shown.
Fig. 11
Fig. 11
The plots of CNR and HbT contrast with the truncated threshold value in the phantom experiment are shown, indicating an optimal threshold value at 0.3.

References

    1. Konecky S. D., Panasyuk G. Y., Lee K., Markel V., Yodh A. G., Schotland J. C., “Imaging complex structures with diffuse light,” Opt. Express 16(7), 5048–5060 (2008).10.1364/OE.16.005048 - DOI - PMC - PubMed
    1. Lim E. A., Gunther J. E., Kim H. K., Flexman M., Hibshoosh H., Crew K., Taback B., Campbell J., Kalinsky K., Hielscher A., Hershman D. L., “Diffuse optical tomography changes correlate with residual cancer burden after neoadjuvant chemotherapy in breast cancer patients,” Breast Cancer Res. Treat. 162(3), 533–540 (2017).10.1007/s10549-017-4150-7 - DOI - PMC - PubMed
    1. Feng J., Xu J., Jiang S., Yin H., Zhao Y., Gui J., Wang K., Lv X., Ren F., Pogue B. W., Paulsen K. D., “Addition of T2-guided optical tomography improves noncontrast breast magnetic resonance imaging diagnosis,” Breast Cancer Res. 19(1), 117 (2017).10.1186/s13058-017-0902-x - DOI - PMC - PubMed
    1. Franceschini M. A., Boas D. A., “Noninvasive measurement of neuronal activity with near-infrared optical imaging,” Neuroimage 21(1), 372–386 (2004).10.1016/j.neuroimage.2003.09.040 - DOI - PMC - PubMed
    1. Lee C. W., Cooper R. J., Austin T., “Diffuse optical tomography to investigate the newborn brain,” Pediatr. Res. 82(3), 376–386 (2017).10.1038/pr.2017.107 - DOI - PubMed

LinkOut - more resources