Comparative Study
. 2018 May 8:19:538-550.
doi: 10.1016/j.nicl.2018.05.004. eCollection 2018.

Comparison of probabilistic tractography and tract-based spatial statistics for assessing optic radiation damage in patients with autoimmune inflammatory disorders of the central nervous system

Affiliations
Comparative Study

Comparison of probabilistic tractography and tract-based spatial statistics for assessing optic radiation damage in patients with autoimmune inflammatory disorders of the central nervous system

Joseph Kuchling et al. Neuroimage Clin. .

Abstract

Background: Diffusion Tensor Imaging (DTI) can evaluate microstructural tissue damage in the optic radiation (OR) of patients with clinically isolated syndrome (CIS), early relapsing-remitting multiple sclerosis and neuromyelitis optica spectrum disorders (NMOSD). Different post-processing techniques, e.g. tract-based spatial statistics (TBSS) and probabilistic tractography, exist to quantify this damage.

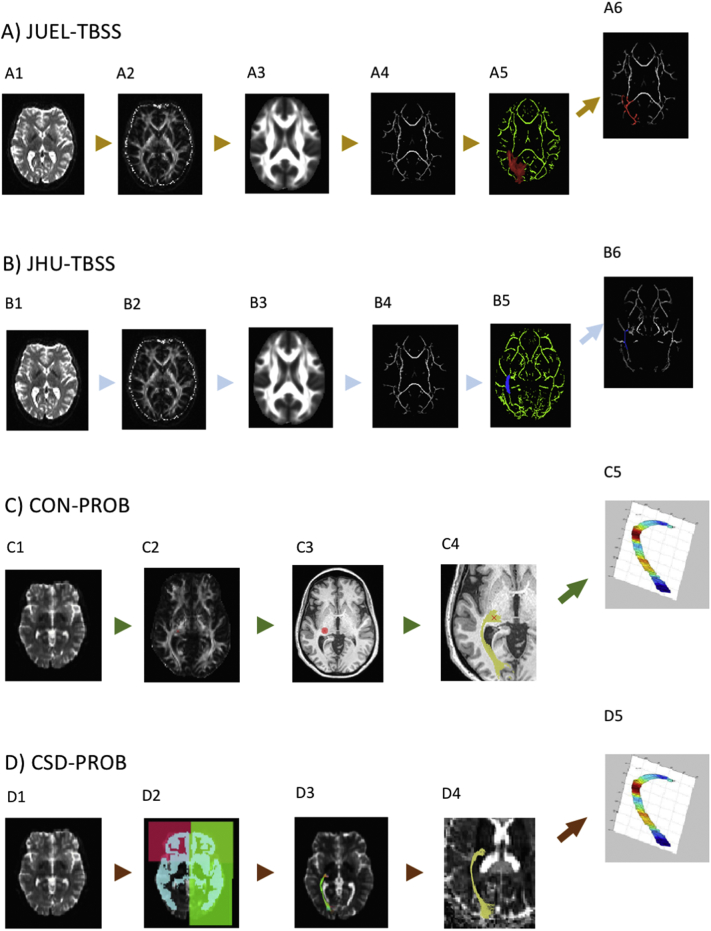
Objective: To evaluate the capacity of TBSS-based atlas region-of-interest (ROI) combination with 1) posterior thalamic radiation ROIs from the Johns Hopkins University atlas (JHU-TBSS), 2) Juelich Probabilistic ROIs (JUEL-TBSS) and tractography methods using 3) ConTrack (CON-PROB) and 4) constrained spherical deconvolution tractography (CSD-PROB) to detect OR damage in patients with a) NMOSD with prior ON (NMOSD-ON), b) CIS and early RRMS patients with ON (CIS/RRMS-ON) and c) CIS and early RRMS patients without prior ON (CIS/RRMS-NON) against healthy controls (HCs).

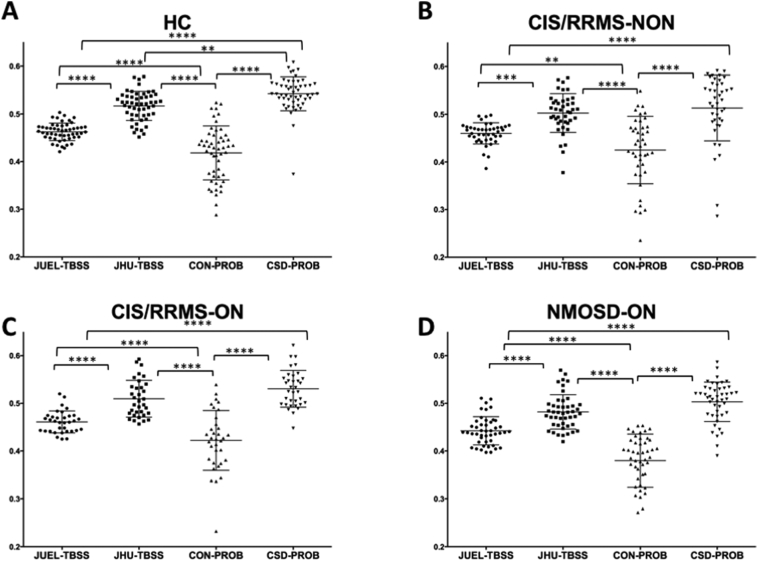
Methods: Twenty-three NMOSD-ON, 18 CIS/RRMS-ON, 21 CIS/RRMS-NON, and 26 HCs underwent 3 T MRI. DTI data analysis was carried out using JUEL-TBSS, JHU-TBSS, CON-PROB and CSD-PROB. Optical coherence tomography (OCT) and visual acuity testing was performed in the majority of patients and HCs.

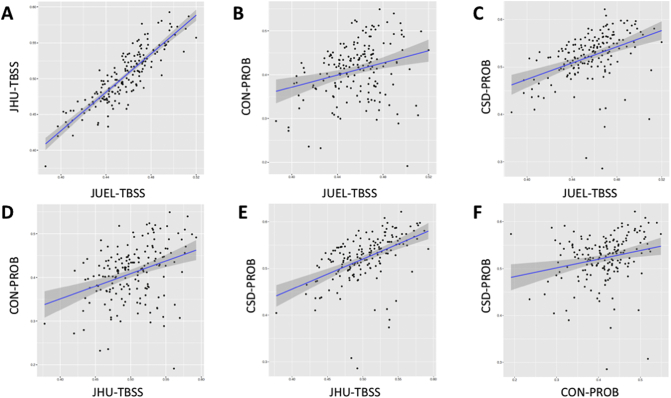
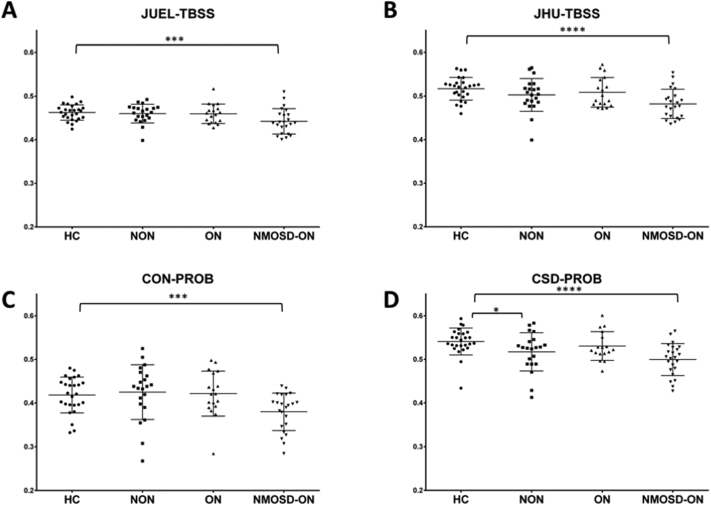
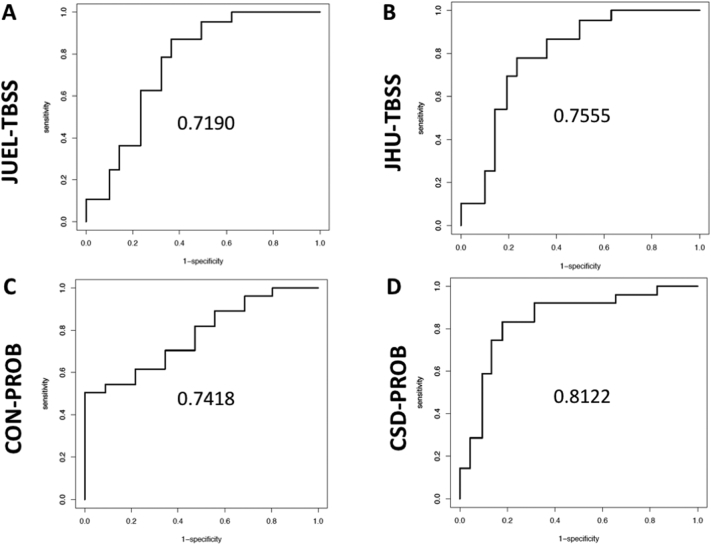
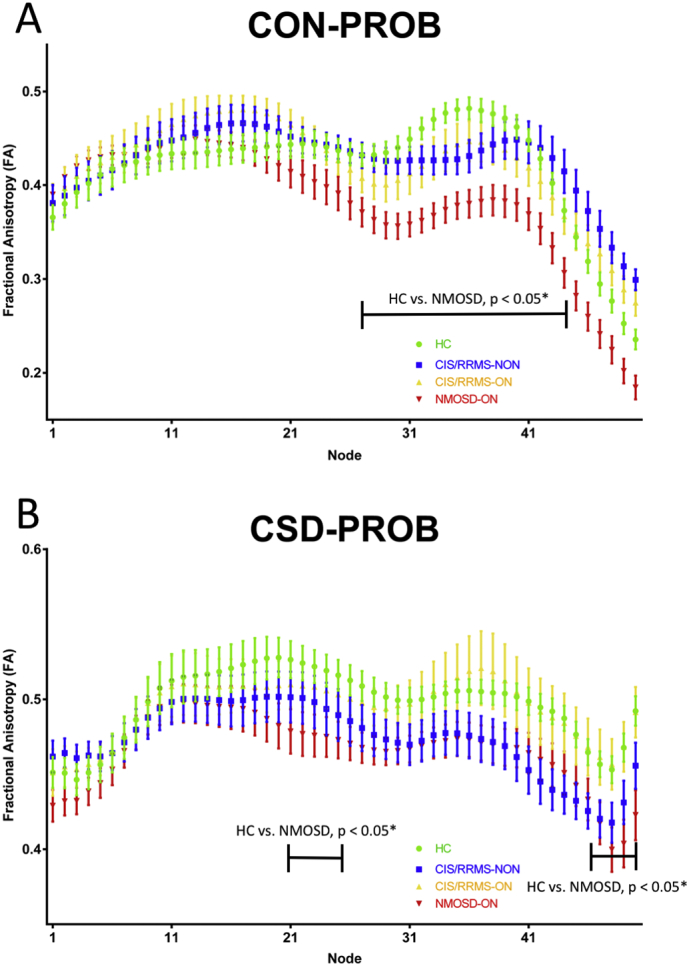
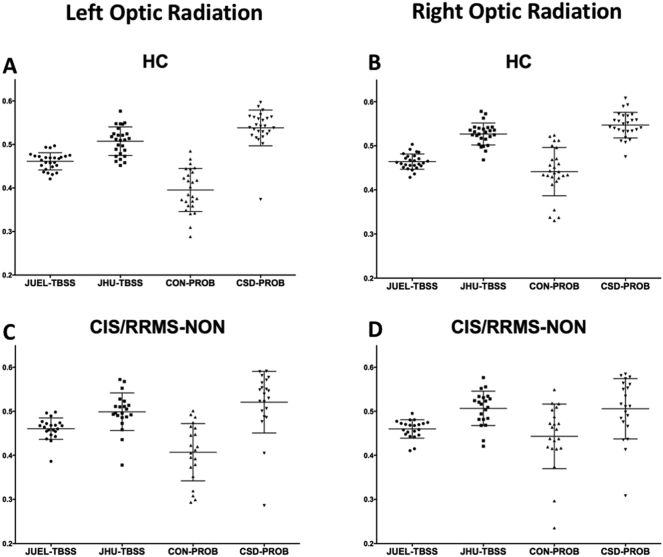
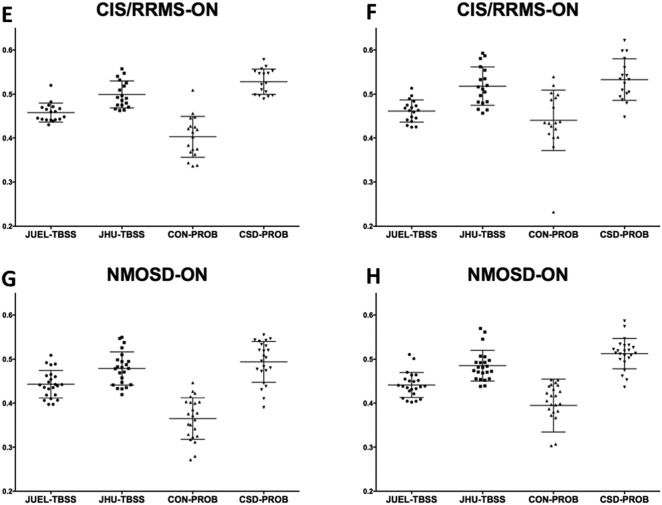
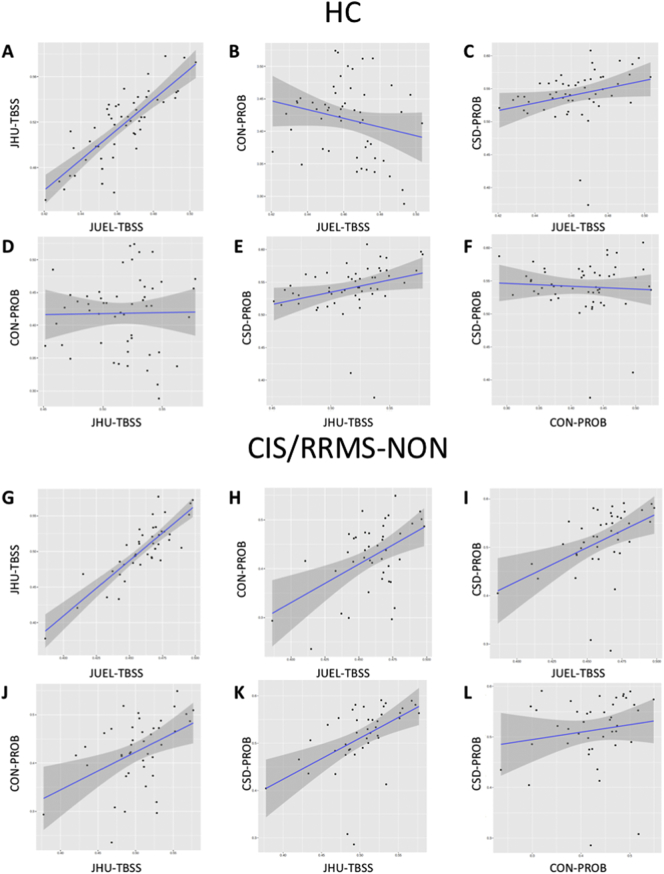
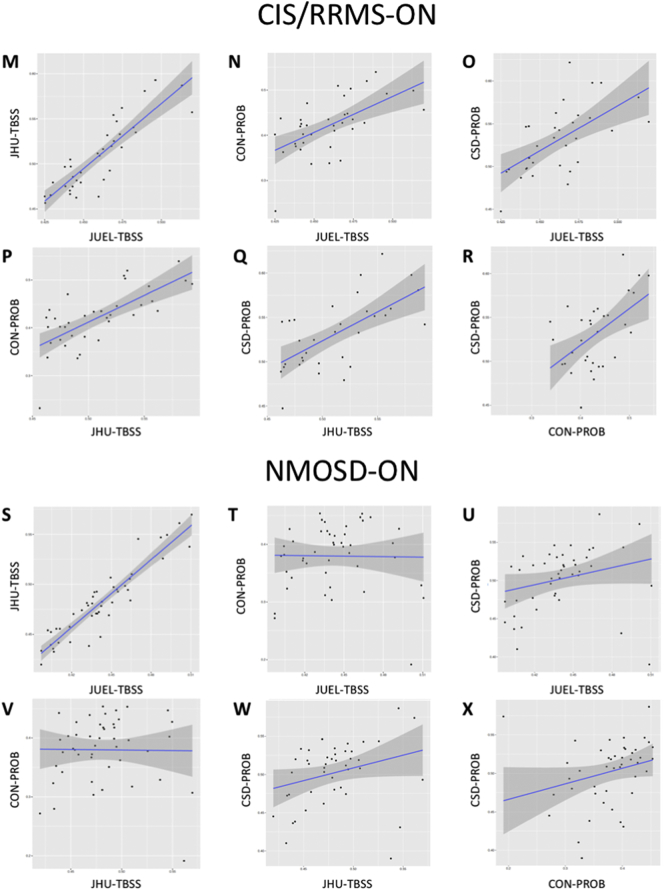
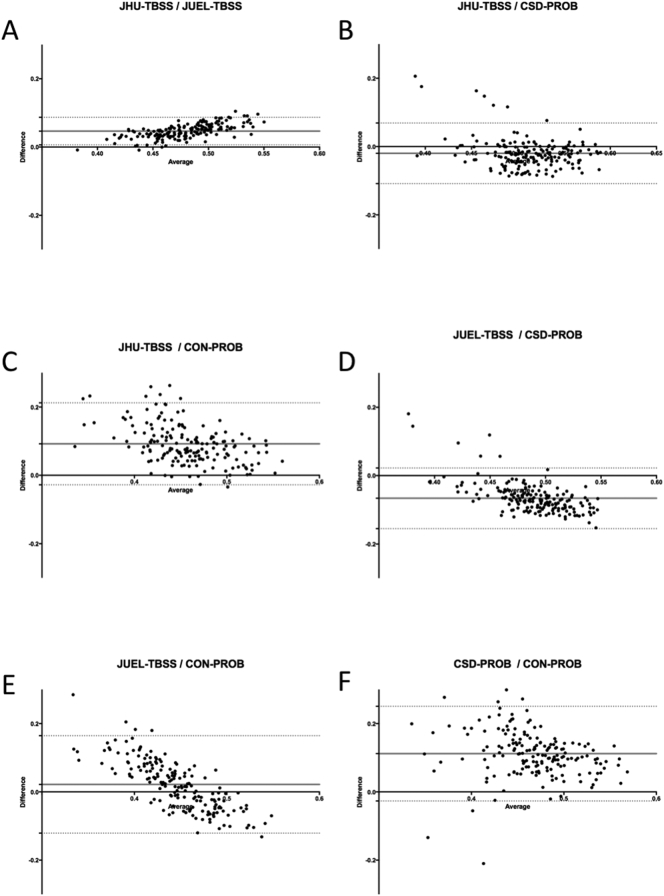
Results: Absolute OR fractional anisotropy (FA) values differed between all methods but showed good correlation and agreement in Bland-Altman analysis. OR FA values between NMOSD and HC differed throughout the methodologies (p-values ranging from p < 0.0001 to 0.0043). ROC-analysis and effect size estimation revealed higher AUCs and R2 for CSD-PROB (AUC = 0.812; R2 = 0.282) and JHU-TBSS (AUC = 0.756; R2 = 0.262), compared to CON-PROB (AUC = 0.742; R2 = 0.179) and JUEL-TBSS (AUC = 0.719; R2 = 0.161). Differences between CIS/RRMS-NON and HC were only observable in CSD-PROB (AUC = 0.796; R2 = 0.094). No significant differences between CIS/RRMS-ON and HC were detected by any of the methods.

Conclusions: All DTI post-processing techniques facilitated the detection of OR damage in patient groups with severe microstructural OR degradation. The comparison of distinct disease groups by use of different methods may lead to different - either false-positive or false-negative - results. Since different DTI post-processing approaches seem to provide complementary information on OR damage, application of distinct methods may depend on the relevant research question.

Keywords: AD, axial diffusivity; AUC, area under the curve; CIS, clinically isolated syndrome; CON, Contrack; CSD, constrained spherical deconvolution; DTI; DTI, diffusion tensor imaging; DW-MRI, diffusion weighted magnetic resonance imaging; DWI, diffusion weighted imaging; FA, fractional anisotropy; FOD, fiber orientation distribution; HC, Healthy Control; JHU, Johns Hopkins University DTI white matter atlas; JUEL, Juelich histological atlas; LGN, lateral geniculate nucleus; MD, mean diffusivity; MS, multiple sclerosis; Multiple sclerosis; NMOSD, neuromyelitis optica spectrum disorder; Neuromyelitis optica; OCT, optical coherence tomography; ON, optic neuritis; OR, optic radiation; Optic radiation; PROB, probabilistic tractography; Probabilistic tractography; RD, radial diffusivity; RNFL, retinal nerve fiber layer thickness; ROC, receiver operating characteristic; ROI, region of interest; RRMS, relapsing-remitting multiple sclerosis; SD, standard deviation; SEM, standard error of the mean; TBSS; TBSS, tract-based spatial statistics.


Figures

Fig. 2
Fig. 2
Correlation of all FA values regarding each method. Correlation of all OR FA values assessing A JUEL-TBSS vs. JHU-TBSS, B JUEL-TBSS vs. CON-PROB, C JUEL-TBSS vs. CSD-PROB, D JHU-TBSS vs. CON-PROB, E JHU-TBSS vs. CSD-PROB, F CON-PROB vs. CSD-PROB. JUEL-TBSS = Juelich-based atlas ROI TBSS approach; JHU-TBSS = Johns-Hopkins University posterior thalamic radiation ROI TBSS approach; CON-PROB = ConTrack-based probabilistic tractography. CSD-PROB = constrained spherical deconvolution based probabilistic tractography. TBSS = tract-based spatial statistics; OR = optic radiation.
Fig. 1
Fig. 1
Absolute FA values of different DTI post-processing methods. Optic radiation FA values are shown for A healthy controls (HC), B CIS patients without prior optic neuritis, C CIS patients with optic neuritis in their medical history and D NMOSD-ON patients. Comparison of FA distribution yielded significant differences between all methods except for the comparison of JHU-TBSS and CSD-PROB in CIS/RRMS-NON, CIS/RRMS-ON and NMOSD-ON patients. JUEL-TBSS = Juelich-based atlas ROI TBSS approach; JHU-TBSS = Johns-Hopkins University posterior thalamic radiation ROI TBSS approach; CON-PROB = ConTrack-based probabilistic tractography. CSD-PROB = constrained spherical deconvolution based probabilistic tractography. TBSS = tract-based spatial statistics.
Fig. 3
Fig. 3
OR mean FA comparison of patient groups and HCs arranged by methods. Mean FA distribution of individual TBSS skeletons within JUEL-TBSS (A) and JHU-TBSS (B). Both approaches show significant differences between HC and NMOSD group. JHU also shows significant differences between NMOSD and all CIS groups and differences between HC and CIS and HC and CIS/RRMS-NON. Comparison of weighted mean FA distribution within CON-PROB tracts (C) and CSD-PROB OR fibers (D) reveal similar significant differences between HC and NMOSD and NMOSD with all CIS/RRMS-subgroups. CSD-PROB also reveals significant differences between HC and all CIS-subgroups. FA = fractional anisotropy; HC = healthy controls; OR = optic radiation; TBSS = tract-based spatial statistics; JHU = Johns Hopkins University; ROI = region of interest; CSD = constrained spherical deconvolution; NMOSD = neuromyelitis optica spectrum disorder. * p < 0.05; ** p < 0.005; *** p < 0.0005; **** p < 0.0001.
Fig. 4
Fig. 4
ROC curves and AUCs for TBSS and CSD-based analysis methods. ROC curves and AUCs are displayed comparing HC with NMOSD corrected for age by use of A JUEL-TBSS, B JHU-TBSS, C CON-PROB and D CSD-PROB. ROC = receiver operating characteristics; AUC = area under the curve; HC = healthy controls; NMOSD = neuromyelitis optica spectrum disorder; TBSS = tract-based spatial statistics; CSD = constrained spherical deconvolution; JHU = Johns Hopkins University.
Fig. 5
Fig. 5
Tract profiles of the optic radiation in different patient groups. OR partitioning into 50 equally divided nodes in NMOSD (red), CIS/RRMS-ON (orange) and CIS/RRMS-NON (yellow) patients and Healthy controls (green) using (A) Contrack-based probabilistic tractography (B) CSD-based tractography. OR = optic radiation; CIS = clinically isolated syndrome; ON = optic neuritis; CSD = constrained spherical deconvolution; NMOSD = neuromyelitis optica spectrum disorder; FA = fractional anisotropy.
Fig. S1
Fig. S1
Image processing pipelines. A and B: JUEL-TBSS and JHU-TBSS - Using (A1 and B1) raw DW imaging data, (A2 and B2) FA maps were created by fitting a tensor model. After (A3 and B3) brain-extraction a mean FA image was created and thinned to produce a mean FA skeleton. (A4 and B4) Each subject's aligned FA data was then projected onto this skeleton. Either (A5) Juelich probabilistic atlas ROI with FA skeleton mask was applied (JUEL-TBSS) and (A6) thresholded, excluding the lower 10%, or (B5) JHU posterior thalamic radiation atlas ROI combined with FA skeleton mask was applied on each subject's aligned FA data (B6) to generate the mean FA. C: CON-PROB - (C1) Raw DW imaging data were used to calculate (C2) FA maps within vistalab environment. (C3) LGN ROI was placed manually and (C4) optic radiation was calculated using Contrack algorithm. (C5) Resulting fibers were used to compute tract profiling diffusion properties. D: CSD-PROB - Maps of fiber orientation distribution (D1) were calculated using CSD from DW image. (D2) Juelich atlas based LGN and V1 ROI were used as seed mask and target masks. Additionally, sagittal, coronal and grey matter exclusion ROIs were registered from MNI152 to registered from atlas to individual DWI space. (D3) A set of 10.000 streamlines was generated and a threshold of 25% of the maximum value was applied. Resulting fibers were (D4) transferred to Vistalab environment to (D5) compute tract profiling diffusion properties.
Fig. S2
Fig. S2
Absolute FA values of different DTI post-processing methods within each subject group. FA values of left and right optic radiation are shown for separately for Optic radiation FA values are shown for A and B healthy controls (HC), C and D CIS/RRMS patients without prior optic neuritis, E and F CIS/RRMS patients with optic neuritis in their medical history and G and H NMOSD-ON patients. JUEL-TBSS = Juelich-based atlas ROI TBSS approach; JHU-TBSS = Johns-Hopkins University posterior thalamic radiation ROI TBSS approach; CON-PROB = ConTrack-based probabilistic tractography. CSD-PROB = constrained spherical deconvolution based probabilistic tractography. TBSS = tract-based spatial statistics.
Fig. S2
Fig. S2
Absolute FA values of different DTI post-processing methods within each subject group. FA values of left and right optic radiation are shown for separately for Optic radiation FA values are shown for A and B healthy controls (HC), C and D CIS/RRMS patients without prior optic neuritis, E and F CIS/RRMS patients with optic neuritis in their medical history and G and H NMOSD-ON patients. JUEL-TBSS = Juelich-based atlas ROI TBSS approach; JHU-TBSS = Johns-Hopkins University posterior thalamic radiation ROI TBSS approach; CON-PROB = ConTrack-based probabilistic tractography. CSD-PROB = constrained spherical deconvolution based probabilistic tractography. TBSS = tract-based spatial statistics.
Fig. S3
Fig. S3
Correlation of FA values of each method by subject group. Correlation of OR FA values of every method (JUEL-TBSS vs. JHU-TBSS; JUEL-TBSS vs. CON-PROB; JUEL-TBSS vs. CSD-PROB; JHU-TBSS vs. CON-PROB; JHU-TBSS vs. CSD-PROB; CON-PROB vs. CSD-PROB) by subject groups HC (AF), CIS/RRMS-NON (GL), CIS/RRMS-ON (MR), and NMOSD-ON (SX). JUEL-TBSS = Juelich-based atlas ROI TBSS approach; JHU-TBSS = Johns-Hopkins University posterior thalamic radiation ROI TBSS approach; CON-PROB = ConTrack-based probabilistic tractography. CSD-PROB = constrained spherical deconvolution based probabilistic tractography. TBSS = tract-based spatial statistics; OR = optic radiation; HC = healthy controls; CIS/RRMS-NON = CIS patients with no prior optic neuritis; CIS/RRMS-ON = CIS patients with prior optic neuritis; NMOSD-ON = Neuromyelitis optica spectrum disorder patients with prior optic neuritis.
Fig. S3
Fig. S3
Correlation of FA values of each method by subject group. Correlation of OR FA values of every method (JUEL-TBSS vs. JHU-TBSS; JUEL-TBSS vs. CON-PROB; JUEL-TBSS vs. CSD-PROB; JHU-TBSS vs. CON-PROB; JHU-TBSS vs. CSD-PROB; CON-PROB vs. CSD-PROB) by subject groups HC (AF), CIS/RRMS-NON (GL), CIS/RRMS-ON (MR), and NMOSD-ON (SX). JUEL-TBSS = Juelich-based atlas ROI TBSS approach; JHU-TBSS = Johns-Hopkins University posterior thalamic radiation ROI TBSS approach; CON-PROB = ConTrack-based probabilistic tractography. CSD-PROB = constrained spherical deconvolution based probabilistic tractography. TBSS = tract-based spatial statistics; OR = optic radiation; HC = healthy controls; CIS/RRMS-NON = CIS patients with no prior optic neuritis; CIS/RRMS-ON = CIS patients with prior optic neuritis; NMOSD-ON = Neuromyelitis optica spectrum disorder patients with prior optic neuritis.
Fig. S4
Fig. S4
Bland-Altman analysis of mean FA values comparing all methods. Bland-Altman analysis of individual FA values from all subjects including both left and right OR. Middle lines indicate mean differences and dashed lines are limits of agreement. A JUEL-TBSS and JHU-TBSS OR ROI masking; B TBSS-JHU and CSD-PROB; C JHU-TBSS and CON-PROB; D JUEL-TBSS and CSD-PROB; E JUEL-TBSS and CON-PROB; F CSD-PROB and CON-PROB. JUEL-TBSS = Juelich-based atlas ROI TBSS approach; JHU-TBSS = Johns-Hopkins University posterior thalamic radiation ROI TBSS approach; CON-PROB = ConTrack-based probabilistic tractography. CSD-PROB = constrained spherical deconvolution based probabilistic tractography. TBSS = tract-based spatial statistics; OR = optic radiation.

Similar articles

Cited by

References

    1. Andersson J.L.R., Sotiropoulos S.N. An integrated approach to correction for off-resonance effects and subject movement in diffusion MR imaging. NeuroImage. 2016;125:1063–1078. - PMC - PubMed
    1. Assaf Y., Pasternak O. Diffusion tensor imaging (DTI)-based white matter mapping in brain research: a review. J. Mol. Neurosci. 2008;34:51–61. - PubMed
    1. Auriat A.M., Borich M.R., Snow N.J., Wadden K.P., Boyd L.A. Comparing a diffusion tensor and non-tensor approach to white matter fiber tractography in chronic stroke. NeuroImage Clin. 2015;7:771–781. - PMC - PubMed
    1. Backner Y., Kuchling J., Massarwa S., Oberwahrenbrock T., Finke C., Bellmann-Strobl J., Ruprecht K., Brandt A.U., Zimmermann H., Raz N., Paul F., Levin N. Anatomical wiring and functional networking changes in the visual system following optic neuritis. JAMA Neurol. 2018 - PMC - PubMed
    1. Balcer L.J., Miller D.H., Reingold S.C., Cohen J.A. Vision and vision-related outcome measures in multiple sclerosis. Brain. 2015;138:11–27. - PMC - PubMed

Publication types

LinkOut - more resources