. 2018 Aug 1;128(8):3382-3401.
doi: 10.1172/JCI94351. Epub 2018 Jul 9.

Clarin-1 gene transfer rescues auditory synaptopathy in model of Usher syndrome

Affiliations

Clarin-1 gene transfer rescues auditory synaptopathy in model of Usher syndrome

Didier Dulon et al. J Clin Invest. .

Abstract

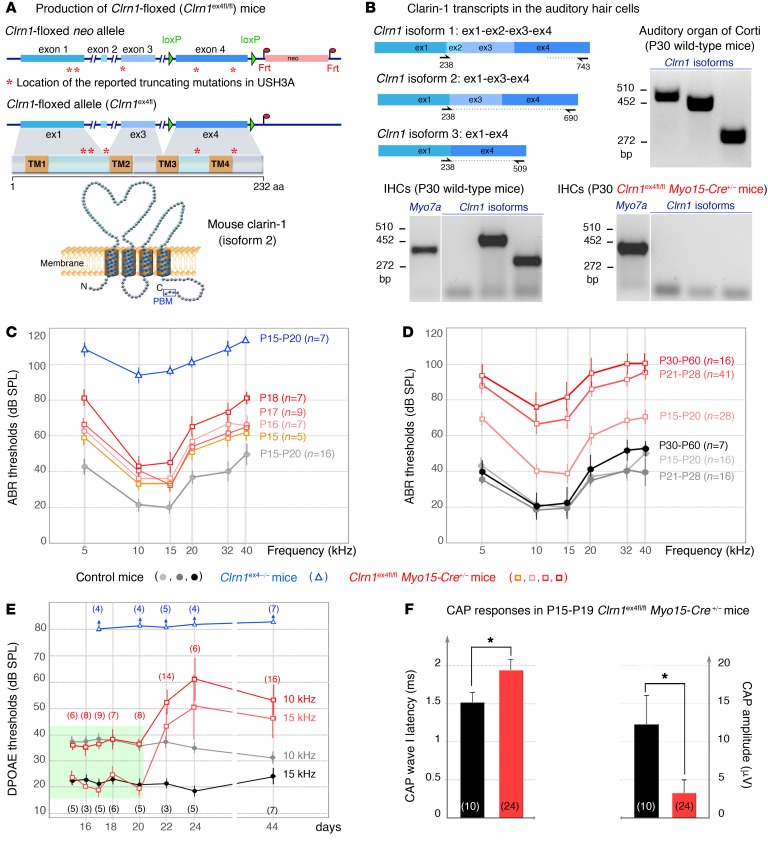
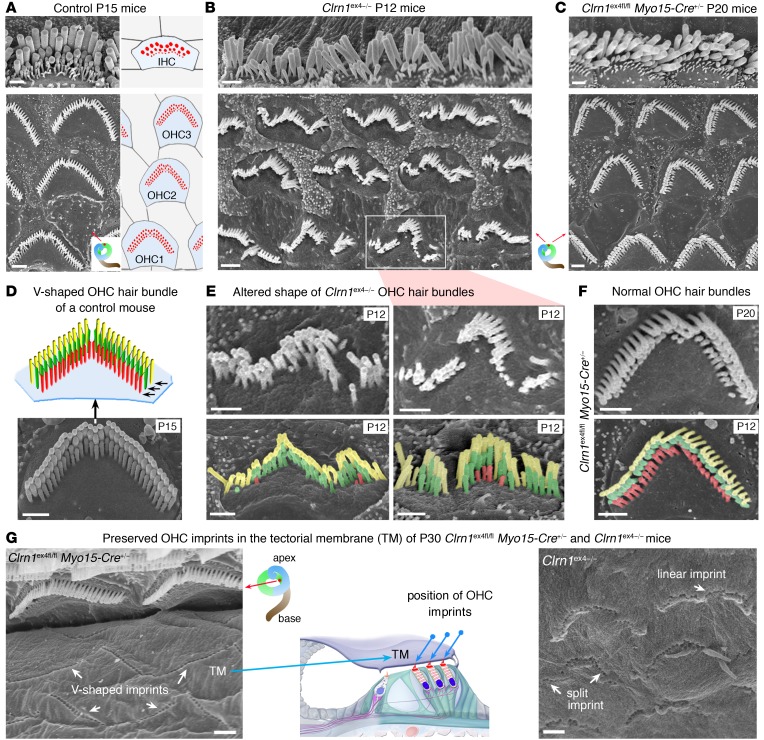
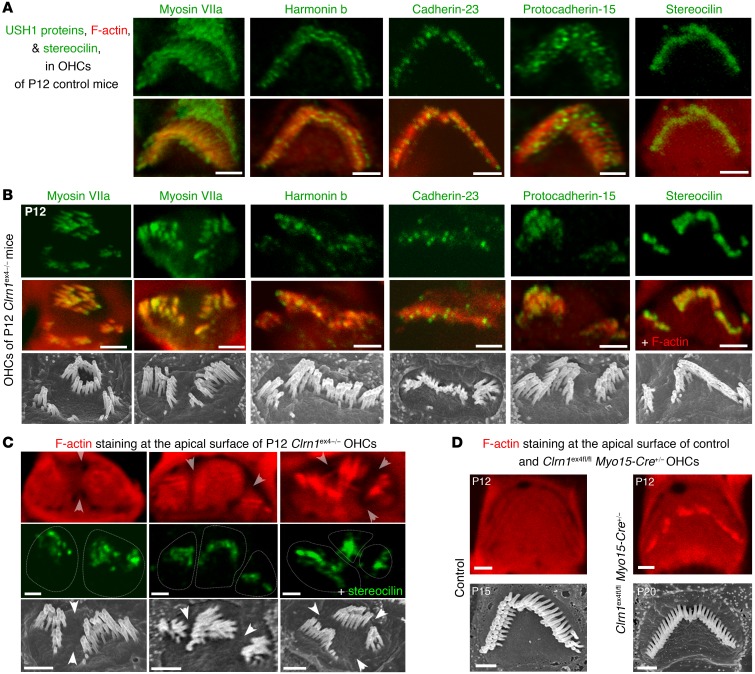
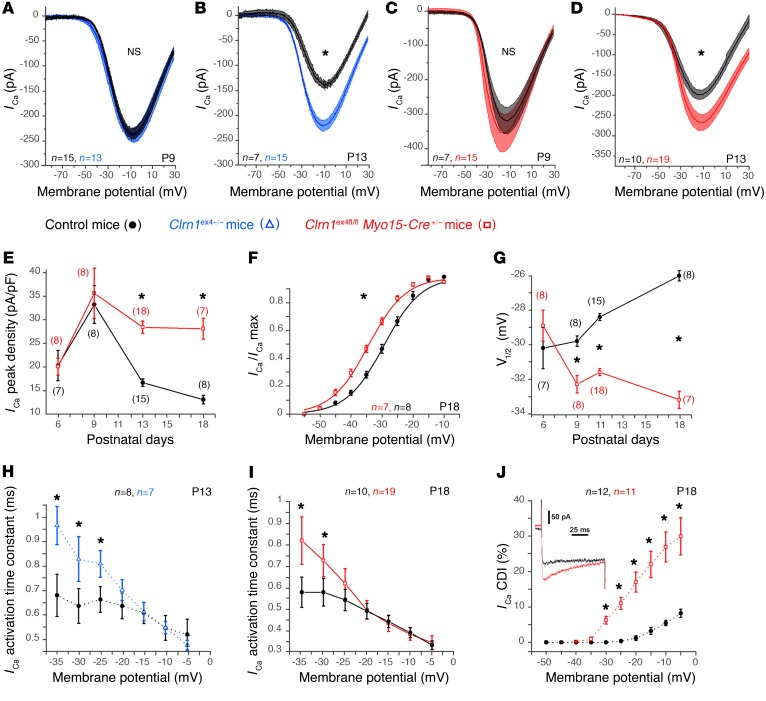
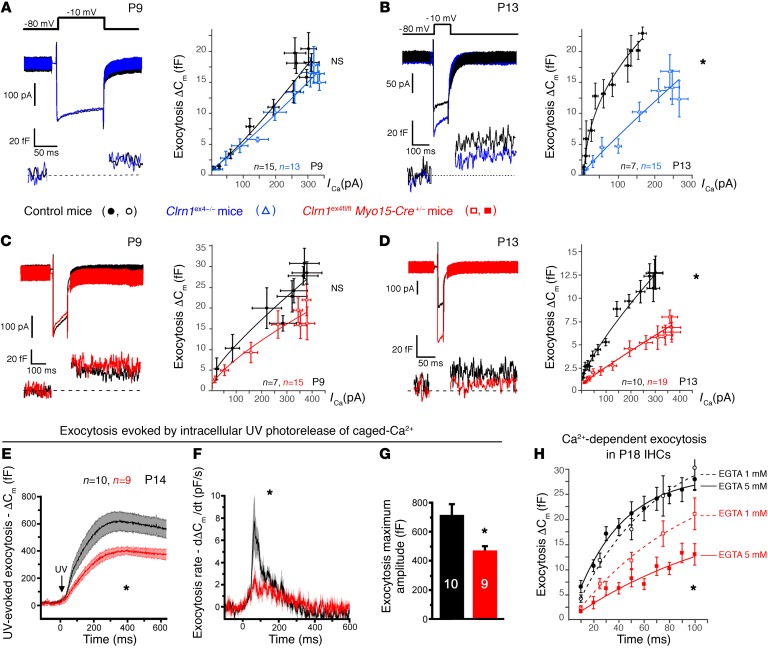
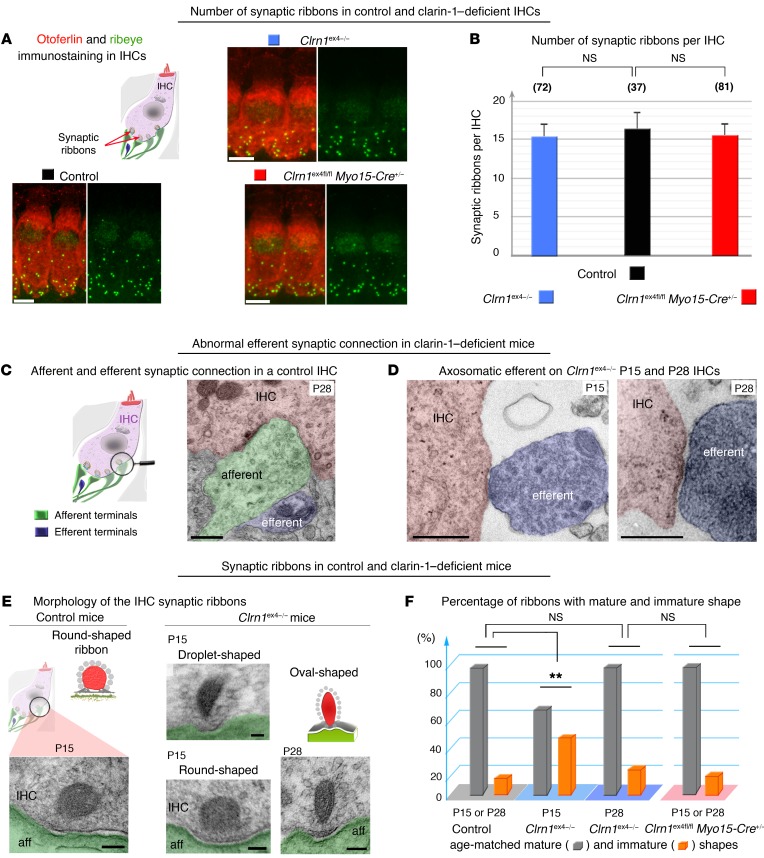
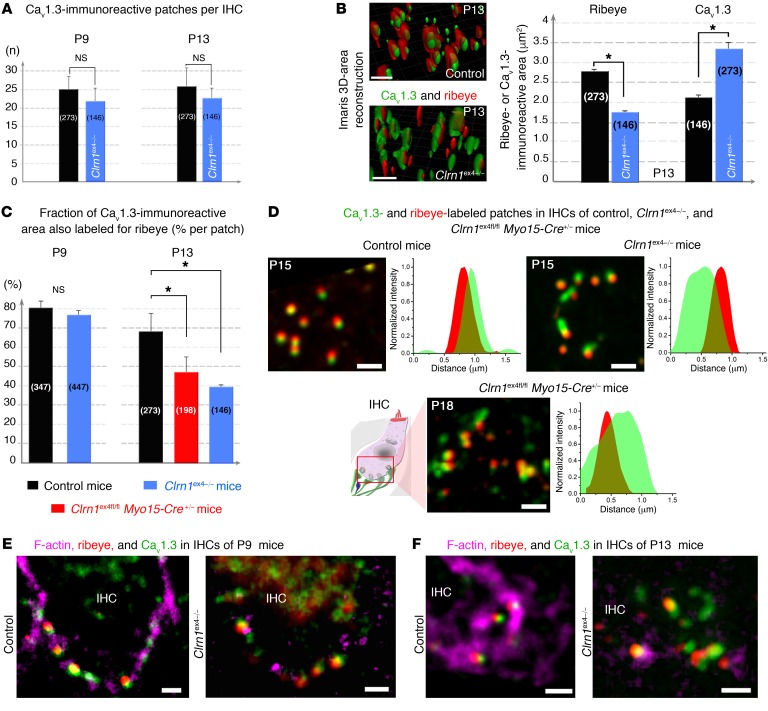
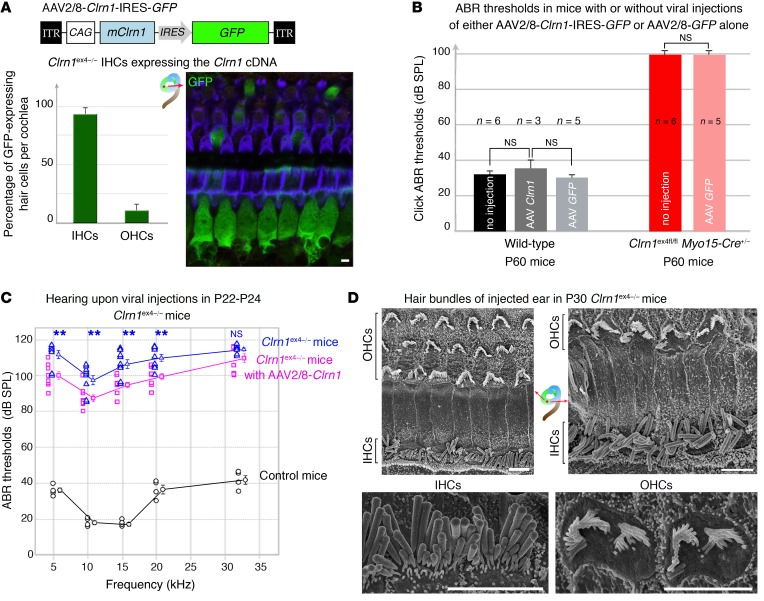
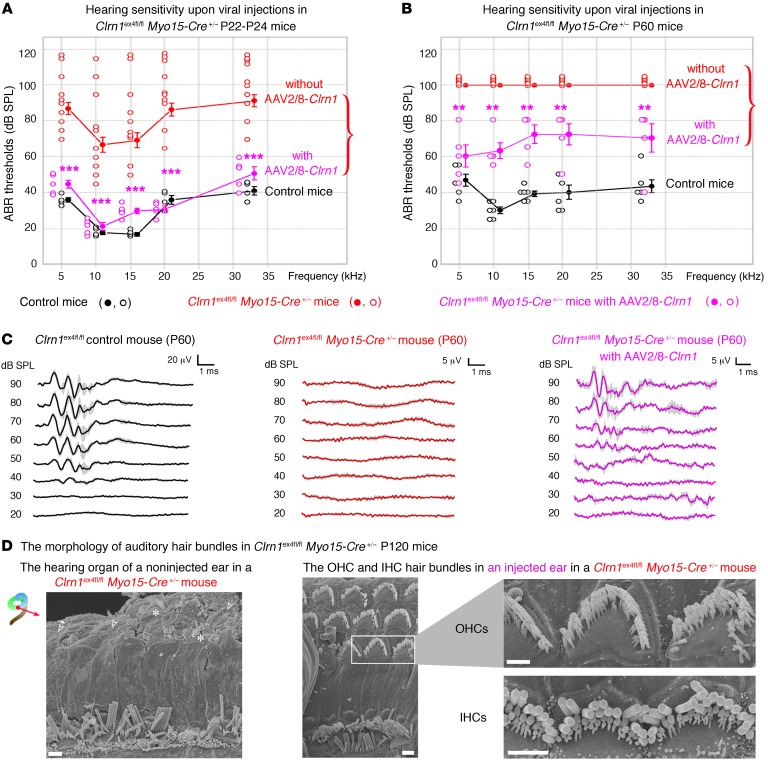
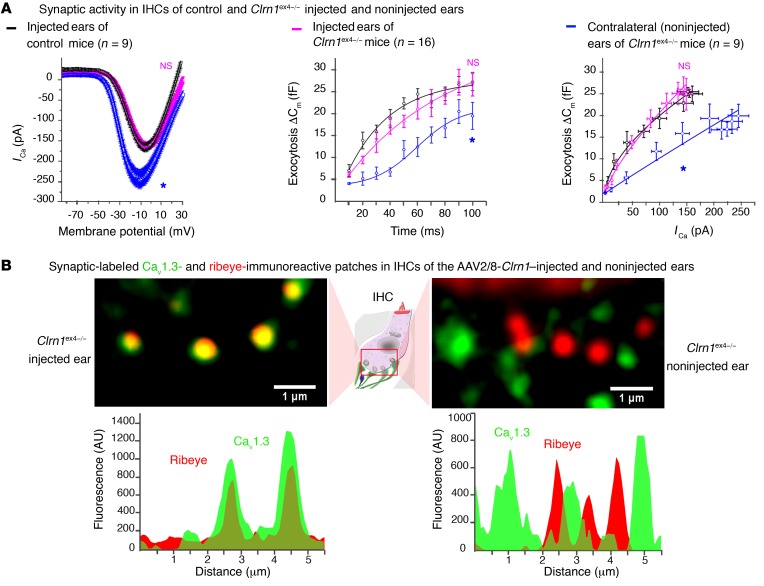
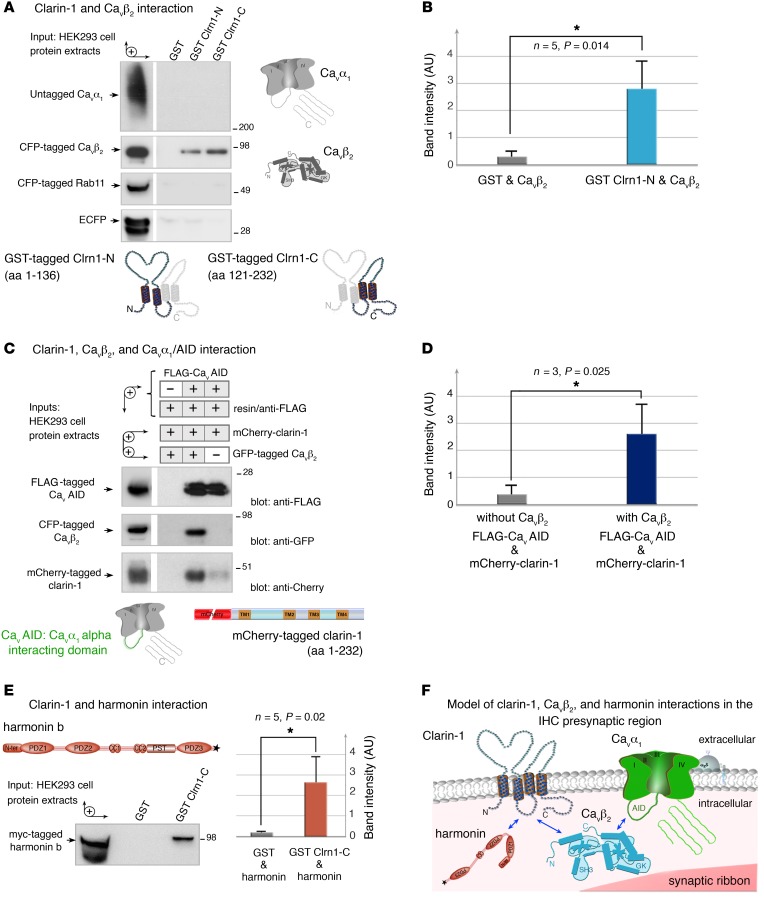
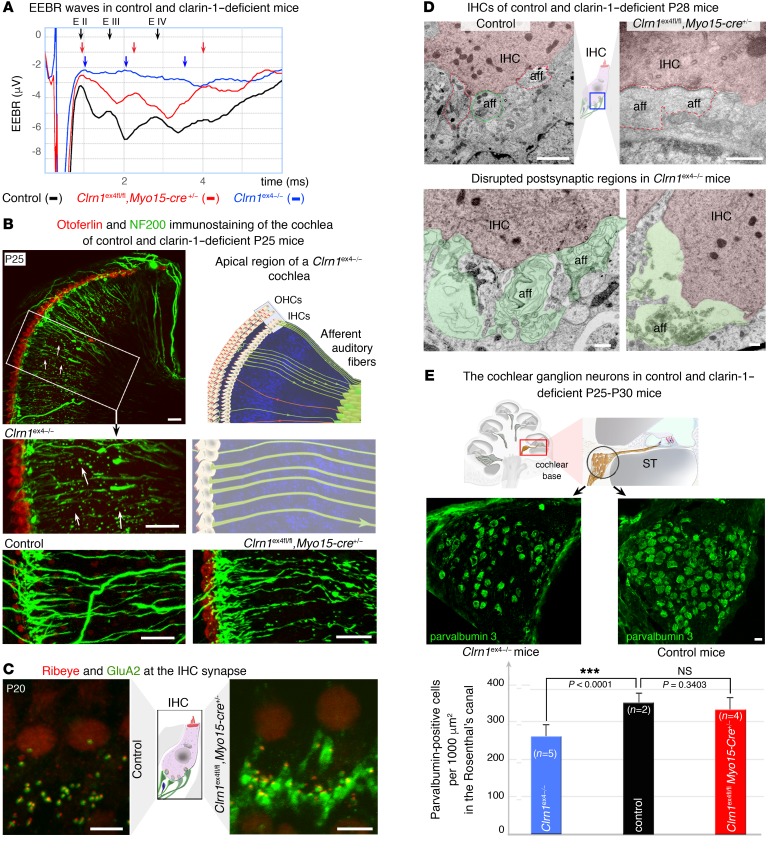
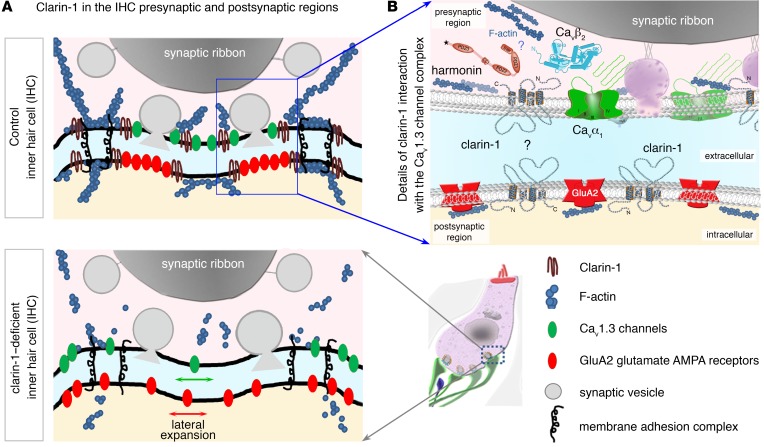
Clarin-1, a tetraspan-like membrane protein defective in Usher syndrome type IIIA (USH3A), is essential for hair bundle morphogenesis in auditory hair cells. We report a new synaptic role for clarin-1 in mouse auditory hair cells elucidated by characterization of Clrn1 total (Clrn1ex4-/-) and postnatal hair cell-specific conditional (Clrn1ex4fl/fl Myo15-Cre+/-) knockout mice. Clrn1ex4-/- mice were profoundly deaf, whereas Clrn1ex4fl/fl Myo15-Cre+/- mice displayed progressive increases in hearing thresholds, with, initially, normal otoacoustic emissions and hair bundle morphology. Inner hair cell (IHC) patch-clamp recordings for the 2 mutant mice revealed defective exocytosis and a disorganization of synaptic F-actin and CaV1.3 Ca2+ channels, indicative of a synaptopathy. Postsynaptic defects were also observed, with an abnormally broad distribution of AMPA receptors associated with a loss of afferent dendrites and defective electrically evoked auditory brainstem responses. Protein-protein interaction assays revealed interactions between clarin-1 and the synaptic CaV1.3 Ca2+ channel complex via the Cavβ2 auxiliary subunit and the PDZ domain-containing protein harmonin (defective in Usher syndrome type IC). Cochlear gene therapy in vivo, through adeno-associated virus-mediated Clrn1 transfer into hair cells, prevented the synaptic defects and durably improved hearing in Clrn1ex4fl/fl Myo15-Cre+/- mice. Our results identify clarin-1 as a key organizer of IHC ribbon synapses, and suggest new treatment possibilities for USH3A patients.

Keywords: Calcium channels; Gene therapy; Neuroscience; Synapses.


Conflict of interest statement

Conflict of interest: The authors have declared that no conflict of interest exists.

Figures

Figure 1
Figure 1. Auditory thresholds in Clrn1ex4–/– and Clrn1ex4fl/fl Myo15-Cre+/– mice.
(A) The Clrn1-floxed mice (Clrn1ex4fl/fl) were engineered by addition of loxP sites on either side of exon 4. Clrn1ex4fl/fl mice were crossed with PGK-Cre+/– mice to achieve the early and ubiquitous elimination of clarin-1 (Clrn1ex4–/– mice), and with Myo15-Cre+/– mice to target clarin-1 elimination specifically to hair cells at postnatal stages (Clrn1ex4fl/fl Myo15-Cre+/– mice). A topological representation of the murine clarin-1, a protein containing 4 transmembrane domains with a C-terminal type II PDZ-binding motif (PBM, boxed), is shown. (B) RT-PCR shows mRNA expression of Clrn1 isoforms 1, 2, and 3 in the organ of Corti (P30) and only isoform 2 and 3 in P30 WT IHCs. Note that the expression of all isoforms is absent in P30 IHCs from Clrn1ex4fl/fl Myo15-Cre+/– (see uncut gels in supplemental material). (C) ABR thresholds in Clrn1ex4fl/fl Myo15-Cre+/– mice (light orange to dark red curves; mean ± SD) show a progressive increase between P15 and P18. A gray curve (control mice) and a blue curve (Clrn1ex4–/– mice) for P15–P20 are also shown. (D) In Clrn1ex4fl/fl Myo15-Cre+/– mice (red), ABR thresholds (mean ± SD) progressively increase to reach severe deafness at P21–P28 as compared with those in control mice (gray-black). (E) DPOAEs are absent in Clrn1ex4–/– mice (blue) as early as P15. By contrast, Clrn1ex4fl/fl Myo15-Cre+/– mice (red) display unaffected DPOAE thresholds up to P20 (green area). From P20 onward, DPOAE thresholds slowly increase by about 20–30 dB SPL. (F) Compound action potential (CAP) responses on P15–P19. CAPs were produced by 10-kHz, 95-dB-SPL, tone bursts. Bar charts represent CAP wave I latency and amplitude, which are significantly delayed and reduced, respectively, in Clrn1ex4fl/fl Myo15-Cre+/– mice. *P < 0.05 (2-tailed unpaired t test with Welch’s correction, n in the figure).
Figure 2
Figure 2. Architecture of the hearing organ in Clrn1ex4–/– mice and Clrn1ex4fl/fl Myo15-Cre+/– mice.
(AF) Hair bundle structure is affected in Clrn1ex4–/– mice but not in Clrn1ex4fl/fl Myo15-Cre+/– mice. Throughout the spiral cochlea, the OHC hair bundles of Clrn1ex4–/– mice are linear, wavy, and/or hooked in shape (B and E), contrasting with the V-shaped hair bundles in control (A and D) and Clrn1ex4fl/fl Myo15-Cre+/– (C and F) mice. Note that the upper image of IHCs in C is a crop of Supplemental Figure 3A (lower portion of P20 panel). Similar hair bundle abnormalities were observed along the entire cochlear axis between P12 and P25 (images representative of 12 mice). The stereocilia of the short row (colored in red) regressed entirely in most of the OHCs of P12 Clrn1ex4–/– mice (E), but not in those of P20 Clrn1ex4fl/fl Myo15-Cre+/– mice (F). (G) The physical coupling between the tallest stereocilia of OHCs and the overlying tectorial membrane (TM) was preserved in both Clrn1ex4–/– and Clrn1ex4fl/fl Myo15-Cre+/– mice, as shown by the presence of imprints of the stereocilia (white arrows) on the lower surface of the tectorial membrane. Scale bars: 1 μm.
Figure 3
Figure 3. Distribution of F-actin and USH1 proteins in OHCs lacking clarin-1.
(A) Distribution of USH1 proteins (myosin VIIa, harmonin b, cadherin-23, protocadherin-15) and stereocilin in the apical region of F-actin–labeled stereocilia (red) in P12 control mice. (B) The typical targeting and localization of USH1 proteins in the stereocilia is preserved in the absence of clarin-1, regardless of the shape of the Clrn1ex4–/– hair bundles. (C) The F-actin labeling of the cuticular plate in P12 Clrn1ex4–/– mice is irregular, with the presence of furrows delimiting regions of clumped stereocilia. Stereocilin immunostaining (green) was used to visualize the hair bundle stereocilia. (D) No such irregularity of staining is observed in OHCs from control and Clrn1ex4fl/fl Myo15-Cre+/– mice. Scanning electron microscopy micrographs show selected OHC hair bundles (from P12 Clrn1ex4–/–, P15 control, and P20 Clrn1ex4fl/fl Myo15-Cre+/– mice) with hair bundle shapes similar to those of the immunostained hair bundles. Images obtained from 2–5 mice for each genotype. Scale bars: 1 μm.
Figure 4
Figure 4. Abnormal Ca2+ currents in mutant IHCs lacking clarin-1.
(AD) Ca2+ currents in IHCs were activated with a depolarizing voltage-ramp protocol (1 mV/ms) from –90 to +30 mV. The amplitude of Ca2+ currents is normal on P9, but larger in Clrn1ex4–/– (blue curves, A and B) and Clrn1ex4fl/fl Myo15-Cre+/– (red curves, C and D) mice than in controls (black curves, AD) on P13. (E) Comparative change in peak Ca2+ current density (peak ICa2+ at –10 mV normalized with respect to cell size) with age, at pre- and post-hearing stages (from P6 to P18), in IHCs from Clrn1ex4fl/fl Myo15-Cre+/– mice and control mice. (F) Boltzmann fit of the I-V curve for IHC Ca2+ currents (100-ms voltage steps) in Clrn1ex4fl/fl Myo15-Cre+/– and control mice on P18. (G) Comparative change in the half-maximal activation voltage of ICa2+ (V1/2) before and after hearing onset (from P6 to P18) in IHCs from Clrn1ex4fl/fl Myo15-Cre+/– and control mice. (H and I) ICa2+ activation time constant measured for various voltage steps from a holding potential at –80 mV in IHCs of P13 Clrn1ex4–/– mice (H), P18 Clrn1ex4fl/fl Myo15-Cre+/– mice (I), and the corresponding control mice. (J) IHCs from P18 Clrn1ex4fl/fl Myo15-Cre+/– (red) and control (black) mice were subjected to voltage steps from –80 mV to various membrane potentials for 100 milliseconds (inset: current traces for a Clrn1ex4fl/fl Myo15-Cre+/– mouse and a control mouse). The current reduction at the end of the 100-millisecond step (Ca2+-dependent inactivation, CDI) is expressed as a percentage of ICa2+ peak (%): CDI = [ICa2+ peakICa2+ 100 ms]/ICa2+p eak. The values shown are means ± SEM. *P < 0.05 (EJ, Student’s t test with Welch’s correction; and AD, 2-way ANOVA); n, number of cells.
Figure 5
Figure 5. Ca2+-mediated exocytosis in mutant IHCs lacking clarin-1.
(AD) Exocytosis was measured after various voltage steps between –80 mV and –5 mV, with each voltage step lasting 100 milliseconds (AC) or 25 milliseconds (D). A simple power function was fitted to the data (y = axN, where a is exocytotic slope efficiency and N the power index; Supplemental Table 2). Ca2+ efficiency for IHC exocytosis was normal at P9, but was significantly lower in P13 Clrn1ex4–/– mice (a = 0.04 ± 0.01 fF/pA) than in control littermates (a = 0.13 ± 0.01 fF/pA; P < 0.05) and in P13 Clrn1ex4fl/fl Myo15-Cre+/– mice (a = 0.07 ± 0.01 fF/pA) than in control littermates (a = 0.16 ± 0.01 fF/pA; P < 0.05). (EG) Mean exocytotic response curves evoked by UV uncaging of intracellular Ca2+ in IHCs from P14 Clrn1ex4fl/fl Myo15-Cre+/– (red) and control (black) mice. (F) Exocytosis rates obtained by a derivative function (dCm/dt) of the curves shown in E. (G) Comparative exocytotic peak upon Ca2+ photorelease in mutant and control IHCs. (H) Exocytosis kinetics for constant voltage steps from –80 to –10 mV, with durations increasing from 10 to 100 milliseconds, in IHCs from P18 Clrn1ex4fl/fl Myo15-Cre+/– (red) and control (black) mice. The intracellular Ca2+ buffer was 1 mM or 5 mM EGTA. A simple exponential function was fitted to the data, with similar time constants of 25 ± 10 milliseconds (n = 12) and 33 ± 18 milliseconds (n = 11) for controls in 1 mM and 5 mM EGTA, respectively. For Clrn1ex4fl/fl Myo15-Cre+/– IHCs, the time constant increased from 102 ± 50 milliseconds (n = 27) in 1 mM EGTA to 205 ± 32 milliseconds (n = 10) in 5 mM EGTA (P < 0.05). The values shown are means ± SEM; *P < 0.05 (AF and H, 2-way ANOVA; and G, Mann-Whitney test).
Figure 6
Figure 6. Molecular and structural changes at the IHC ribbon synapse in the absence of clarin-1.
(A) Two representative IHCs of P20 control, Clrn1ex4fl/fl Myo15-Cre+/–, and Clrn1ex4–/– mice stained for otoferlin (red) and ribeye (green), showing the correct location of the ribbons in the basolateral region of mutant IHCs despite the absence of clarin-1. (B) The bar chart shows the number (mean ± SEM; unpaired Student’s t test) of synaptic ribbons per IHC, which is similar in P20 Clrn1ex4–/– (blue), Clrn1ex4fl/fl Myo15-Cre+/– (red), and control (black) mice. (C) In control IHCs, efferent terminals (artificially colored in light blue) contact only afferent terminals (green). (D) By contrast, in Clrn1ex4–/– mice, efferent nerve fibers (blue) are found in direct contact with IHCs, on both P15 and P28. (E) Round, oval, and droplet-shaped ribbons are present in mutant IHCs lacking clarin-1 on P15. Each transmission electron microscopic image in CE is representative of 5–10 IHCs analyzed from 3 different mice for each genotype. (F) The bar chart shows the percentage of immature and mature synaptic ribbons per IHC in Clrn1ex4–/– (blue platform), Clrn1ex4fl/fl Myo15-Cre+/– (pink platform), and control (gray platform) mice. The IHCs of Clrn1ex4fl/fl Myo15-Cre+/– mice have normal frequencies of round (immature) and droplet-shaped (mature) ribbons on P15 (E and F). Similar values were obtained on P15 and P28. In the IHCs of Clrn1ex4–/– mice, round ribbons were numerous on P15, but their frequency had decreased to normal values on P28 (F). **P < 0.01 (Mann-Whitney test). Scale bars: 5 μm (A), 100 nm (C, D, and E).
Figure 7
Figure 7. Confocal imaging of Cav1.3 channels and F-actin at IHC ribbon synapses lacking clarin-1.
(A) The number of Cav1.3-immunoreactive patches associated with ribbons per IHC is similar in control (black) and Clrn1ex4–/– (blue) mice, on both P9 and P13. The numbers of Cav1.3 patches counted are indicated in parentheses. (B) Representative Imaris 3D images and quantitative analysis (bar chart) of immunoreactive patches in the synaptic basal region of IHCs from P13 control (black) and Clrn1ex4–/– (blue) mice. Cav1.3 channels form larger patches in the active zone, and the ribbons are smaller in IHCs lacking clarin-1 than in control IHCs. (C) The rate of colocalization for Cav1.3- and ribeye-immunoreactive areas is normal on P9, but low on P13 in the absence of clarin-1. (D) Representative confocal images of Cav1.3-immunoreactive (green) and ribeye-immunoreactive (red) patches, and a line scan analysis (intensity profile for a single Cav1.3- and ribeye-associated patch) in P15 control, P15 Clrn1ex4–/–, and P18 Clrn1ex4fl/fl Myo15-Cre+/– mice (images representative of 6 mice for each genotype). (E and F) Cytoskeleton architecture in IHCs from control and Clrn1ex4–/– mice. The F-actin cortical network (purple) is altered in the IHC synapse region of Clrn1ex4–/– on P9 (E) and P13 (F). The bar charts show the mean values ± SEM; *P < 0.05 (unpaired Student’s t test). Scale bars: 1 μm.
Figure 8
Figure 8. Intracochlear AAV2/8-mediated delivery of clarin-1 in Clrn1ex4–/– mice leads to moderate hearing preservation.
(A) The schematic diagram (top panel) shows the AAV2/8-Clrn1-IRES-GFP vector used for gene delivery to the cochlea on P2–P3. The histogram indicates the percentage of GFP-labeled IHCs and OHCs on P20–P30 in Clrn1ex4–/– mice. (B) Injections of either AAV2/8-Clrn1-IRES-GFP or AAV2/8-GFP had no effect on click ABR thresholds in WT mice. Injections of AAV2/8-GFP also had no impact on ABR thresholds in Clrn1ex4fl/fl Myo15-Cre+/– mice (unpaired Student’s t test). (C) ABR thresholds (mean ± SEM) in treated (purple, n = 9) and untreated (blue, n = 9) inner ears of P22–P24 Clrn1ex4–/– and control (black, n = 5) mice. A decrease of about 10–15 dB in ABR thresholds relative to untreated ears was observed in Clrn1ex4–/– ears after injection. **P < 0.01 (unpaired Student’s t test). (D) Early postnatal AAV2/8-mediated delivery of clarin-1 into Clrn1ex4–/– ears did not prevent or correct the misshaping of the hair bundles. Both IHC and OHC hair bundles presented alterations in shape and a loss of short-row stereocilia due to the embryonic loss of clarin-1 (representative of 8 mice between P25 and P30). Scale bars: 1 μm.
Figure 9
Figure 9. AAV2/8-mediated delivery of clarin-1 in Clrn1ex4fl/fl Myo15-Cre+/– mice leads to long-term preservation of hearing.
(A) Comparative tone-burst ABR thresholds (audiogram, mean ± SEM and individual points for each frequency) in AAV2/8-Clrn1–injected (purple, n = 7) and untreated (red, n = 10) inner ears of P22–P24 Clrn1ex4fl/fl Myo15-Cre+/– mice and control (black, n = 6) mice. (B) Similar comparative audiograms for AAV2/8-Clrn1–injected (purple, n = 5) and untreated (red, n = 6) inner ears of P60 Clrn1ex4fl/fl Myo15-Cre+/– mice and P60 control (black, n = 6) mice. (C) Mean click ABR waves at P60 in control and in untreated and AAV2/8-Clrn1–injected Clrn1ex4fl/fl Myo15-Cre+/– mice. (D) Scanning electron microscopy view of stereocilia from untreated (left) and AAV2/8-Clrn1–injected (right) ears of P120 Clrn1ex4fl/fl Myo15-Cre+/– mice (n = 3). By contrast to the untreated ears, the injection of AAV2/8-Clrn1 resulted in apparently normal hair bundles still visible on P120 (n = 3). However, despite the persistence of V-shaped bundles, the stereocilia in the short and middle rows are heterogeneous in length, and many of these stereocilia are missing. **P < 0.01, ***P < 0.001 (unpaired Student’s t test).Scale bars: 1 μm.
Figure 10
Figure 10. AAV2/8-mediated delivery of Clrn1 in Clrn1ex4–/– mice preserves synapse ribbon structure and function.
(A) The re-expression of clarin-1 at the IHC synapse (P15–P18) in Clrn1ex4–/– IHCs led to normal Ca2+ currents, kinetics, and Ca2+ efficiency of exocytosis (Supplemental Table 3). *P < 0.05 (2-way ANOVA). (B) The virus-mediated expression of clarin-1 restored the tight clustering of Ca2+ channels in the IHC active zone, as shown by the line scan intensity profiles of Cav1.3- and ribeye-immunoreactive patches for 2 ribbons (images representative of 3 mice).
Figure 11
Figure 11. Interactions between clarin-1, the Cav1.3 channel complex, and harmonin.
(A and B) The GST-tagged clarin-1 N-terminal region (Clrn1-N) and C-terminal region (Clrn1-C) bind to CFP-tagged CaVβ2 produced in HEK293 cells, whereas GST alone does not. No binding is detected with the untagged CaVα1, CFP-tagged Rab11, or ECFP alone. (B) The bar chart indicates the significant interaction between clarin-1 and CaVβ2 (n = 5, *P < 0.05; unpaired Student’s t test). (C and D) In a coimmunoprecipitation assay, anti-FLAG M2 resin was incubated with HEK293 cells coproducing FLAG-tagged CaVAID, mCherry-tagged clarin-1, and CFP-tagged CaVβ2, or mCherry-tagged clarin-1 and CFP-tagged CaVβ2. (D) Significant binding between CaVAID and clarin-1 is observed only in the presence of CaVβ2 (n = 3, *P < 0.05; unpaired Student’s t test). (E) GST-tagged Clrn1-C binds to myc-tagged harmonin b, whereas GST alone does not. The bar chart shows the significant interaction between clarin-1 and harmonin (n = 5, P < 0.05; unpaired Student’s t test). (F) Schematic representation of a synaptic active zone summarizing the interactions between clarin-1, the Ca2+ channel subunits CaVβ2 and CaVα1, and harmonin (see uncut gels in supplemental material).
Figure 12
Figure 12. IHC postsynaptic defects in clarin-1–deficient mice.
(A) Representative electrically evoked brainstem responses (EEBRs) in the cochleae of P20 control, Clrn1ex4fl/fl Myo15-Cre+/–, and Clrn1ex4–/– mice. The first large downward inflection is due to an electrical artifact. In these stimulation conditions, wave I is not visible, as signal processing by the IHC synapse is bypassed. EEBR wave II (EII) and later waves (EIII and EIV), corresponding to the responses of higher auditory centers, are clearly visible in the control mouse (black trace, representative of 10 mice), absent in Clrn1ex4–/– mice (blue trace, representative of 6 mice), and significantly delayed and reduced in Clrn1ex4fl/fl Myo15-Cre+/– mice (red trace, representative of 10 mice). (B) Cochleae immunostained with Neurofilament 200 (NF200; green) showing a significant loss of auditory nerve fibers in P25 Clrn1ex4–/– mice (arrows) relative to control and Clrn1ex4fl/fl Myo15-Cre+/– mice of the same age. (C) IHCs of P20 control and Clrn1ex4fl/fl Myo15-Cre+/– mice. The postsynaptic GluA2/3-immunoreactive domain (green) is abnormally expanded in the nerve terminals underneath the IHCs of Clrn1ex4fl/fl Myo15-Cre+/– mice (n = 7). (D) Representative micrographs of the IHC synaptic region highlighting the expansion of postsynaptic terminals in Clrn1ex4fl/fl Myo15-Cre+/– mice (red dotted line; representative of 3 mice and 10 IHCs) and the swelling (artificially colored in green) of the postsynaptic boutons in Clrn1ex4–/– mice (representative of 3 mice and 10 IHCs) as compared with control mice (representative of 3 mice and 13 IHCs). (E) Quantification of the loss of parvalbumin-positive neurons in Rosenthal’s canal in control (4 cochleae from 3 mice), Clrn1ex4–/– (8 cochleae from 4 mice), and Clrn1ex4fl/fl Myo15-Cre+/– mice (6 cochleae from 3 mice) (values are mean ± SD; ANOVA, post hoc Holm-Sidak test). Scale bars: 500 nm (D), 20 μm (B and E), 5 μm (C).
Figure 13
Figure 13. Clarin-1 is required for the compact organization of presynaptic Cav1.3 Ca2+ channels and postsynaptic GluA2/3 AMPA receptors.
(A) Schematic diagram of an IHC synaptic active zone in control (top panel) and clarin-1–deficient (bottom panel) mice. In the presynaptic active zone of release, clarin-1 interacts with CaVβ2, harmonin, and the F-actin cytoskeleton to cluster Cav1.3 Ca2+ channels close to the synaptic vesicles. The lack of clarin-1 results in a dislocation of the synaptic F-actin network associated with a spatial disorganization of both presynaptic Cav1.3 channels and postsynaptic GluA2/3 glutamate receptors. (B) Schematic representation of molecular interactions between clarin-1 and other proteins in the IHC synaptic active zone. Clarin-1 may be required for the trans-synaptic alignment of the Cav1.3 channel complex (harmonin-Cavβ2-CaVα1) and postsynaptic glutamate receptors.

References

    1. Adato A, et al. USH3A transcripts encode clarin-1, a four-transmembrane-domain protein with a possible role in sensory synapses. Eur J Hum Genet. 2002;10(6):339–350. doi: 10.1038/sj.ejhg.5200831. - DOI - PubMed
    1. Fields RR, et al. Usher syndrome type III: revised genomic structure of the USH3 gene and identification of novel mutations. Am J Hum Genet. 2002;71(3):607–617. doi: 10.1086/342098. - DOI - PMC - PubMed
    1. Västinsalo H, et al. Alternative splice variants of the USH3A gene Clarin 1 (CLRN1) Eur J Hum Genet. 2011;19(1):30–35. doi: 10.1038/ejhg.2010.140. - DOI - PMC - PubMed
    1. Joensuu T, et al. Mutations in a novel gene with transmembrane domains underlie Usher syndrome type 3. Am J Hum Genet. 2001;69(4):673–684. doi: 10.1086/323610. - DOI - PMC - PubMed
    1. Isosomppi J, Västinsalo H, Geller SF, Heon E, Flannery JG, Sankila EM. Disease-causing mutations in the CLRN1 gene alter normal CLRN1 protein trafficking to the plasma membrane. Mol Vis. 2009;15:1806–1818. - PMC - PubMed

Publication types

MeSH terms