. 2018 Jul 9;9(1):2655.
doi: 10.1038/s41467-018-05184-7.

Gut microbiota associations with common diseases and prescription medications in a population-based cohort

Affiliations

Gut microbiota associations with common diseases and prescription medications in a population-based cohort

Matthew A Jackson et al. Nat Commun. .

Abstract

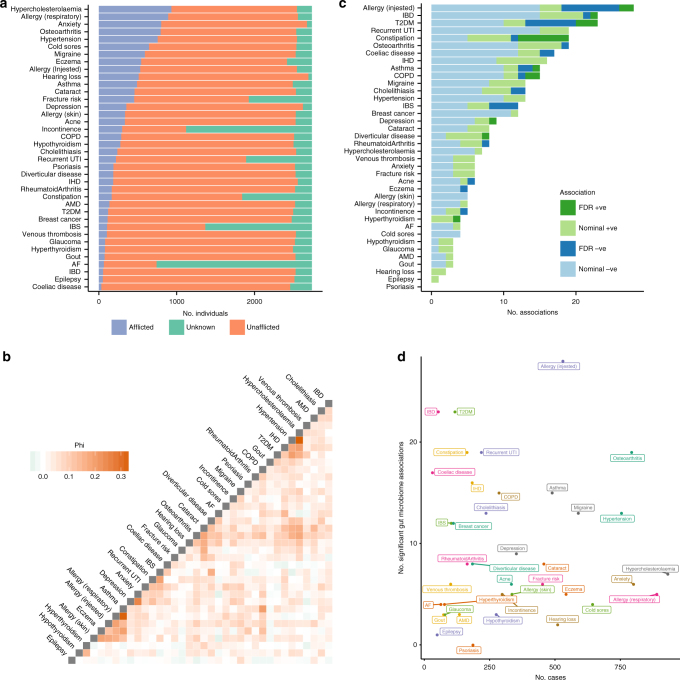
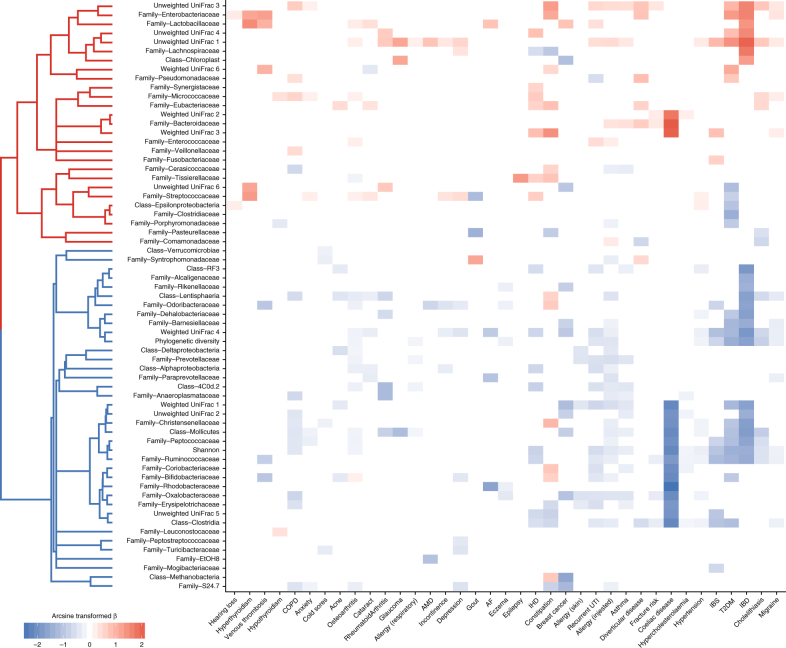
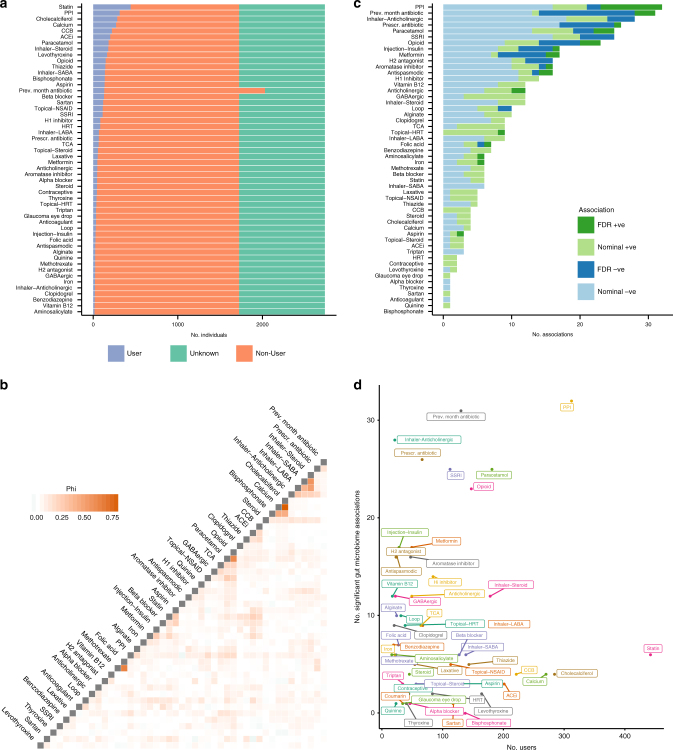
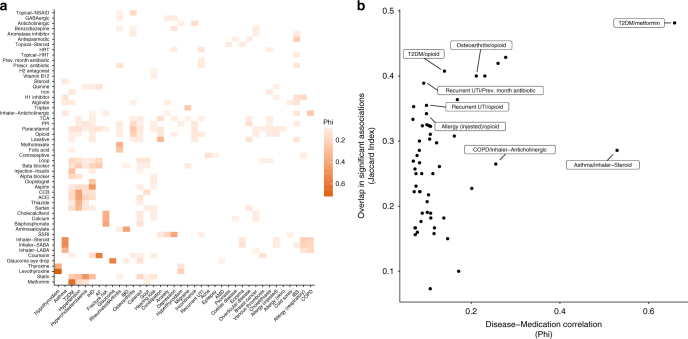
The human gut microbiome has been associated with many health factors but variability between studies limits exploration of effects between them. Gut microbiota profiles are available for >2700 members of the deeply phenotyped TwinsUK cohort, providing a uniform platform for such comparisons. Here, we present gut microbiota association analyses for 38 common diseases and 51 medications within the cohort. We describe several novel associations, highlight associations common across multiple diseases, and determine which diseases and medications have the greatest association with the gut microbiota. These results provide a reference for future studies of the gut microbiome and its role in human health.


Conflict of interest statement

T.D.S. is co-founder of MapMySelf and MapMyGut Ltd. The remaining authors declare no competing interests.

Figures

Fig. 1
Fig. 1
Gut microbiota associations with common diseases in TwinsUK. a Counts of afflicted and unafflicted individuals for common diseases within the subset of TwinsUK individuals having gut microbiota profiles. b Correlation between the diseases when comparing those with complete data in each pairwise comparison. Phi is equivalent to Pearson’s correlation for binary variables. Breast cancer and acne are not included as they had correlation coefficients of <0.1 with all other diseases. Data overlap in each case can be found in Supplementary Data 6. c The number of associations observed with gut microbiota markers for each disease. Colour represents the direction of the association and darker bars represent those significant after FDR adjustment. d The number of afflicted individuals in the study plotted against the number of nominally significant associations observed (p < 0.05) for each disease
Fig. 2
Fig. 2
Gut microbiota traits have consistent associations with multiple diseases. Both diseases and microbiota traits have been clustered based on cosine distances generated from the beta coefficients of all nominally significant (p < 0.05) associations. Beta coefficients have been arcsine transformed for visualisation. Non-significant associations have been scored 0 and hence coloured white. Diseases or microbiota traits with no significant associations are not shown. Bootstrap clustering of microbiome traits identified two significant clusters highlighted in the left dendrogram; one contains traits generally at higher abundance with disease and the other traits generally at lower abundance with disease (or higher in healthy individuals)
Fig. 3
Fig. 3
Gut microbiota associations with common prescription medications in TwinsUK. a Counts of users and non-users of medications within the subset of TwinsUK individuals with gut microbiota profiles. b Correlation between use of medications when comparing those with complete data in each pairwise comparison. Phi is equivalent to Pearson’s correlation for binary variables. Medications with Phi coefficients of <0.1 with all other medications are not shown. Data overlap in each case can be found in Supplementary Data 6. c The number of associations observed with gut microbiota markers for each medication class. Colour represents the direction of the association and darker bars represent those significant after FDR adjustment. d The number of users of each medication in the study plotted against the number of nominally significant associations observed (p < 0.05) for each
Fig. 4
Fig. 4
Overlap of disease and treatment associations in the gut microbiota. a Heatmap of the correlation between disease status and medication use status across the cohort. All non-significant correlations (FDR < 0.05) are coloured white. Rows and columns are ordered by hierarchical clustering of correlation coefficients. b Plot of the correlation between the significantly correlated disease–medication pairs in A versus the overlap between their associations with the gut microbiota. Showing there are cases where both correlation and overlap are high, but also those where there can be high overlap independent of correlation and vice versa. For clarity, specific examples that are discussed in the study are highlighted. A complete annotation is available in Supplementary Fig. 6

Comment in

References

    1. Lloyd-Price J, Abu-Ali G, Huttenhower C. The healthy human microbiome. Genome Med. 2016;8:51. doi: 10.1186/s13073-016-0307-y. - DOI - PMC - PubMed
    1. Duvallet C, Gibbons SM, Gurry T, Irizarry RA, Alm EJ. Meta-analysis of gut microbiome studies identifies disease-specific and shared responses. Nat. Commun. 2017;8:1784. doi: 10.1038/s41467-017-01973-8. - DOI - PMC - PubMed
    1. Bonder MJ, Abeln S, Zaura E, Brandt BW. Comparing clustering and pre-processing in taxonomy analysis. Bioinformatics. 2012;28:2891–2897. doi: 10.1093/bioinformatics/bts552. - DOI - PubMed
    1. Gohl DM, et al. Systematic improvement of amplicon marker gene methods for increased accuracy in microbiome studies. Nat. Biotechnol. 2016;34:942–949. doi: 10.1038/nbt.3601. - DOI - PubMed
    1. Falcony G, et al. Population-level analysis of gut microbiome variation. Science. 2016;352:560–564. doi: 10.1126/science.aad3503. - DOI - PubMed

Publication types

Substances