. 2018 Jul 9;9(1):2654.
doi: 10.1038/s41467-018-05123-6.

Attentional fluctuations induce shared variability in macaque primary visual cortex

Affiliations

Attentional fluctuations induce shared variability in macaque primary visual cortex

George H Denfield et al. Nat Commun. .

Abstract

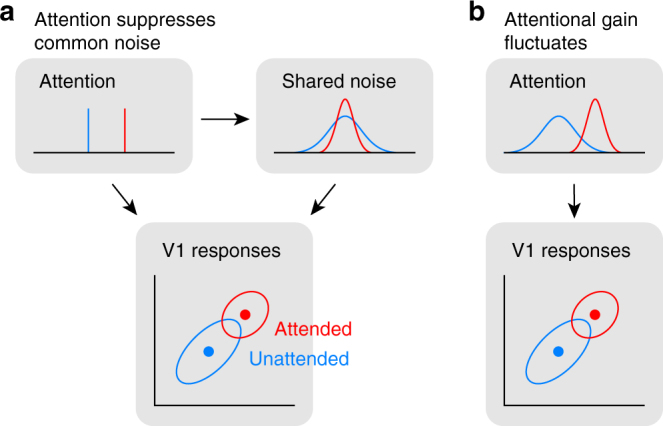
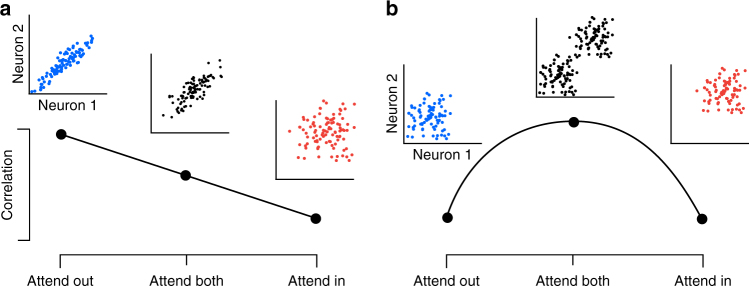
Variability in neuronal responses to identical stimuli is frequently correlated across a population. Attention is thought to reduce these correlations by suppressing noisy inputs shared by the population. However, even with precise control of the visual stimulus, the subject's attentional state varies across trials. While these state fluctuations are bound to induce some degree of correlated variability, it is currently unknown how strong their effect is, as previous studies generally do not dissociate changes in attentional strength from changes in attentional state variability. We designed a novel paradigm that does so and find both a pronounced effect of attentional fluctuations on correlated variability at long timescales and attention-dependent reductions in correlations at short timescales. These effects predominate in layers 2/3, as expected from a feedback signal such as attention. Thus, significant portions of correlated variability can be attributed to fluctuations in internally generated signals, like attention, rather than noise.


Conflict of interest statement

The authors declare no competing interests.

Figures

Fig. 1
Fig. 1
Attention and correlated variability. a Hypothesis 1: Attentional gain is increased, but relatively stable under both conditions (top left). Correlated variability is driven by a common noise source (top right), which is suppressed by attention,. b Hypothesis 2: Attentional gain is increased, but fluctuates from trial to trial,,. Correlated variability is driven by fluctuations of attentional state. The reduction in correlations under attention would imply that the attentional gain is less variable when attending
Fig. 2
Fig. 2
Predicted effects of attention on correlations when attending one or two stimuli. a Scenario in which attentional fluctuations are negligible and attention primarily acts by suppressing common noise sources. In this case, we expect intermediate correlations when attending two stimuli (“Attend Both”). b Scenario in which fluctuations in attention induce correlations. In this case, we expect attention to switch randomly between the two targets in the “Attend Both” condition, resulting in the highest correlations in this condition
Fig. 3
Fig. 3
Task diagram with behavioral results. a Orientation change-detection task. Two stimuli (L: left, R: right) randomly change their orientation during the ZCP (length 10–5000 ms). One stimulus (R in this example) then enters the CP (300 ms) when the signal orientation is shown (coherence exaggerated for clarity). This period is followed by another 200 ms ZCP to allow time for a behavioral response. b Illustration of attention conditions. Attention is cued according to fixation spot color. This color scheme is used in all figures to represent each condition. Percentages below the stimuli indicate the probability that the change occurs in this stimulus on a given trial. One stimulus overlaps the recorded neurons’ receptive fields. c Example session psychophysical performance. Individual points represent fraction of changes detected at a given coherence. Solid lines indicate fit of logistic function to the data. Inset shows 50% detection threshold with 95% CIs. d Behavioral summary. Same as inset in c, but averaged across sessions in our dataset (N = 30; mean ± SEM). e Percentage of changes detected in each condition averaged across sessions (mean ± SEM)
Fig. 4
Fig. 4
Attentional modulation of neuronal responses. a Example session spike density function for each condition, normalized to the average response in AI condition (mean across units). b Same as a but averaged across sessions (N = 30). Attentional modulation is confined primarily to the first second following stimulus onset. c Fractional increase in firing rates in the first second following stimulus onset in the AB and AI conditions relative to the AO condition averaged across sessions (N = 30; mean ± SEM). d Example single unit tuning curves in AI, AB, and AO conditions. Dots show responses to specific orientations; solid lines show fitted von Mises functions
Fig. 5
Fig. 5
Effects of attention on shared variability. a Spike count correlations from 0 to 1 s following stimulus onset, averaged across sessions (N = 30). b Spike count correlations shown separately for both subjects during fixation (300 ms interval) and during the task (same interval as in a). c Cumulative correlation coefficient, calculated by integrating the cross-correlogram, for each attention condition and averaged across sessions. Data in a, b show mean ± SEM, c omits SEM. d Correlation contrast versus eccentricity of stimulus on horizontal axis (Subject B: N = 13, open circles; Subject D, N = 39 (N = 29 black dots, N = 10 black squares); solid line, line of best fit, overall N = 52)
Fig. 6
Fig. 6
Laminar profile of attention effects. a Example session CSD profile evoked by task stimulus (left column) with multi-unit receptive fields (middle) and tuning curves (right). Depths are relative to first L5 channel. Dotted black line shows L4–5 transition. Arrow shows initial current sink-source flip in L4C. b Fractional increase in firing rates in AB and AI, relative to AO, conditions split by laminar group. c Spike count correlation over 0–1000 ms interval split by laminar group. d Spike count correlation over 0–200 ms interval split by laminar group. Data in bd show mean across sessions ± SEM (N = 30)
Fig. 7
Fig. 7
Microsaccade and pupil size by attention condition. a Proportion of total microsaccades in a session (radius) as a function of microsaccade direction (angle) for each attention condition. b Normalized number of microsaccades by attention condition. c Normalized pupil size by attention condition. Data in ac show mean across sessions ± SEM (N = 30 for a, b; N = 8 for c)

References

    1. Softky WR, Koch C. The highly irregular firing of cortical cells is inconsistent with temporal integration of random EPSPs. J. Neurosci. 1993;13:334–350. doi: 10.1523/JNEUROSCI.13-01-00334.1993. - DOI - PMC - PubMed
    1. Bach M, Krüger J. Correlated neuronal variability in monkey visual cortex revealed by a multi-microelectrode. Exp. Brain Res. 1986;61:451–456. doi: 10.1007/BF00237570. - DOI - PubMed
    1. Bair W, Zohary E, Newsome WT. Correlated firing in macaque visual area MT: time scales and relationship to behavior. J. Neurosci. 2001;21:1676–1697. doi: 10.1523/JNEUROSCI.21-05-01676.2001. - DOI - PMC - PubMed
    1. Zohary E, Shadlen MN, Newsome WT. Correlated neuronal discharge rate and its implications for psychophysical performance. Nature. 1994;370:140–143. doi: 10.1038/370140a0. - DOI - PubMed
    1. Averbeck BB, Latham PE, Pouget A. Neural correlations, population coding and computation. Nat. Rev. Neurosci. 2006;7:358–366. doi: 10.1038/nrn1888. - DOI - PubMed

Publication types

LinkOut - more resources