. 2018 Jul 9;8(1):10349.
doi: 10.1038/s41598-018-28581-w.

AMPA receptor trafficking and its role in heterosynaptic plasticity

Affiliations

AMPA receptor trafficking and its role in heterosynaptic plasticity

G Antunes et al. Sci Rep. .

Abstract

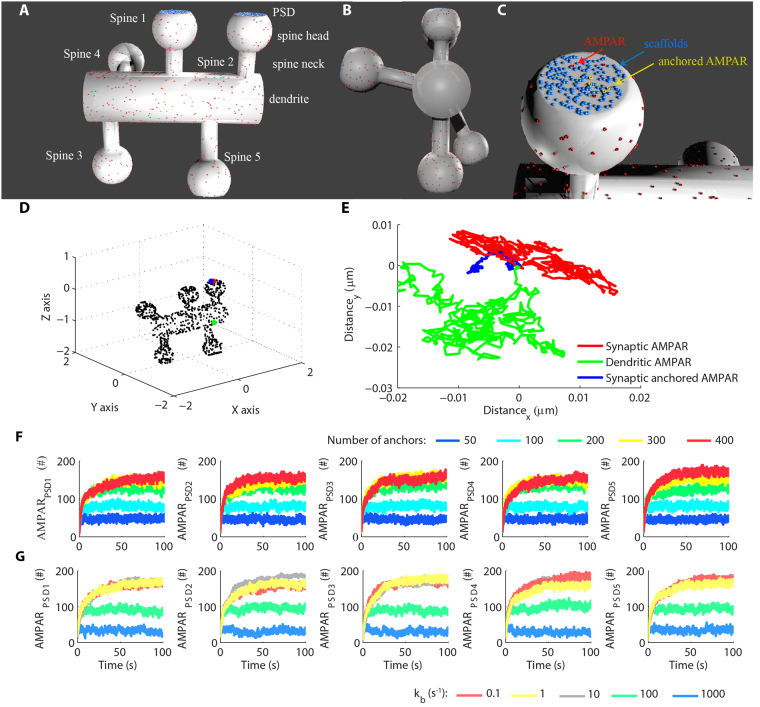
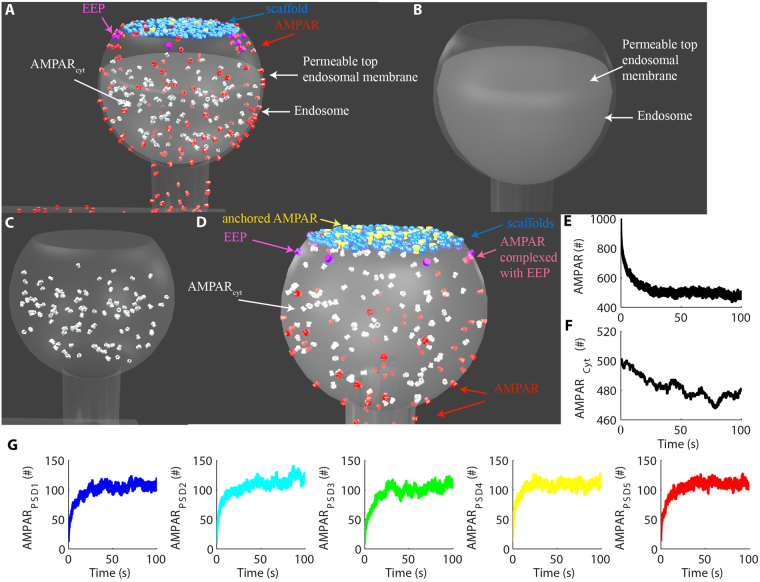
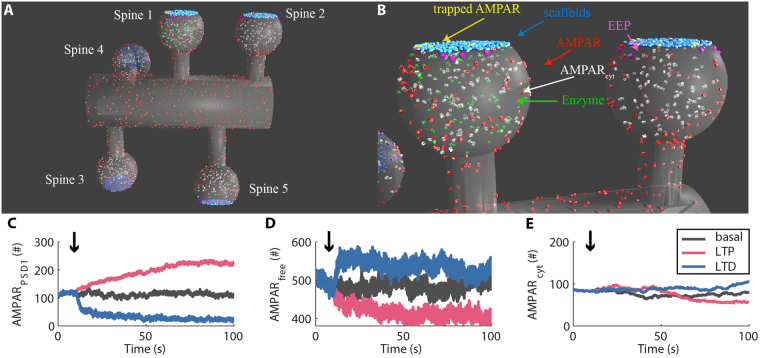
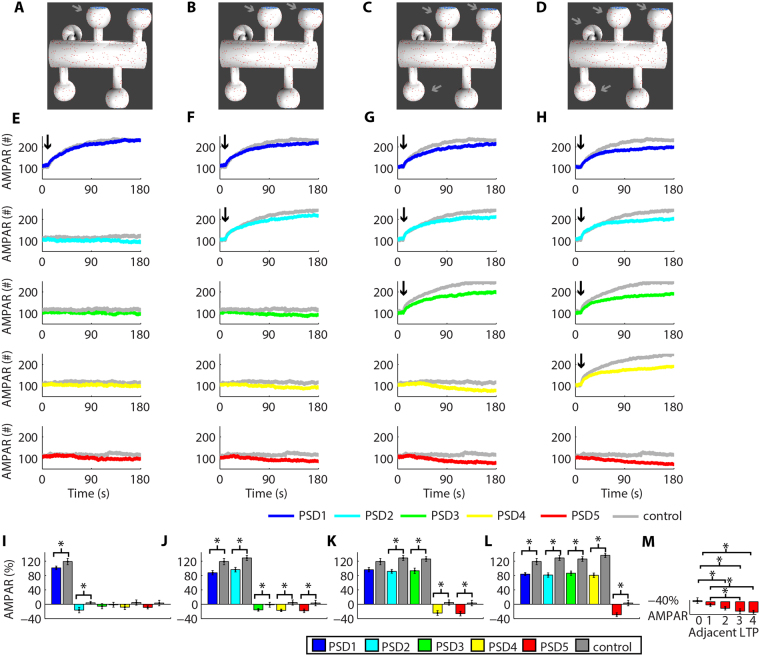
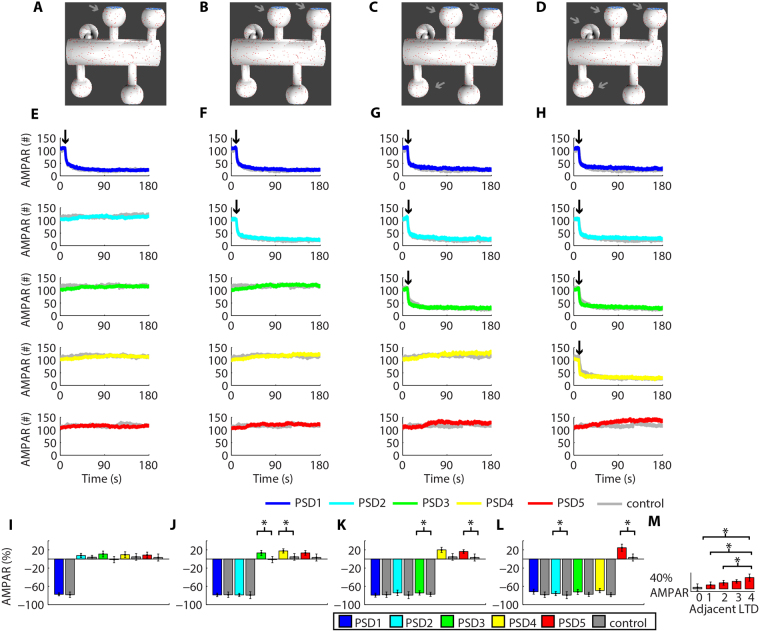
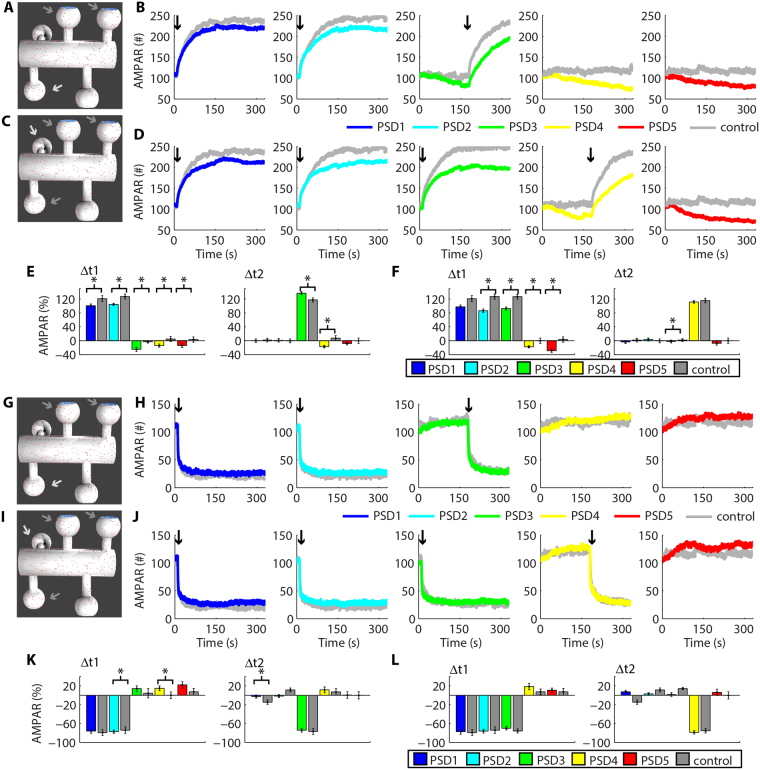
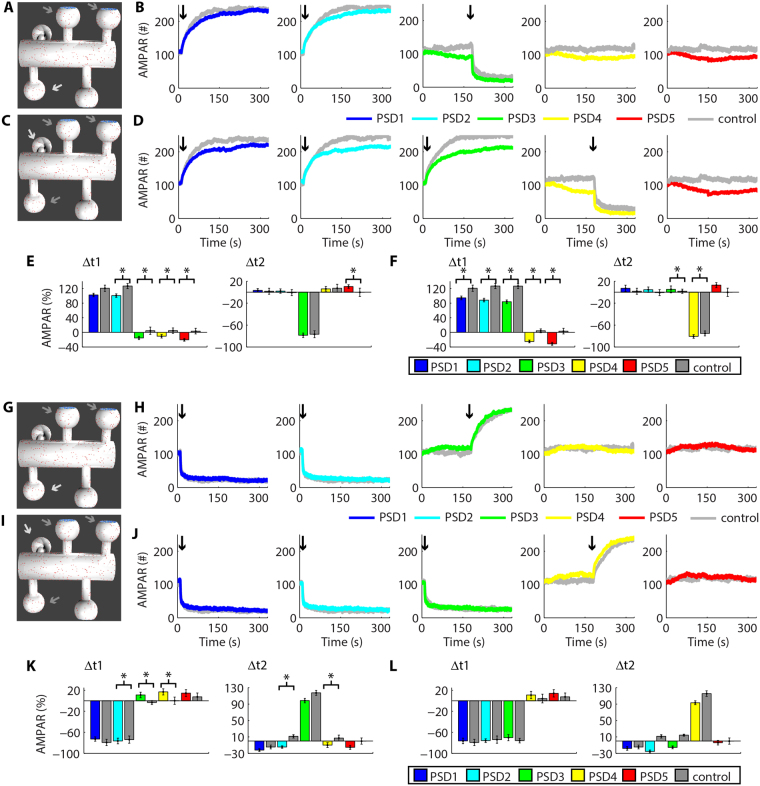
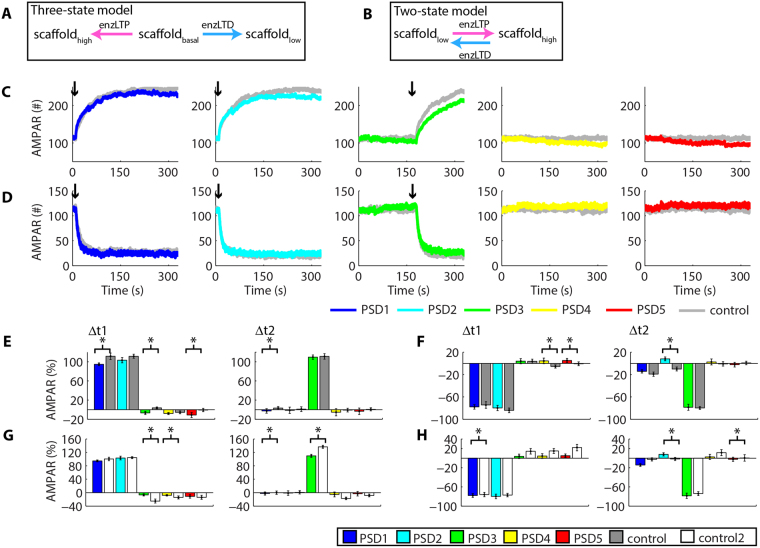
Historically, long-term potentiation (LTP) and long-term depression (LTD), the best-characterized forms of long-term synaptic plasticity, are viewed as experience-dependent and input-specific processes. However, cumulative experimental and theoretical data have demonstrated that LTP and LTD can promote compensatory alterations in non-stimulated synapses. In this work, we have developed a computational model of a tridimensional spiny dendritic segment to investigate the role of AMPA receptor (AMPAR) trafficking during synaptic plasticity at specific synapses and its consequences for the populations of AMPAR at nearby synapses. Our results demonstrated that the mechanisms of AMPAR trafficking involved with LTP and LTD can promote heterosynaptic plasticity at non-stimulated synapses. These alterations are compensatory and arise from molecular competition. Moreover, the heterosynaptic changes observed in our model can modulate further activity-driven inductions of synaptic plasticity.


Conflict of interest statement

The authors declare no competing interests.

Figures

Figure 1
Figure 1
Tridimensional computational model of AMPAR trafficking. (A) Overall view of the tridimensional dendritic segment containing five dendritic spines. Each spine consisted of a neck, a head, and a PSD on the top of the head. (B) Lateral view of the dendritic segment. (C) At each PSD, we simulated scaffold proteins that interacted with AMPARs and anchored them. (D) Distribution of AMPARs along the mesh. (E) Trajectories of three distinct AMPARs during 5 ms of simulated time. There is a receptor on the dendrite, a free synaptic receptor and a synaptic receptor associated to a scaffold. Their initial positions are indicated in (D), and their initial coordinates were set as (0,0) for visualization of the trajectories. (F) The initial number of available scaffold molecules (anchors) regulated the number of synaptic AMPARs at each PSD. (G) The rate constant for the dissociation of AMPARs from the scaffold molecules controlled the number of synaptic receptors stabilized at each PSD (300 scaffolds per synapse).
Figure 2
Figure 2
AMPAR trafficking model. (A) To simulate the endocytosis and exocytosis of AMPARs, we implemented a single EZ per spine where we placed 10 EEPs to catalyze the internalization and externalization of AMPARs. (B) We simulated a single large endosome inside each spine head. The top membrane of each endosome was permeable to cytoplasmic AMPARs (AMPARcyt) to allow their interaction with EEP. The impermeable bottom of the endosomes confined the cytoplasmic molecules inside the spine heads. (C) Detailed view of AMPARcyt in the cytoplasm of the spine head. (D) Molecular components of the model and their distributions. In (C,D), the endosomes were rendered transparent for better visualization of the intracellular molecules. (E) Time course of the total amount of free AMPARs. We released 1000 free AMPARs at the beginning of the simulations to verify their accumulations at the synapses. (F) Total number of AMPARcyt obtained by the balance of exocytosis and endocytosis of receptors. (G) Number of AMPARs at each PSD combining free and anchored receptors.
Figure 3
Figure 3
Activity-dependent changes of synaptic AMPARs. We implemented two enzymes that phosphorylate the scaffold molecules to simulate LTP and LTD. (A) View of the whole mesh used in the simulations with the enzymes involved with synaptic plasticity released into the spine 1 (in green). (B) Detailed view of the enzymes released into the spine 1 to induce synaptic plasticity through the phosphorylation of scaffold molecules. In (A,B), we rendered the endosomes transparent for better visualization of the intracellular molecules. (C–E) Time courses of synaptic AMPARs at rest and during simulations of LTP and LTD at PSD1 (spine 1) (C), the total population of free AMPARs (AMPARfree) on the dendritic segment simulated (D) and the population of intracellular AMPARs inside the spine 1 (E).
Figure 4
Figure 4
Activity-driven LTP causes heterosynaptic depression. (A–D) Synapses with induced LTP. (E–H) Time courses of the changes in the number of AMPARs at each PSD simulated during LTP at PSD1 (E), PSD1 and PSD2 (F), PSD1-PSD3 (G), and PSD1-PSD4 (H). The controls correspond to simulations without the induction of synaptic plasticity (Suppl. Fig. S3) and LTP at single synapses (Suppl. Fig. S4). (I–L) Changes of AMPARs at each PSD from t1 = 10 s to the end of the simulations caused by LTP at one (I), two (J), three (K) and four synapses (L). The asterisks indicate statistically significant differences (P < 0.05) for paired T-test comparisons with control simulations. (M) The number of vicinal LTP modulated the amplitude of heterosynaptic depression at PSD5. The asterisks indicate statistically significant Tukey post hoc comparisons (P < 0.05).
Figure 5
Figure 5
Heterosynaptic potentiation induced by LTD. (A–D) Visualization of the dendritic spines with simulated LTD. (E–H) Time courses of the changes in the number of AMPARs at each PSD caused by LTD at PSD1 (E), PSD1 and PSD2 (F), PSD1-PSD3 (G), and PSD1-PSD4. The arrows show the moment of LTD induction. The controls are simulations without the induction of synaptic plasticity (Suppl. Fig. S3) or simulations of LTD at single synapses (Suppl. Fig. S5). (I–L) Alterations of AMPARs at each PSD estimated from t1 = 10 s to the end of the simulations caused by one (I), two (J), three (K) and four synapses undergoing LTD simultaneously (L). Asterisks indicate statistically significant T-test comparisons (P < 0.05) with control simulations. (M) The number of nearby LTD regulated the magnitude of heterosynaptic potentiation at PSD5. The asterisks indicate statistically significant Tukey post hoc comparisons (P < 0.05).
Figure 6
Figure 6
Heterosynaptic plasticity and the further induction of activity-driven synaptic plasticity. Simultaneous occurrences of LTP at two (A,B) or three synapses (C,D) can affect the posterior induction of LTP at a nearby synapse. (E,F) Changes of the percentage of AMPARs at each PSD caused by prior (Δt1) and posterior LTP (Δt2). Prior occurrences of LTD at two (G,H) or three synapses (I,J) had little effects on posterior LTD at an adjacent synapse. (K,L) Variations of AMPARs at each PSD caused by prior (Δt1) and posterior LTD (Δt2). The arrows in A, C, G and I show the synapses stimulated at t1 (10 s, dark arrows) and at t2 (180 s, light arrows). In B, D, H, and J the arrows indicate LTP or LTD inductions. All the results of the control simulations are showed in Suppl. Fig. S8. (E,F,K,L) Asterisks indicate statistically significant T-test comparisons (P < 0.05) with control simulations.
Figure 7
Figure 7
Heterosynaptic plasticity and the posterior induction of activity-driven synaptic plasticity. Prior LTP at two (A,B) or three synapses (C,D) had little effects on the posterior induction of LTD at a vicinal synapse in comparison to control LTD without prior synaptic plasticity (E,F). Alterations of AMPARs at each PSD caused prior LTP (Δt1) and posterior LTD (Δt2). (GJ) LTD at two (G,H) or three synapses (I,J) did not regulate posterior LTP (K,L). Variations of AMPARs at each PSD for prior LTD (Δt1) and posterior LTP (Δt2). The arrows in A, C, G and I indicate the synapses stimulated at t1 (10 s, dark arrows) and at t2 (180 s, light arrows). In B, D, H, and J the arrows show the moment of LTP or LTD inductions. (E,F, K,L) Asterisks indicate statistically significant T-test comparisons (P < 0.05) with control simulations.
Figure 8
Figure 8
Heterosynaptic plasticity in a two-state model of synaptic plasticity. (A,B) Schematic representations of the three-state model (A) and the two-state model (B). (C) Time courses of AMPARs at each synapse during prior LTP at PSD1 and PSD2, and posterior LTP at PSD3. All curves obtained for the control simulations are showed in Suppl. Fig. S9. (D) Time courses of AMPARs at each PSD during prior LTD at PSD1, PSD2, and posterior LTD at PSD3. (E) Alterations of AMPARs at each PSD caused by prior LTP (Δt1) and posterior LTP (Δt2) in comparison to control simulations. (F) Alterations of AMPARs at each PSD caused by prior LTD (Δt1) and posterior LTD (Δt2). (G,H) Comparisons between the results of the three-state model (control 2) and the two-state caused by prior and posterior LTP (G) and prior and posterior LTD (H). Asterisks indicate statistically significant T-test comparisons (P < 0.05) with control simulations.
Figure 9
Figure 9
Heterosynaptic plasticity and the posterior induction of activity-driven synaptic plasticity in a two-state model. Time courses of AMPARs at each synapse for the prior inductions of LTP (A) or LTD (B) at PSD1 and PSD2 and the posterior induction of LTD (A) or LTP (B) at PSD3. (C) Alterations of AMPARs at each PSD caused by prior LTP (Δt1) and posterior LTD (Δt2) in comparison to control simulations. (D) Changes of AMPARs at each PSD caused by prior LTD (Δt1) and posterior LTP (Δt2) in comparison to control simulations. (E,F) Comparisons between the results of the three-state model (control 2) and the two-state model for prior LTP and posterior LTD (E) and prior LTD and posterior LTP (F). Asterisks indicate statistically significant T-test comparisons (P < 0.05) with control simulations.

References

    1. Lüscher, C. & Malenka, R. C. NMDA receptor-dependent long-term potentiation and long-term depression (LTP/LTD). Cold Spring Harb Perspect Biol4 (2012). - PMC - PubMed
    1. Nishiyama J, Yasuda R. Biochemical Computation for Spine Structural Plasticity. Neuron. 2015;87:63–75. doi: 10.1016/j.neuron.2015.05.043. - DOI - PMC - PubMed
    1. Zenke F, Gerstner W. Hebbian plasticity requires compensatory processes on multiple timescales. Philosophical Transactions of the Royal Society B: Biological Sciences. 2017;372:20160259. doi: 10.1098/rstb.2016.0259. - DOI - PMC - PubMed
    1. Bourne J, Harris KM. Do thin spines learn to be mushroom spines that remember? Current Opinion in Neurobiology. 2007;17:381–386. doi: 10.1016/j.conb.2007.04.009. - DOI - PubMed
    1. Matsuzaki M, Honkura N, Ellis-Davies GCR, Kasai H. Structural basis of long-term potentiation in single dendritic spines. Nature. 2004;429:761–766. doi: 10.1038/nature02617. - DOI - PMC - PubMed

Publication types

MeSH terms

Substances

LinkOut - more resources