. 2018 Jul 9;8(1):10307.
doi: 10.1038/s41598-018-28680-8.

Data-driven analysis of motor activity implicates 5-HT2A neurons in backward locomotion of larval Drosophila

Affiliations

Data-driven analysis of motor activity implicates 5-HT2A neurons in backward locomotion of larval Drosophila

Jeonghyuk Park et al. Sci Rep. .

Abstract

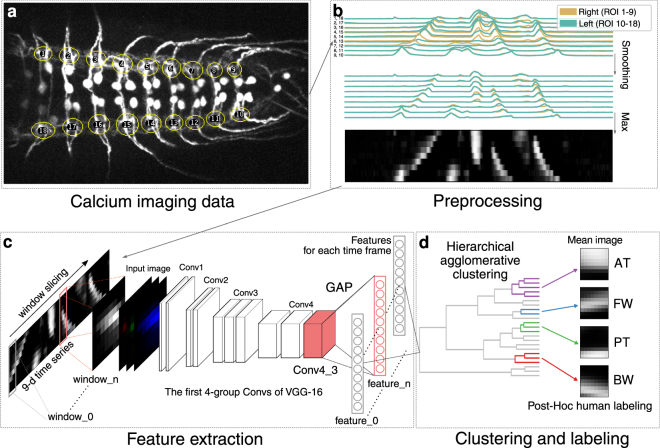
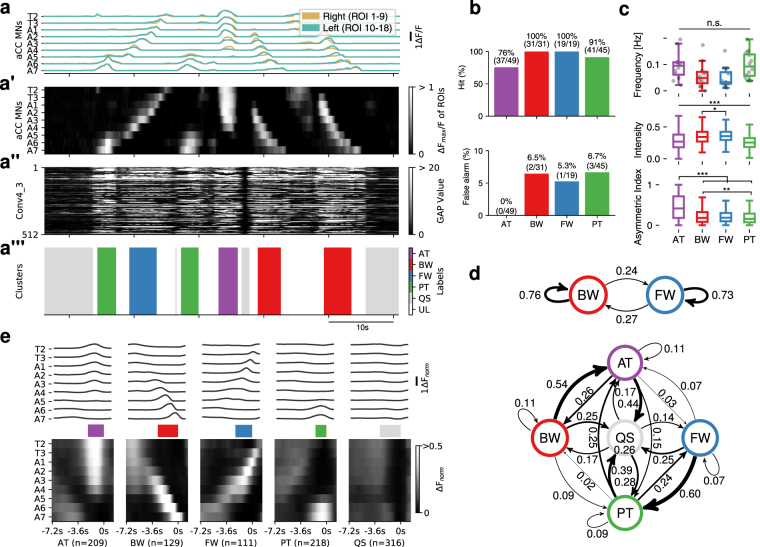
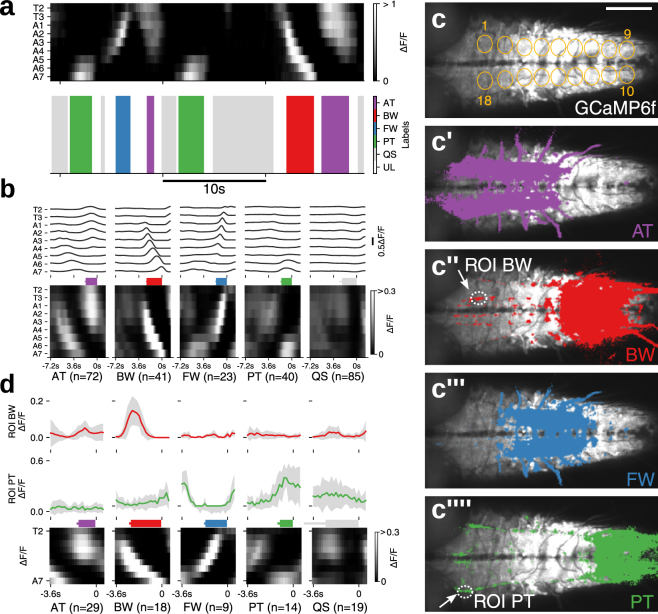
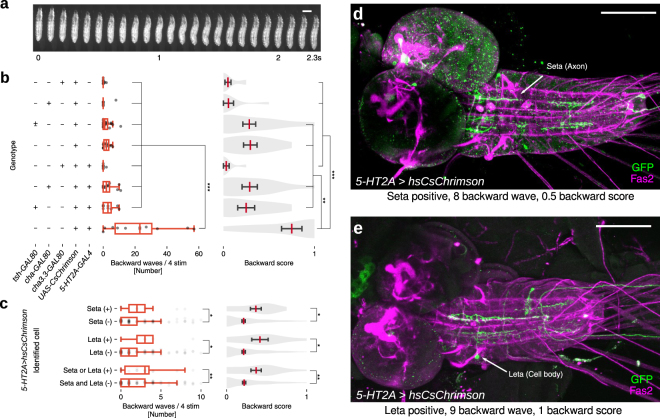
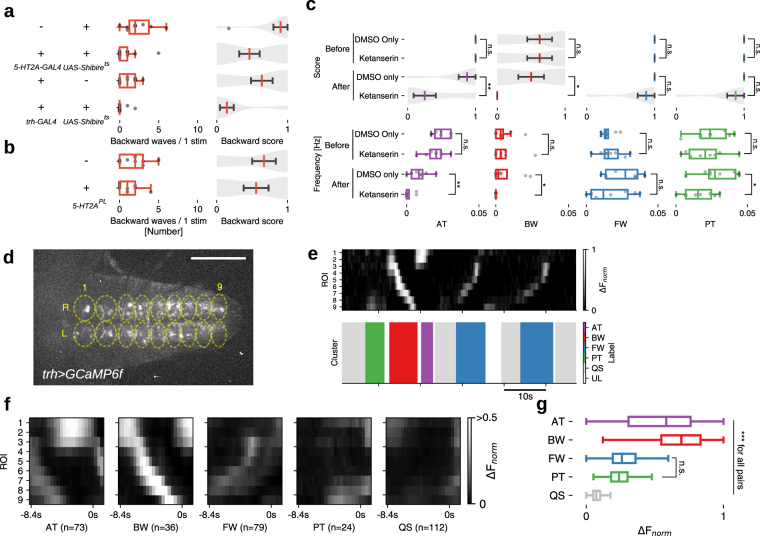
Rhythmic animal behaviors are regulated in part by neural circuits called the central pattern generators (CPGs). Classifying neural population activities correlated with body movements and identifying the associated component neurons are critical steps in understanding CPGs. Previous methods that classify neural dynamics obtained by dimension reduction algorithms often require manual optimization which could be laborious and preparation-specific. Here, we present a simpler and more flexible method that is based on the pre-trained convolutional neural network model VGG-16 and unsupervised learning, and successfully classifies the fictive motor patterns in Drosophila larvae under various imaging conditions. We also used voxel-wise correlation mapping to identify neurons associated with motor patterns. By applying these methods to neurons targeted by 5-HT2A-GAL4, which we generated by the CRISPR/Cas9-system, we identified two classes of interneurons, termed Seta and Leta, which are specifically active during backward but not forward fictive locomotion. Optogenetic activation of Seta and Leta neurons increased backward locomotion. Conversely, thermogenetic inhibition of 5-HT2A-GAL4 neurons or application of a 5-HT2 antagonist decreased backward locomotion induced by noxious light stimuli. This study establishes an accelerated pipeline for activity profiling and cell identification in larval Drosophila and implicates the serotonergic system in the modulation of backward locomotion.


Conflict of interest statement

The authors declare no competing interests.

Figures

Figure 1
Figure 1
Outline for motor pattern classification using deep convolutional feature. (a) Neural activity of segmental aCC MNs was captured in 18 ROIs, covering each side of the neuromeres T2 - A7 (visual cues). (b) Preprocessing of the activity data. The time series representing the activity in each ROI was smoothed to reduce the effects of degeneration. Then, the data on the left and right side of each neuromere was compressed by adopting the maximum value to 9-d time series. (c,d) Framework for automated identification of motor patterns. (c) The 9-d time series was decomposed into windows with constant intervals. The windows were converted into a square 8-bit gray-scale images and then to RGB images. Features of each RGB image were extracted from the 3rd layer of the 4th convolutional block (Conv4_3) of VGG16 by global average pooling. (d) The features are classified into clusters by hierarchical agglomerative clustering (HAC) using Ward’s method. See Fig. S1 for details.
Figure 2
Figure 2
Evaluation and characterization of fictive motor patterns classified by deep convolutional feature. (a) An example of extracted motor patterns (a”’) from the activity data (a) Intermediate layers, the pre-processed 9-d time series displayed as a grayscale image (a’) and global average pooled values of Conv4_3 (a”), are also shown. AT, anterior burst; BW, backward wave; FW, forward wave; PT, posterior burst; QS, quiescence state; UL, unlabeled, represented in different colors as shown in the color-code bar. T2-T3, thoracic segment 2 to 3; A1-A7, abdominal segment 1 to 7. See Fig. S1a for details. (b) Evaluation of the extracted motor patterns. Hits (top) and false alarm (bottom) for the four motor patterns are shown. (c) Frequency (top), intensity (middle) and symmetry (bottom) of the four motor patterns extracted from 12 samples. Intensity represents the maximum fluorescence change (ΔFnorm) among all ROIs during each motor pattern. Asymmetric index is defined as the difference of the maximum ΔFnorm in the left and right ROI divided by the maximum ΔFnorm in all ROIs at each time-frame. *p < 0.05, **p < 0.01, ***p < 0.001, ANOVA with post-hoc Tukey HSD test. (d) Markov chain of fictive motor patterns. Transition probabilities derived from 2 states (BW and FW, top) and 5 states (AT, BW, FW PT and QS, bottom). Thickness of arrows represents the transition probability between the motor patterns. Note that the arrow from QS to QS is omitted due to lack of space. (e) Averaged fictive motor patterns. Line plot (top) and grayscale image (bottom) are shown aligned with the end points of each motor pattern. Colored bars in the middle represent the average duration of each motor pattern (AT:2.2 ± 0.1 s, BW:2.8 ± 0.1 s, FW:2.3 ± 0.1 s, PT:1.5 ± 0.1 s, QS:2.9 ± 0.3 s, mean ± standard deviation).
Figure 3
Figure 3
Motor pattern extraction from activity data of whole neurons. (a) An example of extracted motor patterns (bottom) from the activity data derived from pan-neuronally expressed GCaMP6f (top, grayscale image) (b) Mean of fictive motor pattern dervied from 3 samples aligned with the end point of each label. Average duration of each motor pattern, AT:1.8 ± 0.1 s, BW:2.4 ± 0.1 s, FW:1.7 ± 0.1 s, PT:1.6 ± 0.1 s, QS:2.3 ± 0.4 s (mean ± standard deviation). Note that unnormalized ΔF/F is shown since normalization obscured the motor pattern. (c) Motor pattern correlation mapping. Voxels with >0.1 Pearson’s r for each motor pattern, AT (c’), BW (c”), FW (c”’) and PT (c”’), are shown in colors. c shows the 18 ROIs used for the analyses (visual cues). Image baselines are derived from maximum GCaMP signal. (d) Neural activity in the structures identified by the correlation mapping. The average activity in the structures identified as specific to BW (top) and PT (middle) during each motor pattern (bottom). Scale bar 100 μm.
Figure 4
Figure 4
Identification of Seta and Leta, backward-specific interneurons expressing 5-HT2A-GAL4. (a) A cartoon showing the design of GAL4 knock-in. The GAL4-coding sequence along with the 2A peptides was inserted by the CRISPR/Cas9 method to the target NM receptor gene locus, just downstream of the C-terminus of the NM coding sequence. dsRed flanked by loxP sites was used as a marker for successful insertion. (b) Expression of 5-HT2A-GAL4 visualized with mCD8-GFP. (c–c”) motor pattern mapping in 5-HT2A-GAL4- and RRa-GAL4-targeted cells. (c) 18 ROIs representing each hemisegment used for the analyses (visual cues). (c’) Dominant motor pattern mapping identified voxels specific to BW. Motor patterns are colored as in Fig. 3. Two ROIs (labeled as Seta and Leta) are selected for the ROI correlation mapping in (c”). (c”) ROI correlation mapping reveals the outline of Seta and Leta. Pearson’s r between each voxel and a ROI in Seta and Leta shown in (c’) was calculated. The mapping results for Seta (red) and Leta (green) and GCaMP signals (blue) are merged. Axons of Seta and Leta are revealed in yellow (red + blue) and green/blue color (green + blue) and are found to be present in the CI and DM tracts (Fas2 coordinate), respectively (arrows). c’ and c” are z-stacked images. (d) Mean activity of Seta (top, red) and Leta (middle, green) (derived of three samples) aligned with motor activities during AT, BW, FW and PT (bottom, grayscale image). Colored bars represent the duration of each motor pattern. (AT:3.6 ± 0.2 s, BW:5.2 ± 0.2 s, FW:3.4 ± 0.4 s, PT:3.0 ± 0.1 s, QS:8.4 ± 0.9 s, mean ± standard deviation). (e) Maximum activity level (fluorescence changes, ΔF/F) of Seta and Leta during each motor patterns. While both Seta and Leta are active during BW, only Seta is active during AT and PT. ***p < 0.001, ANOVA with post-hoc Tukey HSD test, compared to QS. (f–f”) ROI correlation mapping in 5-HT2A-GAL4-targeted cells. Unlike in c, ROI mapping was applied only to 5-HT2A-GAL4-targeted cells. The morphology of Seta (f,f”) and Leta (f’,f”) can be seen more clearly. Scale bar 100 μm.
Figure 5
Figure 5
Morphology and neurotransmitter identity of Seta and Leta neurons. (a,b) Representative single neurons of Seta (a) and Leta (b) obtained by the MCFO method and hs-CsChrimson method in wandering third instar larvae, respectively (green). Fas2 expression is also shown (magenta). Dorsal (left) and cross-sectional (right) views are shown. (c,d) Schematic representation of the morphology of Seta (c) and Leta (d). Fas2 coordinates are shown as landmarks (magenta). (e,f) Co-staining for CsChrimson (expression driven by 5-HT2A-GAL4, green) in Seta (e) and Leta (f) and for ChAT (magenta). A single plane focusing on the axon terminal of Seta (e) and cell body of Leta (f) is shown. Staining in different parts of the cells were shown because only the cell body and axons can be clearly identifiable as belonging to Leta and Seta, respectively, among the Gal4-targeted neurons. C: central, D: dorsal, I: intermediate, L: lateral, M: median, V: ventral, A: anterior, P: posterior. Scale bars, 50 μm (a,b), 5 μm (e,f). Note that b is identical to Fig. 6e.
Figure 6
Figure 6
Optogenetic activation of the Seta or Leta neuron increases backward peristalsis. (a) Montage of a representative backward peristalsis of the 3rd instar larva. Scale bar 1 mm. (b) Optogenetic activation of 5-HT2A-GAL4 targeted cells with or without tsh-GAL80, cha3.3-GAL80 or cha-GAL80. Quantification of the number of backward peristalses (left, boxplot with scatter) and backward score (right, violinplot with mean and SEM) in each genotype is shown. n = 10, 9, 22, 11, 8, 13, 9, 10 (from top to bottom). *p < 0.05, **p < 0.01, ***p < 0.001, ANOVA with post-hoc Tukey HSD test. (ce) Optogenetic activation of small subsets of 5-HT2A-GAL4 targeted cells. (c) Quantification of backward locomotion as in b in larvae with or without CsChrimson expression in Seta or Leta. *p < 0.05, **p < 0.01, Mann-Whitney U test. p = 0.016 (waves), 0.010 (score) for Seta (n = 13 (+), 167 (−)), p = 0.015 (waves), 0.015 (score) for Leta (n = 9 (+), 171(−)), p = 0.005 (waves), 0.005 (score) for Seta or/and Leta (n = 19 (+), 161 (−)). (d,e) Examples of CsChrimson expression. A larva with expression in a Seta neuron (d) and Leta neuron (d). The number of backward peristalsis induced and backward score is also shown. Scale bar 100 μm.
Figure 7
Figure 7
Implication of the serotonergic system in backward locomotion. (a) 5-HT2A-GAL4 and serotonergic neurons are required for proper backward locomotion. Quantification of backward locomotion as in Fig. 6b when 5-HT2A-GAL4 or trh-GAL4 targeted neurons are thermogenetically inhibited (n = 10, 13, 11 and 14 from top to bottom). p = 0.004 (waves), 0.016 (score) for 5-HT2A > Shibirets, p = 0.005 (waves), 0.006 (score) for trh > Shibirets. (b) 5-HT2A homozygous mutants (5-HT2APL) did not show significant difference in backward locomotion. n = 9, each group. p = 0.19 (waves), 0.32 (score) for 5-HT2APL. *p < 0.05, **p < 0.01, Mann-Whitney U test. (c) A 5-HT2 antagonist, Ketanserin, reduces fictive backward locomotion. Motor patterns were extracted from activity data of 5-HT2A, RRa > GCaMP6f. p = 0.001 (waves), 0.002 (score) for AT, p = 0.023 (waves) 0.016 (score) for BW, p = 0.15 (waves), 0.02 (score) for PT, otherwise p > 0.05. (dg) Calcium imaging of serotonergic neurons. (d) Neural activity in trh > GCaMP6f larvae was captured using 18 ROIs. (e) Extracted motor patterns. Preprocessed fluorescence pattern (top) and assigned motor patterns (bottom). (f) Mean activity pattern aligned with the end point of each motor pattern. Average duration of each motor pattern were AT:2.2 ± 0.2 s, BW:2.6 ± 0.1 s, FW:1.8 ± 0.1 s, PT:1.5 ± 0.1 s, QS:9.1 ± 0.8 s, (mean ± standard deviation). (g) Maximum fluorescence change during each motor patterns. ***p < 0.001, ANOVA with post-hoc Tukey HSD test. Scale bar 100 μm. See also Fig. S7.

Similar articles

Cited by

References

    1. Delcomyn F. Neural basis of rhythmic behavior in animals. Science. 1980;210:492–498. doi: 10.1126/science.7423199. - DOI - PubMed
    1. Marder E, Calabrese RL. Principles of rhythmic motor pattern generation. Physiological reviews. 1996;76:687–717. doi: 10.1152/physrev.1996.76.3.687. - DOI - PubMed
    1. Mulloney, B. & Smarandache, C. Fifty years of cpgs: two neuroethological papers that shaped the course of neuroscience. Frontiers in behavioral neuroscience4 (2010). - PMC - PubMed
    1. Skinner FK, Mulloney B. Intersegmental coordination in invertebrates and vertebrates. Current opinion in neurobiology. 1998;8:725–732. doi: 10.1016/S0959-4388(98)80114-1. - DOI - PubMed
    1. Briggman KL, Kristan WB. Imaging dedicated and multifunctional neural circuits generating distinct behaviors. Journal of Neuroscience. 2006;26:10925–10933. doi: 10.1523/JNEUROSCI.3265-06.2006. - DOI - PMC - PubMed

MeSH terms

LinkOut - more resources