. 2018 Sep;36(8):707-716.
doi: 10.1038/nbt.4181. Epub 2018 Jul 9.

Enhancing T cell therapy through TCR-signaling-responsive nanoparticle drug delivery

Affiliations

Enhancing T cell therapy through TCR-signaling-responsive nanoparticle drug delivery

Li Tang et al. Nat Biotechnol. 2018 Sep.

Abstract

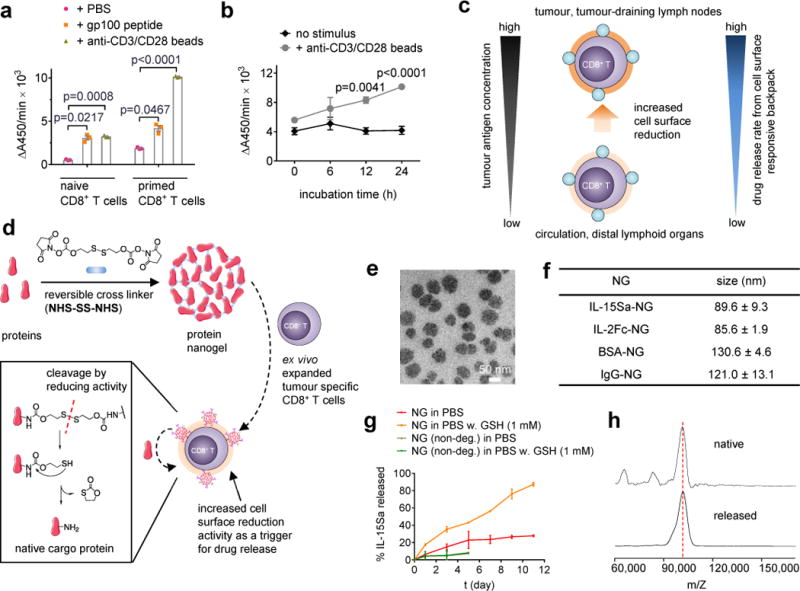
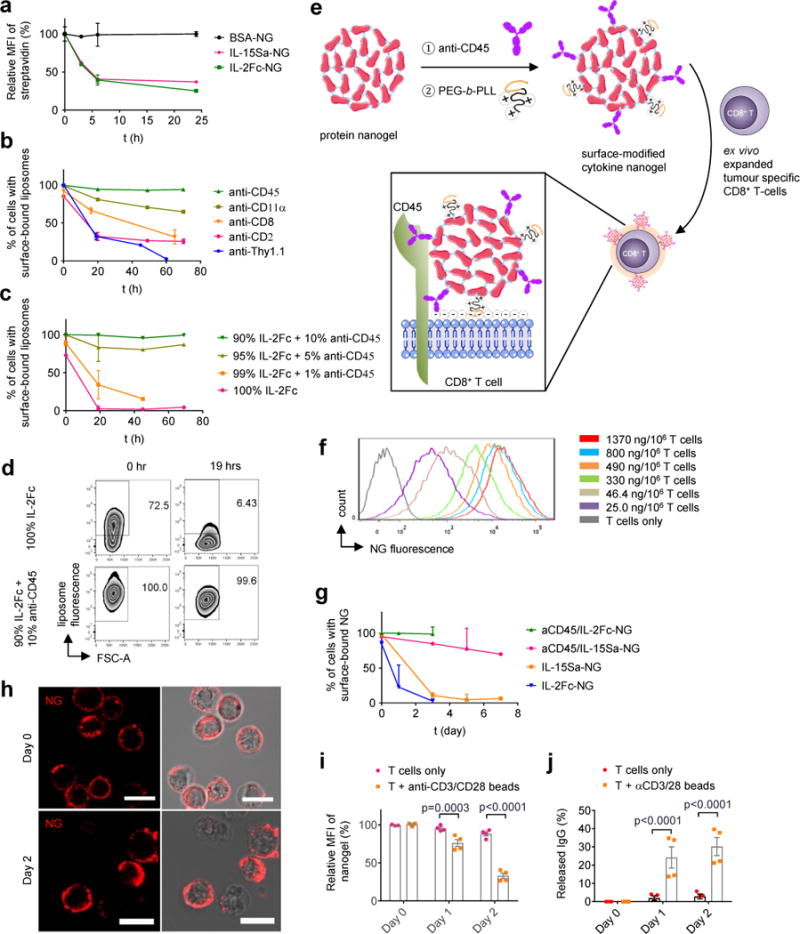
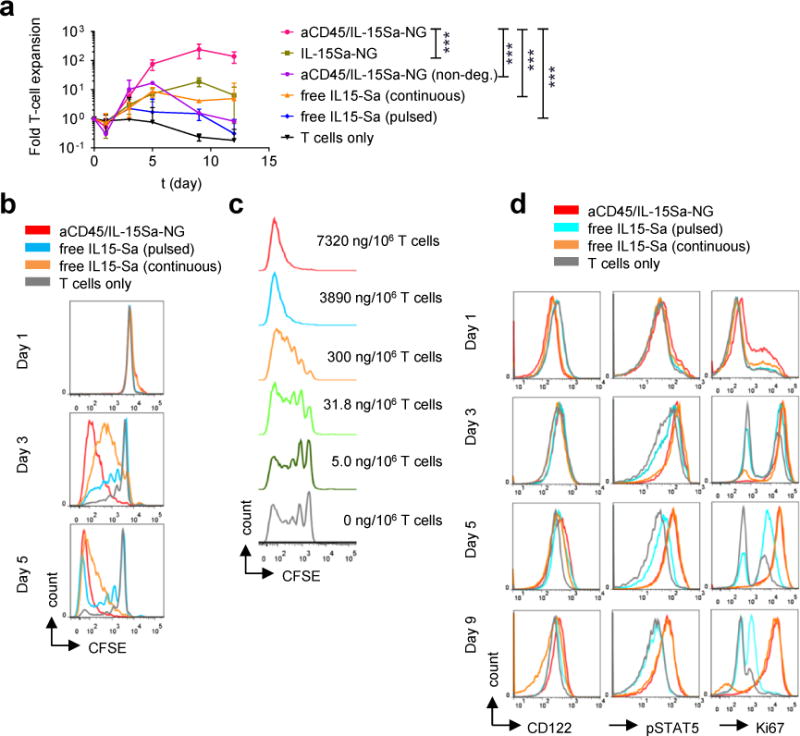
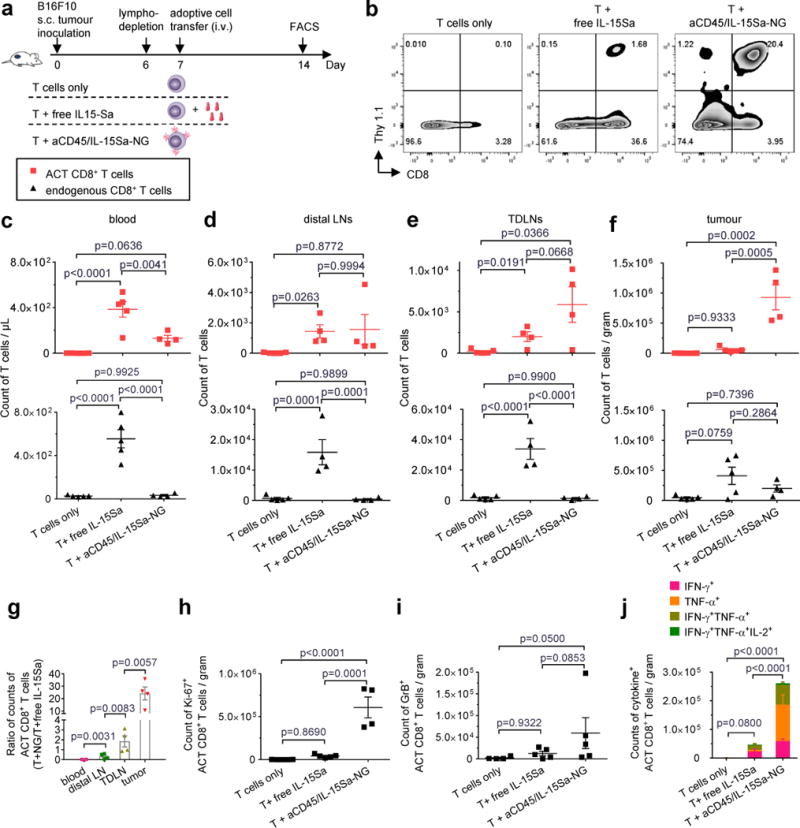
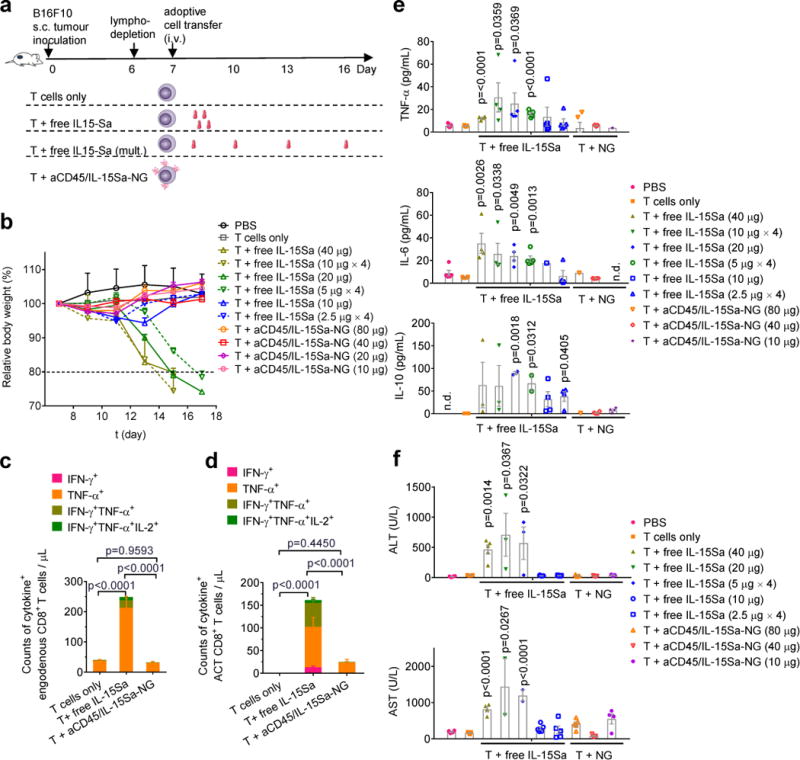
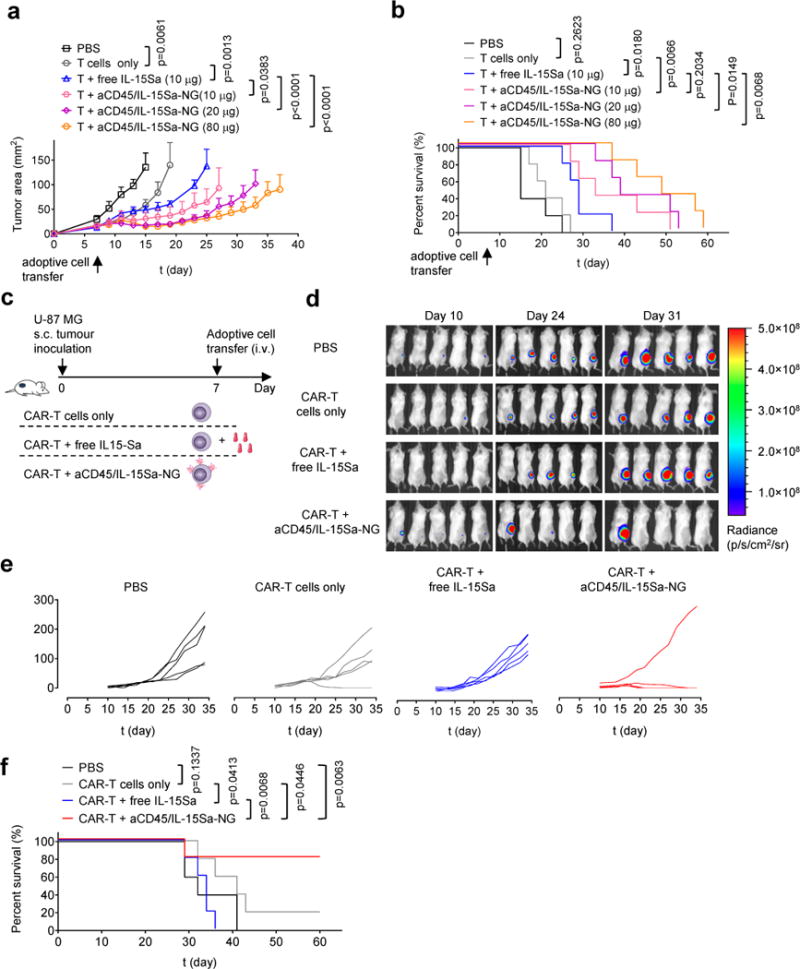
Adoptive cell therapy (ACT) with antigen-specific T cells has shown remarkable clinical success; however, approaches to safely and effectively augment T cell function, especially in solid tumors, remain of great interest. Here we describe a strategy to 'backpack' large quantities of supporting protein drugs on T cells by using protein nanogels (NGs) that selectively release these cargos in response to T cell receptor activation. We designed cell surface-conjugated NGs that responded to an increase in T cell surface reduction potential after antigen recognition and limited drug release to sites of antigen encounter, such as the tumor microenvironment. By using NGs that carried an interleukin-15 super-agonist complex, we demonstrated that, relative to systemic administration of free cytokines, NG delivery selectively expanded T cells 16-fold in tumors and allowed at least eightfold higher doses of cytokine to be administered without toxicity. The improved therapeutic window enabled substantially increased tumor clearance by mouse T cell and human chimeric antigen receptor (CAR)-T cell therapy in vivo.


Conflict of interest statement

COMPETING FINANCIAL INTERESTS

D.J.I., L.T., and Y.Z. are inventors on licensed patents related to the technology described in this manuscript. D.J.I. is a co-founder of Torque Therapeutics, which licensed patents related to this technology.

Figures

Figure 1
Figure 1. Synthesis and characterization of TCR signalling-responsive protein nanogels
(a) Naïve or con-A-primed CD8+ T cells were incubated in the presence of gp100 peptide (10 μg/mL) or anti-CD3/CD28 beads for 24 hrs followed by measurement of WST-1 cell-surface reduction rate in presence of an intermediate electron acceptor for 1 hr at 37°C. (b) Con-A-primed CD8+ T cells were incubated in the presence of anti-CD3/CD28 beads and the cell-surface reduction rate was measured over time. (c) Proposed strategy for linking elevated surface redox activity of activated CD8+ T cells to accelerated drug release kinetics from a redox-responsive backpack. (d) Scheme for protein nanogel (NG) synthesis, and release of protein in response to reducing activity in the local microenvironment. (e) Representative TEM image of NGs prepared from IL-15Sa. (f) Mean ± s.d. hydrodynamic sizes of different NGs determined by dynamic light scattering (n=3 independent samples). (g) Release kinetics of cytokines from redox-responsive or non-degradable IL-15Sa-NGs in PBS with or without added glutathione (GSH) as a reducing agent. (h) Released and native cytokines were characterized by MALDI mass spectrometry. Data in a, b represent the mean ± s.e.m. (n = 3 biologically independent samples /group) and analysed by One-Way ANOVA and Tukey’s tests. All data are one representative of at least two independent experiments.
Figure 2
Figure 2. Nanogel anchoring to CD45 promotes prolonged cell surface retention
(a) Biotinylated protein NGs were covalently coupled to primed pmel-1 CD8+ T cells via a bis-NHS crosslinker, incubated in medium for indicated times then stained with fluorescent streptavidin (SAv) to detect cell surface-accessible particles and analysed by flow cytometry (n=3 independent samples). (b-d) Biotinylated liposomes functionalized with indicated monoclonal antibodies (b) or a mixture of anti-CD45 and IL-2Fc (c, d) were incubated with primed pmel-1 CD8+ T cells for indicated times, then stained with fluorescent SAv and analysed by flow cytometry to measure cell surface-accessible liposomes. Shown are mean % of cells with surface-accessible liposomes (b, c) and representative flow cytometry plots showing the frequencies of cells with surface-bound liposomes (d). n=3 independent samples in b-d. (e) Scheme for surface modification of cytokine-NGs to facilitate efficient and stable anchoring on T cell surfaces. (f) Primed pmel-1 CD8+ T cells were coupled with fluorescently-labelled aCD45/IL-15Sa NGs at the indicated cytokine levels, and NG levels on each cell were assessed by flow cytometry. (g) Primed pmel-s CD8+ T cells were conjugated with aCD45/cytokine- or cytokine only-biotinylated NGs, incubated for indicated times, then stained with SAv for analysis of cell-surface NGs by flow cytometry (n=3 independent samples). (h) Representative confocal microscopy images of primed pmel-1 CD8+ T cells with fluorescently labelled aCD45/IL-15Sa-NGs (red) on day 0 and day 2. Scale bar, 10 μm. (i-j) Release of fluorescently-labelled IgG from aCD45/IgG-NGs attached to primed pmel-1 CD8+ T cells incubated with or without anti-CD3/CD28 beads as assessed by flow cytometry (i) and HPLC analysis of culture supernatants (j) (n=4 independent samples). Data represent the mean ± s.e.m. and analysed by One-Way ANOVA and Tukey’s tests. All data are one representative of at least two independent experiments.
Figure 3
Figure 3. IL-15Sa-nanogel backpacks promote T cell expansion in vitro
(a) Fold expansion of naïve CD8+ T cells stimulated with anti-CD3/CD28 beads in the presence of surface bound aCD45/IL-15Sa-NGs (7.5 μg IL-15Sa/106 cells), IL-15Sa-NGs, non-degradable NGs (aCD45/IL-15Sa-NGs(non-deg.)), or incubated with free IL-15Sa at equivalent doses either pulsed for 1 hr or continuously cultured with the same cytokine for 12 days. Data represent the mean ± 95%CI. (n=3 independent samples) and analysed by One-Way ANOVA and Tukey’s tests (data at day 9). ***, p < 0.0001. (b) Carboxyfluorescein succinimidyl ester (CFSE)-labelled naïve pmel-1 CD8+ T cells were stimulated with anti-CD3/CD28 beads in the presence of surface bound aCD45/IL-15Sa-NGs (7.5 μg IL-15Sa/106 T cells) or incubated with an equivalent amount of free IL-15Sa for indicated days then analysed by flow cytometry. (c) CFSE dilution of naïve pmel-1 CD8+ T cells stimulated with anti-CD3/CD28 beads in the presence of various densities of surface bound aCD45/IL-15Sa-NGs. (d) Flow cytometry analysis of IL-15 surface receptors, pSTAT5, and Ki67 levels in naïve pmel-1 CD8+ T cells stimulated with anti-CD3/CD28 beads in the presence of surface bound aCD45/IL-15Sa-NGs (7.5 μg IL-15Sa/106 cells) or incubated with an equivalent amount of free IL-15Sa over 9 days. All data are one representative of at least two independent experiments.
Figure 4
Figure 4. IL-15Sa-NGs promote specific expansion of adoptively transferred T cells in tumors
B16F10 tumor cells (0.5 × 10⁶) were injected s.c. in Thy1.2+ C57Bl/6 mice and allowed to establish for 6 days. Animals were then sublethally lymphodepleted by irradiation on day 6 and received i.v. adoptive transfer of 10×106 primed pmel-1 Thy1.1+CD8+ T cells on day 7. Treatment groups included T cells alone, T cells followed by a systemic injection of free IL-15Sa (40 μg), and T cells coupled with aCD45/IL-15Sa-NGs (40 μg). On day 14, mice were sacrificed and tissues were processed and analysed by flow cytometry (n=4 biologically independent animals). (a) Experimental timeline. (b) Representative flow cytometry plots showing the frequencies of tumor infiltrating Thy1.1+CD8+ T cells among all the lymphocytes. (c-f) Counts of adoptively transferred (ACT) Thy1.1+CD8+ T cells (red squares) and endogenous Thy1.1CD8+ T cells (black triangles) in blood (c, normalized by volume), non-tumor draining lymph nodes (d, distal LNs), tumor draining lymph nodes (e, TDLNs) and tumors (f, normalized by weight). (g) Ratios of counts of ACT CD8+ T cells in the group of T + aCD45/IL-15Sa-NG to that of T + free IL-15Sa in different tissues. (h) Counts of Ki67+ ACT CD8+ T cells in tumors analysed by intracellular staining and flow cytometry. (i) Counts of GranzymeB+ ACT CD8+ T cells in tumors analysed by intracellular staining and flow cytometry on Day 10 (n=5 biologically independent animals). (j) Counts of polyfunctional ACT CD8+ T cells in tumors by intracellular cytokine staining. Data represent the mean ± s.e.m. and are analysed by One-Way ANOVA and Tukey’s tests. All data are one representative of at least two independent experiments.
Figure 5
Figure 5. IL-15Sa-NG backpacks increase the therapeutic window for adjuvant cytokine delivery during ACT
B16F10 tumor cells (0.5 × 10⁶) were injected s.c. in Thy1.2+ C57Bl/6 mice and allowed to establish tumor for 6 days. Animals were then sublethally lymphodepleted by irradiation on day 6 and received i.v. adoptive transfer of 10×106 activated pmel-1 Thy1.1+CD8+ T cells on day 7. Animals received sham injections of PBS, T cells only, T cells followed by different doses of i.v. injected free IL-15Sa as single dose (immediately after adoptive transfer) or split into multiple doses (days 7, 10, 13 and 16), or T cells backpacked with aCD45/IL-15Sa-NG at different doses. Body weights and systemic cytokine/chemokine/liver enzyme levels were analysed over time. (a) Experimental timeline and groups. (b) Body weight normalized to day 7 over time for different treated groups. (c-e) Counts of cytokine+ endogenous CD8+ T cells (c) and ACT CD8+ T cells (d) in blood analysed by intracellular cytokine staining and flow cytometry. (e, f) Serum cytokine levels (e) and liver enzymes (f) were measured from samples collected on day 17 or when the mice were euthanized due to toxicity. Data represent the mean ± s.e.m. (n=5 biologically independent animals) and are compared with control group (T cells only) for statistical analyses using One-Way ANOVA and Tukey’s tests; n.d., not detectable. Shown is one representative of two independent experiments.
Figure 6
Figure 6. TCR signalling-responsive NG backpacks improve T cell therapies
(a, b) B16F10 tumor cells (0.5 × 10⁶) were injected s.c. in Thy1.2+ C57Bl/6 mice (n=5 biologically independent animals) and allowed to establish for 6 days. Animals were then sublethally lymphodepleted by irradiation on day 6 and received i.v. adoptive transfer of 10 × 106 activated pmel-1 Thy1.1+CD8+ T cells on day 7. Animals received sham injections of PBS, T cells only, T cells with 10 μg i.v. injected free IL-15Sa, or aCD45/IL-15Sa-NG-backpacked T cells at indicated IL-15Sa doses. Shown are average tumor growth curves (a) and survival curves (b) of each treatment group. (c-f) Luciferase-expressing U-87 MG human glioblastoma cells (1.0 × 10⁶) were injected s.c. in NSG mice (n=5 biologically independent animals). Animals received i.v. adoptive transfer of human T cells (2.6 × 10⁶ total cells, 38% transduced with EGFR-targeting CAR (1.0 × 10⁶ CAR-T cells)) on day 7. Animals were treated with sham saline injections, CAR-T alone, CAR-T followed by 13.8 μg of free IL-15Sa, or CAR-T cells coupled with aCD45/IL-15Sa-NGs (13.8 μg). (d) In vivo bioluminescence imaging of luciferase-expressing U-87 MG tumors over time. (e-f) Individual tumor growth curves (e) and survival curves (f) of treatment groups are shown. Statistical analyses were performed using Two-Way ANOVA test for tumor growth data and Log-rank test for survival curves. Data represent the mean ± s.e.m. All data are one representative of at least two independent experiments.

References

    1. Rosenberg SA, Restifo NP. Adoptive cell transfer as personalized immunotherapy for human cancer. Science. 2015;348:62–68. - PMC - PubMed
    1. Gill S, June CH. Going viral: chimeric antigen receptor T cell therapy for hematological malignancies. Immunol Rev. 2015;263:68–89. - PubMed
    1. Corrigan-Curay J, Kiem HP, Baltimore D, O'Reilly M, Brentjens RJ, Cooper L, Forman S, Gottschalk S, Greenberg P, Junghans R, Heslop H, Jensen M, Mackall C, June C, Press O, Powell D, Ribas A, Rosenberg S, Sadelain M, Till B, Patterson AP, Jambou RC, Rosenthal E, Gargiulo L, Montgomery M, Kohn DB. T cell immunotherapy: looking forward. Mol Ther. 2014;22:1564–1574. - PMC - PubMed
    1. Johnson LA, Scholler J, Ohkuri T, Kosaka A, Patel PR, McGettigan SE, Nace AK, Dentchev T, Thekkat P, Loew A, Boesteanu AC, Cogdill AP, Chen T, Fraietta JA, Kloss CC, Posey AD, Engels B, Singh R, Ezell T, Idamakanti N, Ramones MH, Li N, Zhou L, Plesa G, Seykora JT, Okada H, June CH, Brogdon JL, Maus MV. Rational development and characterization of humanized anti–EGFR variant III chimeric antigen receptor T cells for glioblastoma. Sci Transl Med. 2015;7:275ra222. - PMC - PubMed
    1. Klebanoff CA, Finkelstein SE, Surman DR, Lichtman MK, Gattinoni L, Theoret MR, Grewal N, Spiess PJ, Antony PA, Palmer DC, Tagaya Y, Rosenberg SA, Waldmann TA, Restifo NP. IL-15 enhances the in vivo antitumor activity of tumor-reactive CD8+ T Cells. Proc Natl Acad Sci. 2004;101:1969–1974. - PMC - PubMed

Publication types