Observational Study
. 2019 Jan;19(1):98-109.
doi: 10.1111/ajt.15011. Epub 2018 Aug 31.

Development and clinical validity of a novel blood-based molecular biomarker for subclinical acute rejection following kidney transplant

Affiliations
Observational Study

Development and clinical validity of a novel blood-based molecular biomarker for subclinical acute rejection following kidney transplant

John J Friedewald et al. Am J Transplant. 2019 Jan.

Abstract

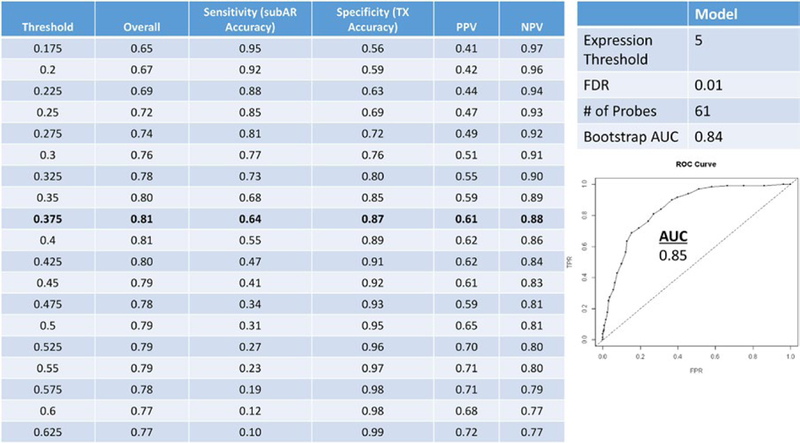
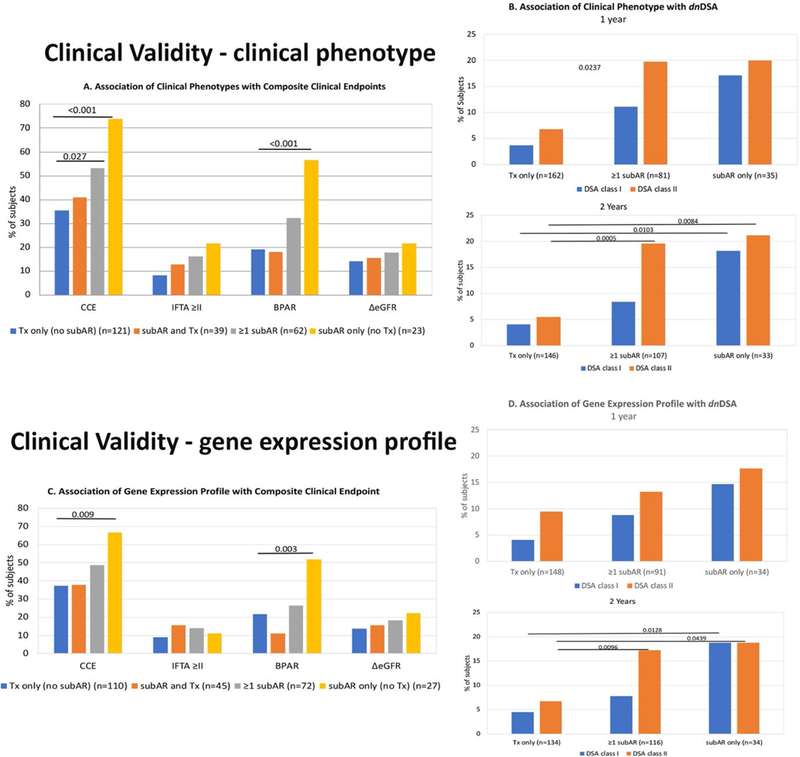
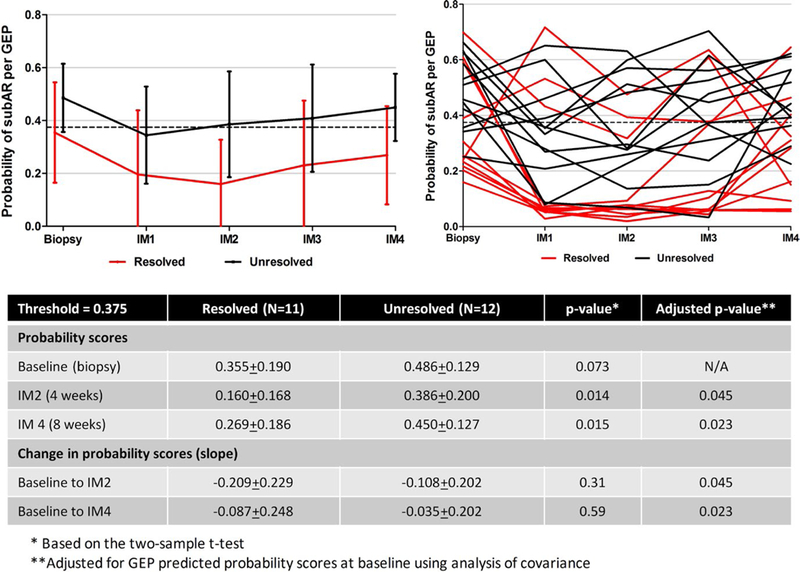
Noninvasive biomarkers are needed to monitor stable patients after kidney transplant (KT), because subclinical acute rejection (subAR), currently detectable only with surveillance biopsies, can lead to chronic rejection and graft loss. We conducted a multicenter study to develop a blood-based molecular biomarker for subAR using peripheral blood paired with surveillance biopsies and strict clinical phenotyping algorithms for discovery and validation. At a predefined threshold, 72% to 75% of KT recipients achieved a negative biomarker test correlating with the absence of subAR (negative predictive value: 78%-88%), while a positive test was obtained in 25% to 28% correlating with the presence of subAR (positive predictive value: 47%-61%). The clinical phenotype and biomarker independently and statistically correlated with a composite clinical endpoint (renal function, biopsy-proved acute rejection, ≥grade 2 interstitial fibrosis, and tubular atrophy), as well as with de novo donor-specific antibodies. We also found that <50% showed histologic improvement of subAR on follow-up biopsies despite treatment and that the biomarker could predict this outcome. Our data suggest that a blood-based biomarker that reduces the need for the indiscriminate use of invasive surveillance biopsies and that correlates with transplant outcomes could be used to monitor KT recipients with stable renal function, including after treatment for subAR, potentially improving KT outcomes.

Keywords: alloantibody; biomarker; clinical research/practice; clinical trial; genomics; kidney transplantation/nephrology; rejection: subclinical; translational research/science.


Conflict of interest statement

DISCLOSURE

The authors of this manuscript have conflicts of interest to disclose as described by the American Journal of Transplantation. Drs Friedewald, Kurian, Whisenant, and Abecassis are paid consultants of and Drs Friedewald, Kurian, and Abecassis have equity interests in Transplant Genomics, Inc.

Figures

FIGURE 1
FIGURE 1
Discovery on 530 Clinical Trials in Organ Transplantation 08 (CTOT‐08) paired peripheral blood and surveillance biopsy samples cohort. We ran the top random forests model from the differentially expressed gene data with threshold selection and predictive metrics on 530 paired samples from the CTOT‐08 (400 [75.5%] transplant excellent [TX]; 130 [24.5%] subclinical acute rejection [subAR]) discovery training set cohort (100000 trees, expression threshold of 5, and false discovery rate [FDR] 0.01), optimizing for area under the curve (AUC; 0.85 [0.84 after internal validation by resampling bootstrap]). A predicted probability threshold of 0.375 was selected, yielding an overall accuracy of 0.81, specificity and negative predictive value (NPV) (87% and 88%, respectively) over sensitivity, and positive predictive value (PPV) (64% and 61%, respectively). The classifiers consisted of 61 probe sets mapping to 57 genes
FIGURE 2
FIGURE 2
Clinical validity is demonstrated by the clinical significance of both the clinical phenotype (CP) and the gene expression profile (GEP) of subclinical acute rejection (subAR) within the first 12 months on the composite clinical endpoint (CCE), as well as the association between the CP and GEP both within 12 and 24 months after kidney transplant (KT) and the development of de novo DSAs (dnDSAs) by the end of the study period (24 months). The data are presented according to 3 distinct groups of subjects who met the following criteria within either the first year or the study period (2 years) after KT: (1) subAR or positive biomarker only, (2) no subAR (transplant excellent [TX]) or negative biomarker only, and (3) ≥1 instance of subAR or a positive biomarker with ≥1 TX or negative biomarker. A. Association of CP with CCE. Shown are the percentage of subjects who reached an endpoint (either the CCE) or each individual component of the CCE (grade ≥2 interstitial fibrosis/tubular atrophy [IFTA] on 24-month biopsy, any episode of biopsy-proved acute rejection [BPAR], or drop in glomerular filtration rate >10 mL/min/1.73 m2 between months 4 and 24). Subjects are divided based on CP (those with only TX on biopsies [blue bars], those with either subAR or TX [orange bars], those with ≥1 episode of subAR [gray bars], and those with only subAR [yellow bars] on surveillance biopsies). B. Association of CP with dnDSAs. 1. Percentage of subjects who developed dnDSAs at any time during the study, either class I (blue bars) or class II (orange bars), based on their CP group in the 24-month trial (subjects who had TX only on biopsies, ≥1 episode of subAR on biopsy, or only subAR on surveillance biopsy). 2. Similar depiction as panel 1 for the association between dnDSAs and CPs but limited to biopsy results obtained in the first year posttransplant. C. Association of GEP with CCE. Similar to A, shown are the percentage of subjects who reached an endpoint (either CCE) or each individual component of the CCE (grade ≥2 IFTA on 24-month biopsy, any episode of BPAR, or drop in glomerular filtration rate >10 mL/min/1.73 m2 between months 4 and 24). Subjects are divided by their GEP tests results: those subjects who had only TX on GEP (blue bars), those with either subAR or TX (orange bars), those with ≥1 test with subAR (gray bars), and those who had only subAR tests (yellow bars). D. Association of GEP with dnDSAs. 1. Association between the gene GEP test and the development of dnDSAs at any time posttransplant. This includes GEP tests done within the 24-month study period. Shown are the percentage of subjects who developed dnDSAs, both class I (blue bars) and class II (orange bars) grouped based on GEP tests. The subject groups are those with only TX blood tests, ≥1 subAR blood test, or only subAR blood tests. All blood tests were paired with surveillance biopsies. 2. Similar depiction as panel 1 with the association between dnDSAs and the GEP but limited to GEP blood test results obtained in the first year posttransplant.
FIGURE 3
FIGURE 3
Predictive probabilities after diagnosis and treatment of subclinical acute rejection (subAR). Gene expression profile (GEP)–based probability scores for intense monitoring (IM) subjects (n = 23) were determined every 2 weeks (IM visits 1‐4) after the diagnosis of subAR. While treatment was triggered by the local biopsy report in 19 of 23 subjects, resolution of subAR was assessed by comparing the centrally read histologic findings of the baseline biopsy to the repeat biopsy done at 8 weeks. Of 23 subjects (8 treated), 11 showed improvement of the biopsy (resolved [red lines]), whereas 12 (11 treated) showed either no improvement or worsening (unresolved [black lines]) rejection. Trends in probability scores are shown for the 2 groups on the left and for individual subjects on the right. There were differences in baseline predictive probabilities that did not reach significance (P = .073). Significant differences were seen between the group with resolution of subAR compared with the unresolved group in the predicted probabilities of the subAR gene expression profile at 4 (P = .014) and 8 (P = .015) weeks. When baseline values were adjusted, these differences remained significant between the 2 groups, as did the slope between baseline and 4 (P = .045) and 8 weeks (P = .023)

Comment in

References

    1. Tonelli M, Wiebe N, Knoll G, et al. Systematic review: kidney trans¬plantation compared with dialysis in clinically relevant outcomes. Am J Transplant. 2011;11(10):2093–2109. - PubMed
    1. US Renal Data System. 2016 USRDS annual data report: Epidemiology of kidney disease in the United States. Bethesda, MD: National Institutes of Health, National Institute of Diabetes and Digestive and Kidney Diseases; 2016.
    1. Hart A, Smith JM, Skeans MA, et al. Kidney. Am J Transplant. 2016;16(Suppl 2):11–46. - PMC - PubMed
    1. Meier-Kriesche HU, Schold JD, Srinivas TR, Kaplan B. Lack of improvement in renal allograft survival despite a marked decrease in acute rejection rates over the most recent era. Am J Transplant. 2004;4(3):378–383. - PubMed
    1. Nankivell BJ, Chapman JR. The significance of subclinical rejection and the value of protocol biopsies. Am J Transplant. 2006;6(9):2006–2012. - PubMed

Publication types