. 2018 Jul 9;14(7):e1007484.
doi: 10.1371/journal.pgen.1007484. eCollection 2018 Jul.

GROWTH-REGULATING FACTOR 9 negatively regulates arabidopsis leaf growth by controlling ORG3 and restricting cell proliferation in leaf primordia

Affiliations

GROWTH-REGULATING FACTOR 9 negatively regulates arabidopsis leaf growth by controlling ORG3 and restricting cell proliferation in leaf primordia

Mohammad Amin Omidbakhshfard et al. PLoS Genet. .

Abstract

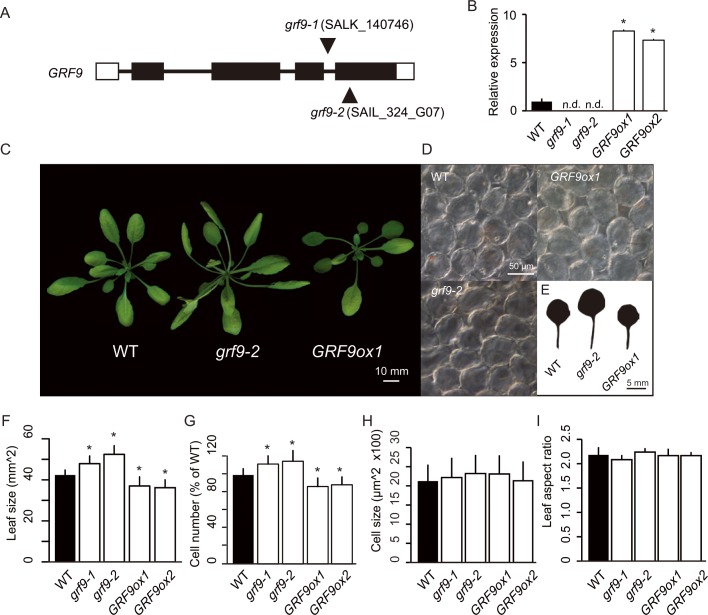
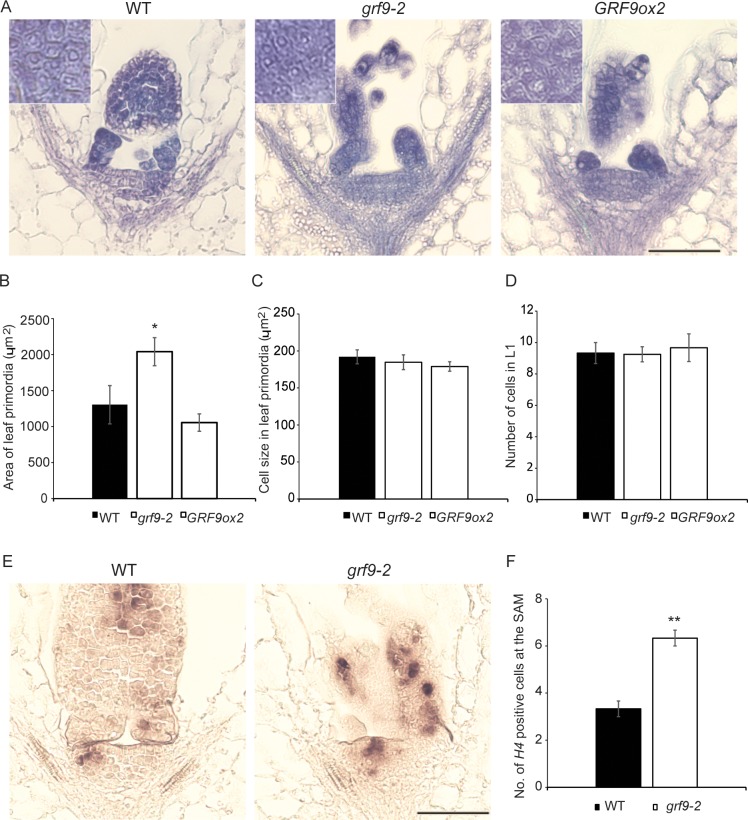
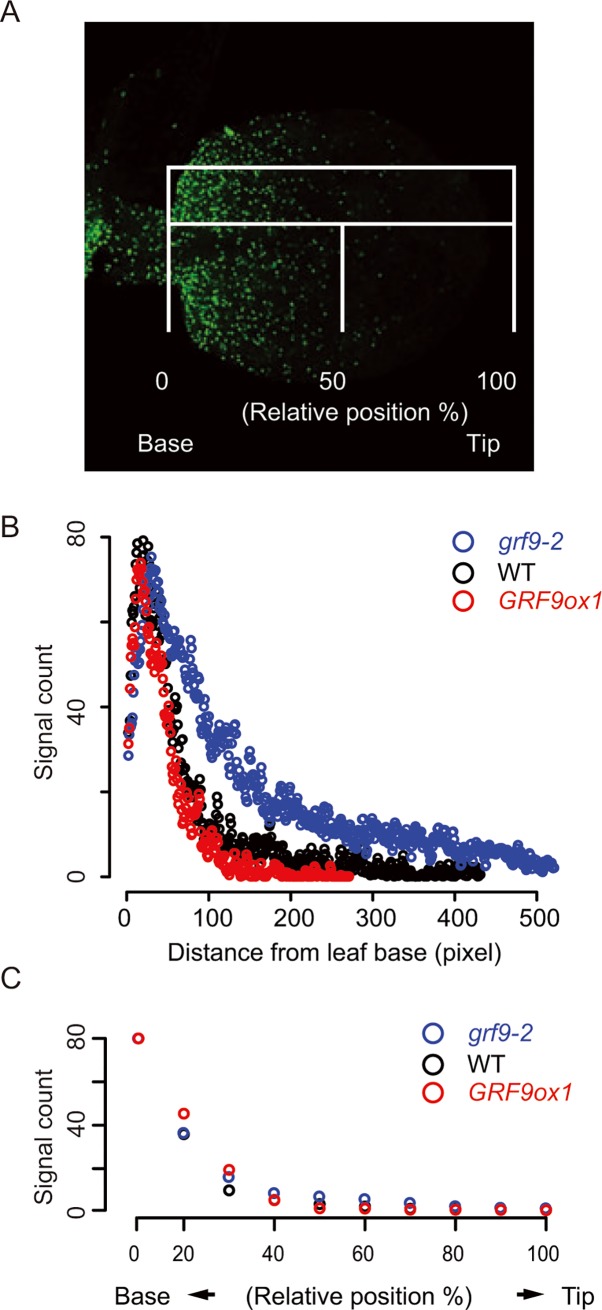
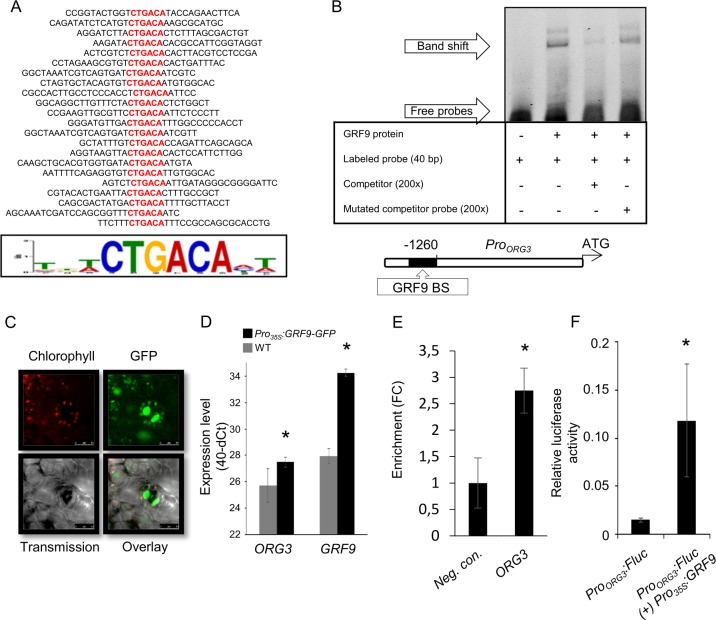
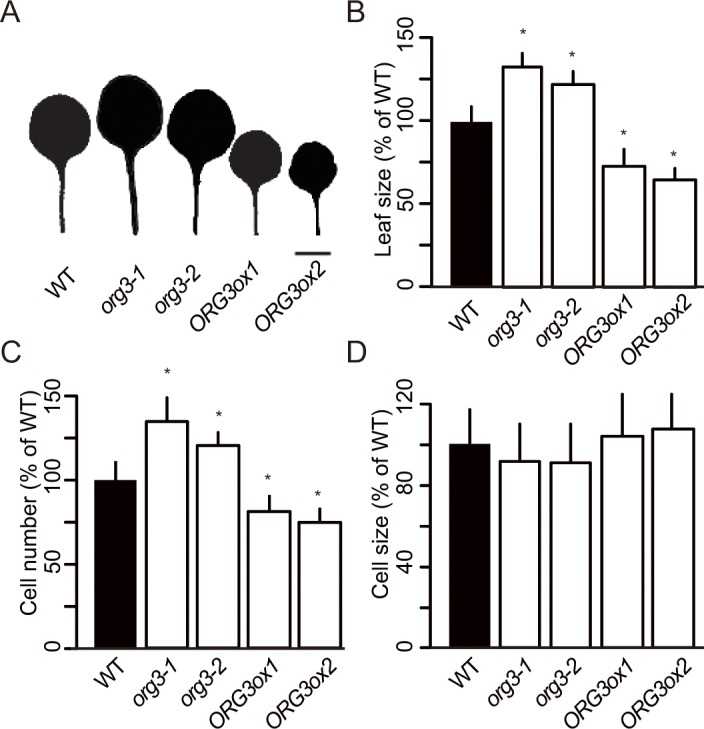
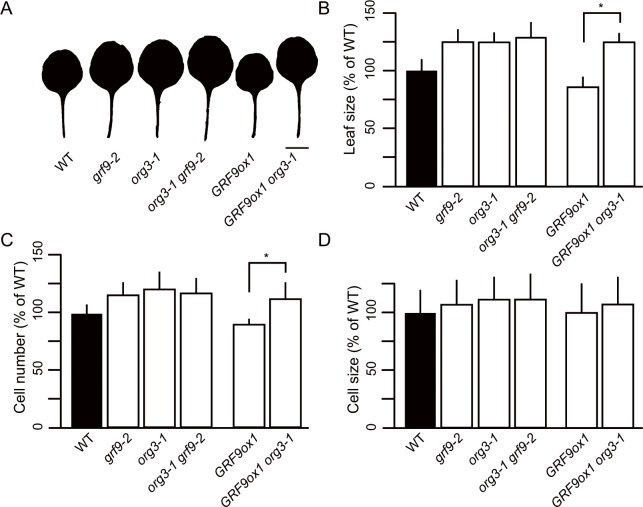
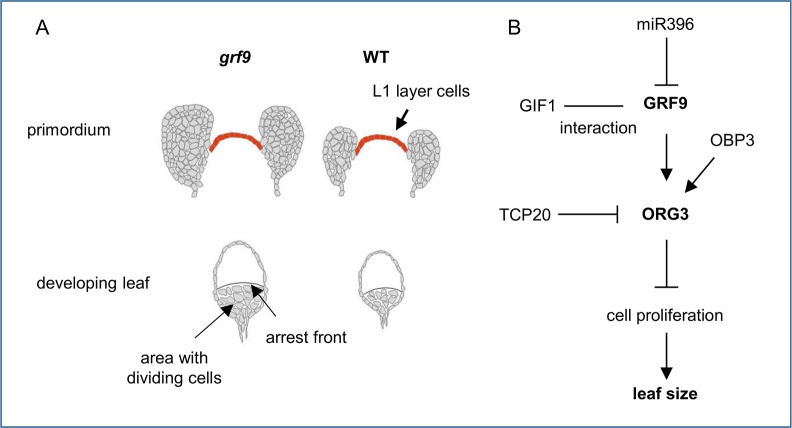
Leaf growth is a complex process that involves the action of diverse transcription factors (TFs) and their downstream gene regulatory networks. In this study, we focus on the functional characterization of the Arabidopsis thaliana TF GROWTH-REGULATING FACTOR9 (GRF9) and demonstrate that it exerts its negative effect on leaf growth by activating expression of the bZIP TF OBP3-RESPONSIVE GENE 3 (ORG3). While grf9 knockout mutants produce bigger incipient leaf primordia at the shoot apex, rosette leaves and petals than the wild type, the sizes of those organs are reduced in plants overexpressing GRF9 (GRF9ox). Cell measurements demonstrate that changes in leaf size result from alterations in cell numbers rather than cell sizes. Kinematic analysis and 5-ethynyl-2'-deoxyuridine (EdU) incorporation assay revealed that GRF9 restricts cell proliferation in the early developing leaf. Performing in vitro binding site selection, we identified the 6-base motif 5'-CTGACA-3' as the core binding site of GRF9. By global transcriptome profiling, electrophoretic mobility shift assay (EMSA) and chromatin immunoprecipitation (ChIP) we identified ORG3 as a direct downstream, and positively regulated target of GRF9. Genetic analysis of grf9 org3 and GRF9ox org3 double mutants reveals that both transcription factors act in a regulatory cascade to control the final leaf dimensions by restricting cell number in the developing leaf.


Conflict of interest statement

The authors have declared that no competing interests exist.

Figures

Fig 1
Fig 1. Characterization of the grf9 and GRF9ox lines.
(A) Schematic representation of the GRF9 locus and the locations of the T-DNA insertions (black triangles) in the grf9-1 and grf9-2 knockout mutants. White rectangles represent untranslated regions (UTRs), black rectangles show protein-coding regions, and thick connecting lines indicate introns. (B) Expression level of GRF9 determined by qRT-PCR in grf9 knockout and GRF9ox plants, compared to WT, for which expression is set to 1. No GRF9 expression was detected in grf9 knockout mutants (n.d.). The results are shown as means of three replicates ± SD. (C) Rosette phenotype. (D) Palisade cells of first-pair leaves of 21-day-old plants observed from a paradermal view. (E) Scans of representative first-pair leaves of WT, grf9-2 and GRF9ox1 seedlings. (F) Leaf sizes of WT, grf9 mutants and GRF9ox lines (n > 8 leaves). (G) Total number of palisade cells in the subepidermal layer of mature first leaves (n > 8 leaves). (H) Sizes of palisade cells observed from a paradermal view (n > 240 cells from more than eight leaves). (I) Leaf aspect ratio (ratio of leaf length to leaf width) of WT, grf9 mutants and GRF9ox plants. Means ± SD. Plants were grown for 3 weeks under a 16 h light / 8 h dark fluorescent illumination cycle at 120 μmol m-2 s-1. Asterisks in panels B, F and G indicate significant difference (Student's t-test; p < 0.05) from WT. Bars = 10 mm (panel C), 50 μm (panel D), and 5 mm (panel E).
Fig 2
Fig 2. GRF9 affects the size of leaf primordia in the shoot apical meristem (SAM).
(A) Emergence of first leaf primordia in 2-day-old WT, grf9-2 and GRF9ox2 plants grown in long day (LD) conditions (16 h light/8 h dark) analysed by toluidine blue staining. (B) Area of first leaf primordia of WT, grf9-2 and GRF9ox2 plants (n > 4 primordia). (C) Size of cells in leaf primordia of WT, grf9-2 and GRF9ox2 plants (n > 7 cells from more than four primordia). (D) Number of cells in the layer 1 (L1) of the SAM (n = 3 plants). (E) RNA in situ hybridization using HISTONE4 (H4) as probe on longitudinal sections of the apical meristem with young leaf primordia of 2-day-old WT and grf9-2 plants. (F) Number of cells expressing HISTONE4 (H4) at the SAM (n = 3 meristems). Error bars represent ± SEM. Scale bars 100 μm (panels A and E).
Fig 3
Fig 3. Time-course analysis of leaf growth.
(A) Number of cells along the basal-apical axis of the first set of developing leaves in WT, grf9 knockout and GRF9ox lines. The curves show fitting to the experimental data with a polynomial function. R2 values are > 0.99 in all cases. At days 3 and 4 after germination, cell numbers are significantly higher in the two grf9 mutants than in WT (Student's t-test; day 3, p ≤ 0.01; day 4, p ≤ 0.001). At days 5 to 14, cell numbers are significantly higher in the two grf9 mutants than in WT, and significantly lower in the two GRF9ox lines (Student's t-test; P values between p ≤ 0.05 and p ≤ 0.001). Data are means of 6–14 leaves for the different genotypes and time points ± SD. The full data are given in S4 Table). (B) Increment of the number of cells in the adaxial subepidermal layer along the basal-apical leaf axis. Left: increment (Δ cell number) between day 3 and day 4 (D4-D3); right: increment between day 5 and day 10 (D10-D5) in WT and GRF9 transgenic plants. See S4 Table for the full data. (C) Relative expression levels of cell cycle-related genes in the leaf primordia from 7-day-old and 14-day-old WT, grf9-2 and GRF9ox1 plants. Gene expression in the WT is set to 1. Data are means ± SD (n > 8 seedlings).
Fig 4
Fig 4. Determination of actively proliferating cells in WT, grf9 and GRF9ox plants using 5-ethynyl-2'-deoxyuridine (EdU) incorporation assay.
The first true leaves of 5-day-old seedlings were analysed. (A) Example of an EdU-stained Arabidopsis leaf. Green signals indicate cells undergoing mitosis. (B) EdU signal distribution in leaves, and (C) relative occupancy of proliferating cells within the developing leaves in grf9-2, GRF9ox1 and WT plants. Data represent average signals from at least eight seedlings.
Fig 5
Fig 5. GRF9 directly regulates ORG3.
(A) GRF9 DNA-binding sequences determined using in vitro binding site selection. All selected oligonucleotides contain a functional GRF9-binding site as verified in DNA-binding assays. The nucleotides in the core binding sequence are shown in red. The logo of the GRF9 binding sequence profile was generated using the MEME program (http://meme.sdsc.edu/meme/cgi-bin/meme.cgi). (B) GRF9 binds in vitro to the ORG3 fragment harboring the GRF9 binding site. A schematic view of the ORG3 promoter (around 1.5 kb upstream of the translation start site) containing the GRF9 binding sequence (BS) is shown at the bottom (BS; black box). Electrophoretic mobility shift assay (EMSA) using GRF9-CELD protein and a 40-bp sequence of the ORG3 promoter harboring the GRF9 BS. GRF9-CELD protein incubated with those oligonucleotides causes retardation ('Band shift'). Retardation disappeared in the presence of competitor (unlabeled probe at high concentration) whilst adding a molar excess of mutated probe did not block the interaction between GRF9 protein and the labelled probe, indicating specific binding of GRF9 to the CTGACA binding site. (C) Laser scanning confocal microscopy images showing nuclear localization of GRF9-GFP fusion protein in 3-week-old transgenic Arabidopsis plants expressing GFP-tagged GRF9 protein. (D) Expression level of GRF9 and ORG3 in Pro35S:GRF9-GFP and WT (Col-0) plants. Expression was determined by qRT-PCR and values represent the means of replicates from three biological replicates ± SD. (E) GRF9 binds in vivo to the ORG3 promoter. ChIP-qPCR results of 5-day-old Pro35S:GRF9-GFP Arabidopsis seedlings. Data represent average enrichment (fold change, FC) in three independent biological replicates ± SD. (F) GRF9 transactivates the ORG3 promoter in vivo. Relative luciferase activity detected in Arabidopsis mesophyll cell protoplasts. Data are means ± SD of three independent transformations, each representing five technical replicates. The asterisks indicate significant difference (Student's t-test; p < 0.05).
Fig 6
Fig 6. Characterization of org3 mutants and ORG3ox plants.
(A) Scans of representative first-pair leaves, (B) leaf size, (C) number of palisade cells, and (D) size of palisade cells (n > 240 cells) in WT, org3-1, org3-2, ORG3ox1 and ORG3ox2 plants. Results are expressed as percentage of WT ± SD. First-pair leaves from 21-day-old plants were analyzed (n > 8 in all cases). Asterisks indicate significant difference from WT (Student's t-test; p < 0.05). In (A), bar = 10 mm.
Fig 7
Fig 7. Characterization of the grf9 org3 and GRF9ox org3 double mutants.
(A) Scans of representative first-pair leaves, (B) leaf area, (C) number of palisade cells, and (D) cell area of palisade cells (n > 240 cells) in WT, grf9-2, org3-1, org3-1 grf9-2 (line 7), GRF9ox1, and GRF9ox1 org3-1 (line 34) mutants. Data are expressed as a percentage of WT ± SD. First leaves from 21-day-old plants were analyzed (n > 8 in all cases). Asterisks in panels (B) and (C) indicate significant difference (Student's t-test; p < 0.05). In (A), bar = 10 mm.
Fig 8
Fig 8. Model of GRF9 action.
(A) GRF9 restricts the size of the incipient leaf primordium at the shoot apex, whitout affecting cell size or the size of the SAM. While leaf primordium size is increased in grf9 mutants, compared to wild type (WT), it trends to be smaller in GRF9 overexpressor (GRF9ox) plants. Similarly, cell numbers in young developing leaves are bigger in grf9, but smaller in GRF9ox plants, in accordance with a higher number of cells in the developing grf9 leaves, potentially contributing to the position of the arrest front. (B) Gene regulatory network by which GRF9 and ORG3 influence leaf size. MiR396 targets GRF9 transcript and negatively regulates its abundance. GRF9 interacts with GIF1 which, similar to other GRFs, influences leaf size determination. ORG3 expression is positively regulated by GRF9 and OBP3, but repressed by the TCP20 transcription factor [7]. Finally, ORG3 negatively regulates cell proliferation thereby directly influencing leaf size. For more details, see text.

References

    1. Marcotrigiano M. A role for leaf epidermis in the control of leaf size and the rate and extent of mesophyll cell division. Am J Bot. 2010; 97:224–33. 10.3732/ajb.0900102 - DOI - PubMed
    1. Kawade K, Horiguchi G, Tsukaya H. Non-cell-autonomously coordinated organ size regulation in leaf development. Development. 2010; 137:4221–7. 10.1242/dev.057117 - DOI - PubMed
    1. Gonzalez N, Vanhaeren H, Inzé D. Leaf size control: complex coordination of cell division and expansion. Trends Plant Sci. 2012; 17:332–40. 10.1016/j.tplants.2012.02.003 - DOI - PubMed
    1. Hepworth J, Lenhard M. Regulation of plant lateral-organ growth by modulating cell number and size. Curr Opin Plant Biol. 2014; 17:36–42. 10.1016/j.pbi.2013.11.005 - DOI - PubMed
    1. Donnelly PM, Bonetta D, Tsukaya H, Dengler RE, Dengler NG. Cell cycling and cell enlargement in developing leaves of arabidopsis. Dev Biol. 1999; 215:407–19. 10.1006/dbio.1999.9443 - DOI - PubMed

MeSH terms