. 2018 Jul 6;9(7):344.
doi: 10.3390/genes9070344.

Using a Chemical Genetic Screen to Enhance Our Understanding of the Antibacterial Properties of Silver

Affiliations

Using a Chemical Genetic Screen to Enhance Our Understanding of the Antibacterial Properties of Silver

Natalie Gugala et al. Genes (Basel). .

Abstract

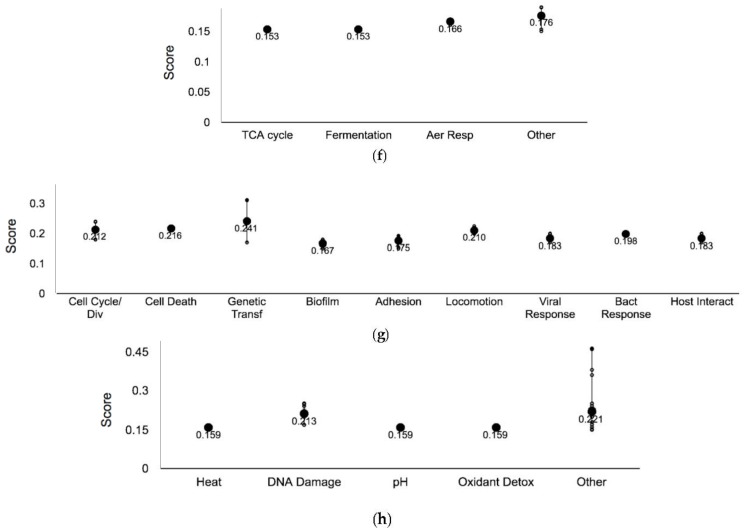
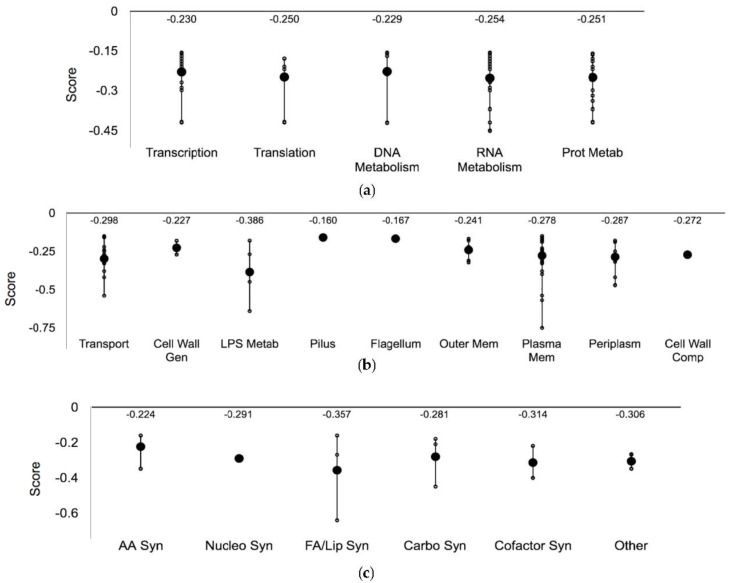
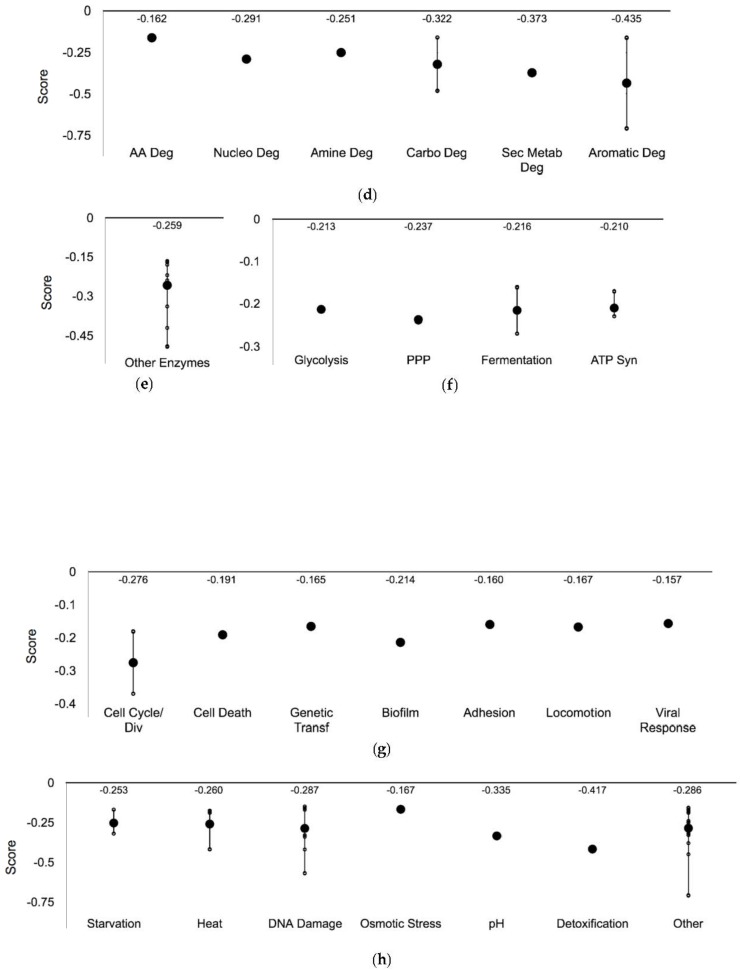
It is essential to understand the mechanisms by which a toxicant is capable of poisoning the bacterial cell. The mechanism of action of many biocides and toxins, including numerous ubiquitous compounds, is not fully understood. For example, despite the widespread clinical and commercial use of silver (Ag), the mechanisms describing how this metal poisons bacterial cells remains incomplete. To advance our understanding surrounding the antimicrobial action of Ag, we performed a chemical genetic screen of a mutant library of Escherichia coli—the Keio collection, in order to identify Ag sensitive or resistant deletion strains. Indeed, our findings corroborate many previously established mechanisms that describe the antibacterial effects of Ag, such as the disruption of iron-sulfur clusters containing proteins and certain cellular redox enzymes. However, the data presented here demonstrates that the activity of Ag within the bacterial cell is more extensive, encompassing genes involved in cell wall maintenance, quinone metabolism and sulfur assimilation. Altogether, this study provides further insight into the antimicrobial mechanism of Ag and the physiological adaption of E. coli to this metal.

Keywords: Escherichia coli; Keio collection; antimicrobials; silver; silver resistance; silver toxicity.


Conflict of interest statement

The authors declare no conflict of interest.

Figures

Figure 1
Figure 1
Synthetic Array Tools (version 1.0) was used to normalize and score the silver (Ag)-resistant and -sensitive gene hits as a means of representing the growth differences in Escherichia coli K12 BW25113 in the presence of 100 μM silver nitrate (AgNO3). Only those with a score greater or less than ±0.15, respectively, were selected for further analysis. Hits between ±0.15 were regarded as having neutral or non-specific interactions with Ag. The p-value was a two-tailed t-test and significance was determined using the Benjamini-Hochberg procedure; false discovery rate was selected to be 0.1. Each individual score represents the mean of 12 trials.
Figure 2
Figure 2
Ag-resistant and -sensitive gene hits mapped to component cellular processes. The cutoff fitness score implemented was −0.15 and 0.15 (two standard deviations from the mean) and the gene hits with a score less or greater than, respectively, were chosen for further analyses. The hits were mined using the Omics Dashboard (Pathway Tools), which surveys against the EcoCyc Database. Several gene hits are mapped to more than one subsystem. The p-value was calculated as a two-tailed t-test and significance was determined using the Benjamini-Hochberg procedure; false discovery rate was selected to be 0.1. Each individual score represents the mean of 12 trials.
Figure 3
Figure 3
Functional enrichment among the Ag-resistant and -sensitive gene hits. The DAVID gene functional classification (version 6.8) database, a false discovery rate of 0.1 and a score cutoff of −0.15 and 0.15 (two standard deviations from the mean) were used to measure the magnitude of enrichment against the genome of E. coli. Processes with a p-value < 0.05, fold enrichment value ≥3 and gene hits >3 are included only. Each individual score represents the mean of 12 trials.
Figure 4
Figure 4
Ag-resistant gene hits plotted against respective cellular processes. Y-axis representative of the normalized score, smaller circles represent the individual hits and the larger circles represent the mean of each subsystem. The p-value was calculated as a two-tailed t-test and significance was determined using the Benjamini-Hochberg procedure; false discovery rate was selected to be 0.1. Each individual score represents the mean of 12 trials. (a) Central Dogma; (b) Cell exterior; (c) Biosynthesis; (d) Degradation; (e) Other pathways; (f) Energy; (g) Cellular processes; and (h) Response to stimulus. Plots constructed using Pathway Tools, Omics Dashboard.
Figure 4
Figure 4
Ag-resistant gene hits plotted against respective cellular processes. Y-axis representative of the normalized score, smaller circles represent the individual hits and the larger circles represent the mean of each subsystem. The p-value was calculated as a two-tailed t-test and significance was determined using the Benjamini-Hochberg procedure; false discovery rate was selected to be 0.1. Each individual score represents the mean of 12 trials. (a) Central Dogma; (b) Cell exterior; (c) Biosynthesis; (d) Degradation; (e) Other pathways; (f) Energy; (g) Cellular processes; and (h) Response to stimulus. Plots constructed using Pathway Tools, Omics Dashboard.
Figure 5
Figure 5
Ag-sensitive gene hits plotted against respective cellular processes. Y-axis representative of the normalized score, smaller circles represent the individual hits and the larger circles represent the mean of each subsystem. The p-value was a two-tailed t-test and significance was determined using the Benjamini-Hochberg procedure; false discovery rate was selected to be 0.1. Each individual score represents the mean of 12 trials. (a) Central Dogma; (b) Cell exterior; (c) Biosynthesis; (d) Degradation; (e) Other pathways; (f) Energy; (g) Cellular processes; and (h) Response to stimulus. Plots constructed using Pathway Tools, Omics Dashboard.
Figure 5
Figure 5
Ag-sensitive gene hits plotted against respective cellular processes. Y-axis representative of the normalized score, smaller circles represent the individual hits and the larger circles represent the mean of each subsystem. The p-value was a two-tailed t-test and significance was determined using the Benjamini-Hochberg procedure; false discovery rate was selected to be 0.1. Each individual score represents the mean of 12 trials. (a) Central Dogma; (b) Cell exterior; (c) Biosynthesis; (d) Degradation; (e) Other pathways; (f) Energy; (g) Cellular processes; and (h) Response to stimulus. Plots constructed using Pathway Tools, Omics Dashboard.

References

    1. Turner R.J. Metal-Based Antimicrobial Strategies. Microb. Biotechnol. 2017;10:1062–1065. doi: 10.1111/1751-7915.12785. - DOI - PMC - PubMed
    1. Alexander J.W. History of the Medical Use of Silver. Surg. Infect. 2009;10:289–292. doi: 10.1089/sur.2008.9941. - DOI - PubMed
    1. Melaiye A., Youngs W.J. Silver and Its Application as an Antimicrobial Agent. Expert Opin. Ther. Pat. 2005;15:125–130. doi: 10.1517/13543776.15.2.125. - DOI
    1. Lemire J.A., Kalan L., Bradu A., Turner R.J. Silver Oxynitrate, an Unexplored Silver Compound with Antimicrobial and Antibiofilm Activity. Antimicrob. Agents Chemother. 2015;59:4031–4039. doi: 10.1128/AAC.05177-14. - DOI - PMC - PubMed
    1. Politano A.D., Campbell K.T., Rosenberger L.H., Sawyer R.G. Use of Silver in the Prevention and Treatment of Infections: Silver Review. Surg. Infect. 2013;14:8–20. doi: 10.1089/sur.2011.097. - DOI - PMC - PubMed

LinkOut - more resources