. 2018 Jul 7;19(7):1985.
doi: 10.3390/ijms19071985.

Detection of the Mitochondrial Membrane Potential by the Cationic Dye JC-1 in L1210 Cells with Massive Overexpression of the Plasma Membrane ABCB1 Drug Transporter

Affiliations

Detection of the Mitochondrial Membrane Potential by the Cationic Dye JC-1 in L1210 Cells with Massive Overexpression of the Plasma Membrane ABCB1 Drug Transporter

Katarina Elefantova et al. Int J Mol Sci. .

Abstract

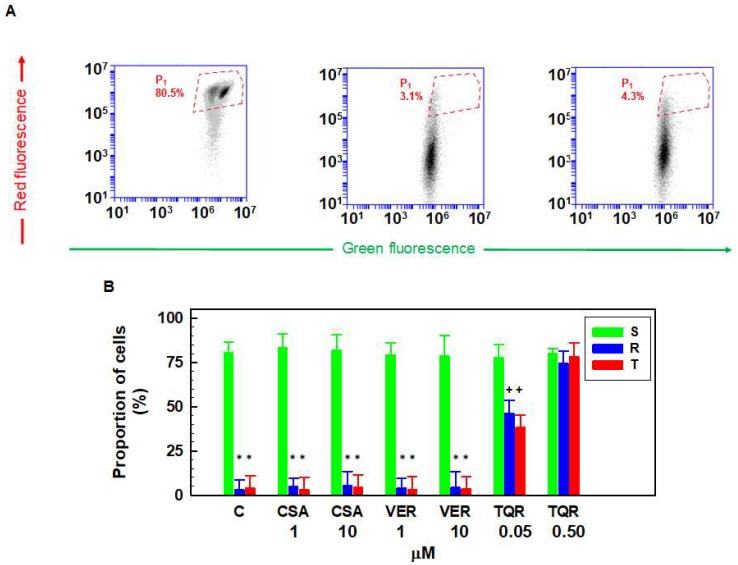
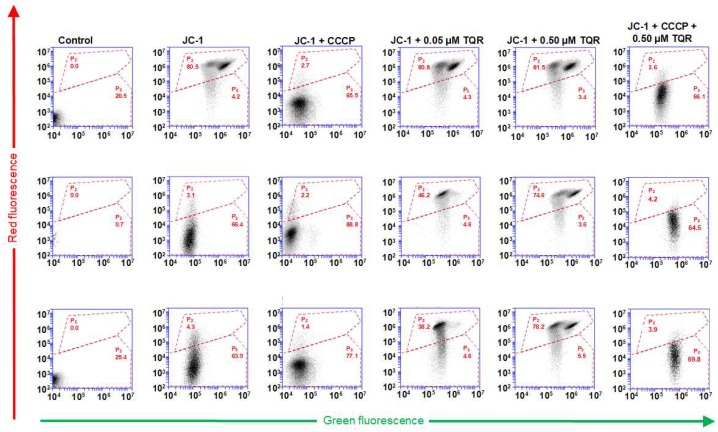
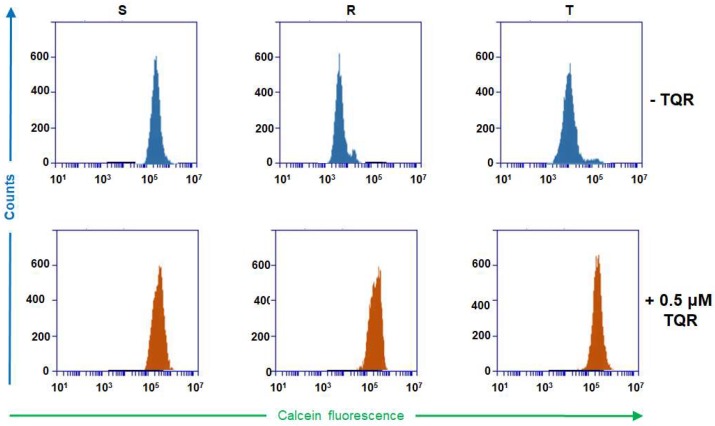
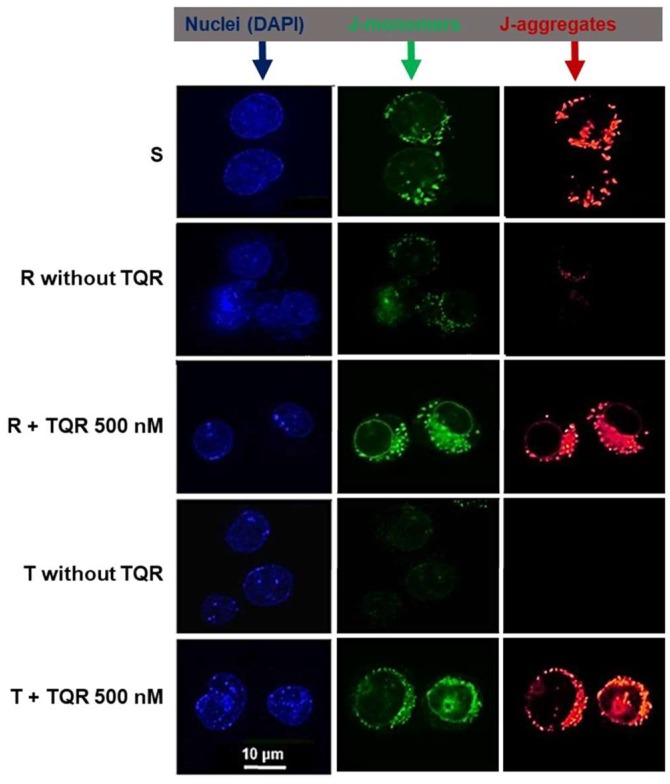
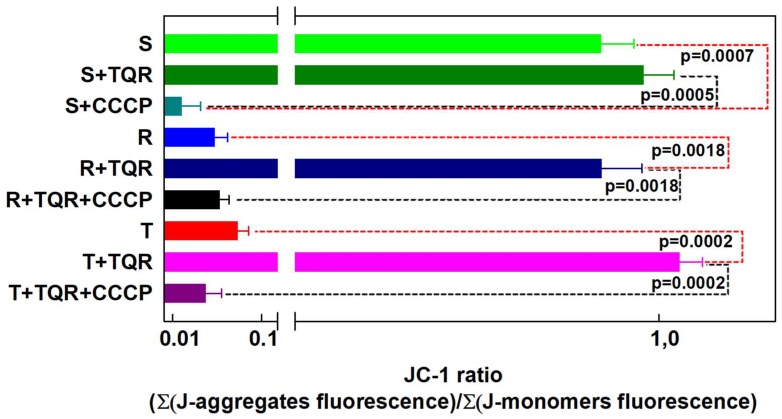
JC-1, a cationic fluorescent dye when added to living cells, is known to be localized exclusively in mitochondria, particularly in good physiological conditions characterized by sufficient mitochondrial membrane potential (ΔΨ). The accumulation of JC-1 in these organelles leads to the formation J-aggregates (with a specific red fluorescence emission maximum at 590 nm), which is in addition to the typical green fluorescence of J-monomers (emission maximum of ∼529 nm). The lack of mitochondrial ΔΨ leads to the depression of JC-1 mitochondrial accumulation and a decrease in J-aggregate formation. Therefore, the ratio between the red and green fluorescence of cells loaded with JC-1 is often used for the detection of the mitochondrial membrane potential. However, JC-1 represents a suitable substrate of the multidrug transporter P-glycoprotein (P-gp). Therefore, the depression of the JC-1 content in intracellular space and particularly in the mitochondria to a level that is inefficient for J-aggregate formation could be expected in P-gp-positive cells. In the current paper, we proved this behavior on parental P-gp-negative L1210 (S) cells and their P-gp-positive variants obtained by either selection with vincristine (R) or transfection with the human gene encoding P-gp (T). P-glycoprotein inhibitors cyclosporine A and verapamil fail to restore JC-1 loading of the R and T cells to an extent similar to that observed in S cells. In contrast, the noncompetitive high affinity P-gp inhibitor tariquidar fully restored JC-1 accumulation and the presence of the typical red fluorescence of J-aggregates. In the presence of tariquidar, measurement of the JC-1 fluorescence revealed similar levels of mitochondrial membrane potential in P-gp-negative (S) and P-gp-positive cells (R and T).

Keywords: JC-1; P-glycoprotein; mitochondrial membrane potential; multidrug resistance; tariquidar.


Conflict of interest statement

The authors declare no conflict of interest.

Figures

Figure 1
Figure 1
Detection of JC-fluorescence in S, R and T cells loaded with JC-1 in the absence or presence of P-gp inhibitors verapamil (VER), cyclosporine A (CSA) and tariquidar TQR. (A) Differences in the JC-1 signal between P-gp-negative (S) and P-gp-positive (R and T) cells measured by flow cytometry. The areas where the predominant proportions of S cells are present on the dot plots are bordered with red dashed lines. Data are representative for three independent measurements. Similar measurements as in (A) were also performed for cells influenced with VER, CSA (at concentrations of 1 and 10 μM) and TQR (in a concentration range of 0.05–0.50 μM). In the case of TQR, the control experiment was measured in the same concentration of dimethyl sulfoxide that was applied for TQR addition; (B) Effect of P-gp inhibitors on the JC-1 signal in S, R and T cells. The proportions of cells in the red-bordered areas in (A) are documented in the column plots. Data represent the mean ± SD from three independent measurements. Significance: * data differ significantly from the corresponding measurement obtained for S cells at the level p < 0.001; + data differ significantly from the corresponding measurement obtained for S cells at the level p < 0.01.
Figure 2
Figure 2
Measurement of JC-fluorescence in S, R and T cells loaded with JC-1 in the absence or presence of tariquidar and carbonyl cyanide 3-chlorophenylhydrazone. Data were evaluated using 18% compensation, which was detected as optimal (Figure S2, Supplementary materials). Typical double stained cells are present in area P2, and cells with limited staining are found in area P3, both bordered by red dashed lines. The data are representative of three independent measurement.
Figure 3
Figure 3
Recording of Calcein retention within S, R and T cells in the presence or absence of tariquidar (TQR). Calcein retention assays were performed in the absence and presence of TQR (at a concentration of 0.50 μM). The data are representative of three independent measurements.
Figure 4
Figure 4
Detection of JC-1 signals in S, R and T cells by fluorescence confocal microscopy. The double staining of cells by JC-1 is visible either as green for J-monomers or red for J-aggregates. Data are representative for three independent measurements. Cells were labeled by DAPI to visualize nuclei and JC-1 to visualize mitochondria. Fluorescence was registered using excitation at 488 nm and adjusting the emission of confocal microscopy for 4′,6-diamidino-2-phenylindole (DAPI; used for nuclei staining and visible as blue), J-monomers (visible as green) and J-aggregates (visible as red/orange). TQR—tariquidar.
Figure 5
Figure 5
Mitochondrial membrane potential of S, R and T cells detected by the JC-1 ratio (J-aggregate fluorescence/J-monomer fluorescence). The sums of J-aggregate and J-monomer fluorescence from the measurements documented in Figure 2 were obtained from flow cytometry data and were used for accounting for the respective JC-1 ratios. The results represent the mean ± SD from three independent measurements. Statistical significance: Data connected by either red or black dashed lines differ significantly on mentioned probability levels p.

References

    1. Seppet E., Gruno M., Peetsalu A., Gizatullina Z., Nguyen H.P., Vielhaber S., Wussling M.H., Trumbeckaite S., Arandarcikaite O., Jerzembeck D., et al. Mitochondria and energetic depression in cell pathophysiology. Int. J. Mol. Sci. 2009;10:2252–2303. doi: 10.3390/ijms10052252. - DOI - PMC - PubMed
    1. Ortiz-Lazareno P.C., Bravo-Cuellar A., Lerma-Diaz J.M., Jave-Suarez L.F., Aguilar-Lemarroy A., Dominguez-Rodriguez J.R., Gonzalez-Ramella O., de Celis R., Gomez-Lomeli P., Hernandez-Flores G. Sensitization of u937 leukemia cells to doxorubicin by the mg132 proteasome inhibitor induces an increase in apoptosis by suppressing NF-κB and mitochondrial membrane potential loss. Cancer Cell Int. 2014;14:13. doi: 10.1186/1475-2867-14-13. - DOI - PMC - PubMed
    1. Salvioli S., Ardizzoni A., Franceschi C., Cossarizza A. JC-1, but not DiOC6(3) or rhodamine 123, is a reliable fluorescent probe to assess delta psi changes in intact cells: Implications for studies on mitochondrial functionality during apoptosis. FEBS Lett. 1997;411:77–82. doi: 10.1016/S0014-5793(97)00669-8. - DOI - PubMed
    1. Chazotte B. Labeling mitochondria with JC-1. Cold Spring Harb Protoc. 2011;2011 doi: 10.1101/pdb.prot065490. - DOI - PubMed
    1. Cottet-Rousselle C., Ronot X., Leverve X., Mayol J.F. Cytometric assessment of mitochondria using fluorescent probes. Cytometry A. 2011;79:405–425. doi: 10.1002/cyto.a.21061. - DOI - PubMed

MeSH terms

LinkOut - more resources