

Analysis of coastal cod (Gadus morhua L.) sampled on spawning sites reveals a genetic gradient throughout Norway's coastline
- PMID: 29986643
- PMCID: PMC6036686
- DOI: 10.1186/s12863-018-0625-8
Analysis of coastal cod (Gadus morhua L.) sampled on spawning sites reveals a genetic gradient throughout Norway's coastline
Abstract
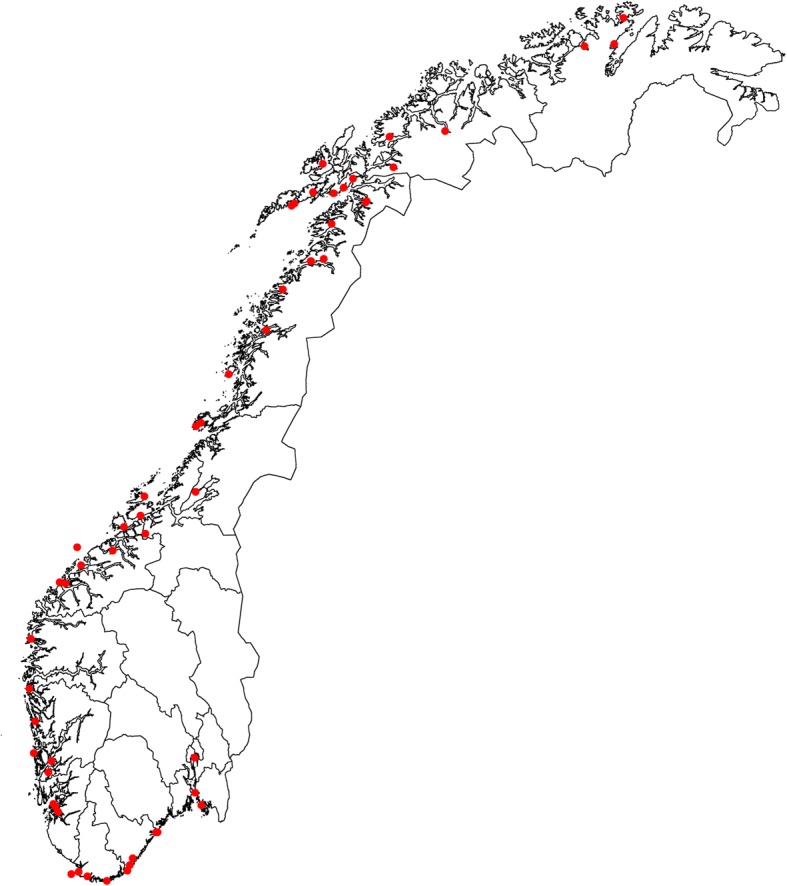
Background: Atlantic cod (Gadus morhua L.) has formed the basis of many economically significant fisheries in the North Atlantic, and is one of the best studied marine fishes, but a legacy of overexploitation has depleted populations and collapsed fisheries in several regions. Previous studies have identified considerable population genetic structure for Atlantic cod. However, within Norway, which is the country with the largest remaining catch in the Atlantic, the population genetic structure of coastal cod (NCC) along the entire coastline has not yet been investigated. We sampled > 4000 cod from 55 spawning sites. All fish were genotyped with 6 microsatellite markers and Pan I (Dataset 1). A sub-set of the samples (1295 fish from 17 locations) were also genotyped with an additional 9 microsatellites (Dataset 2). Otoliths were read in order to exclude North East Arctic Cod (NEAC) from the analyses, as and where appropriate.
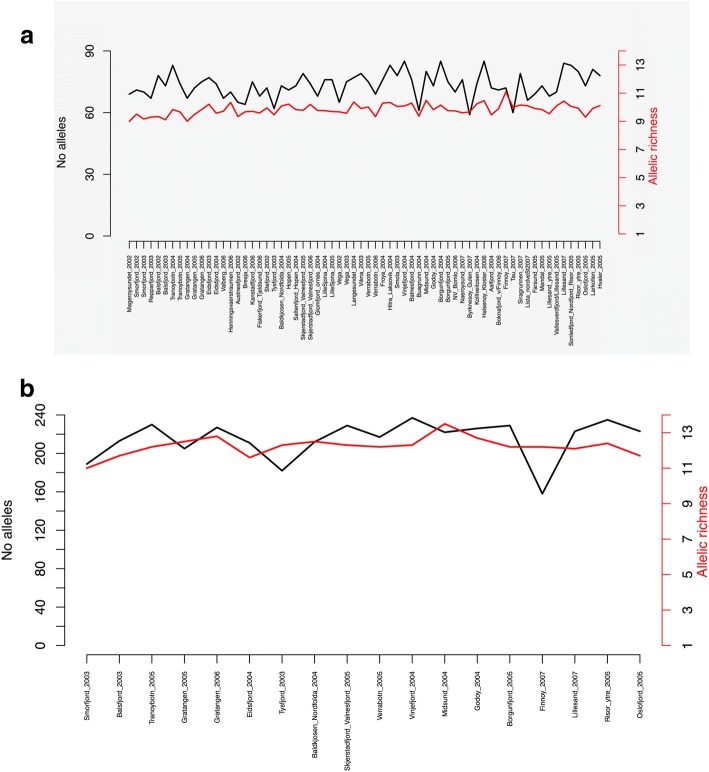
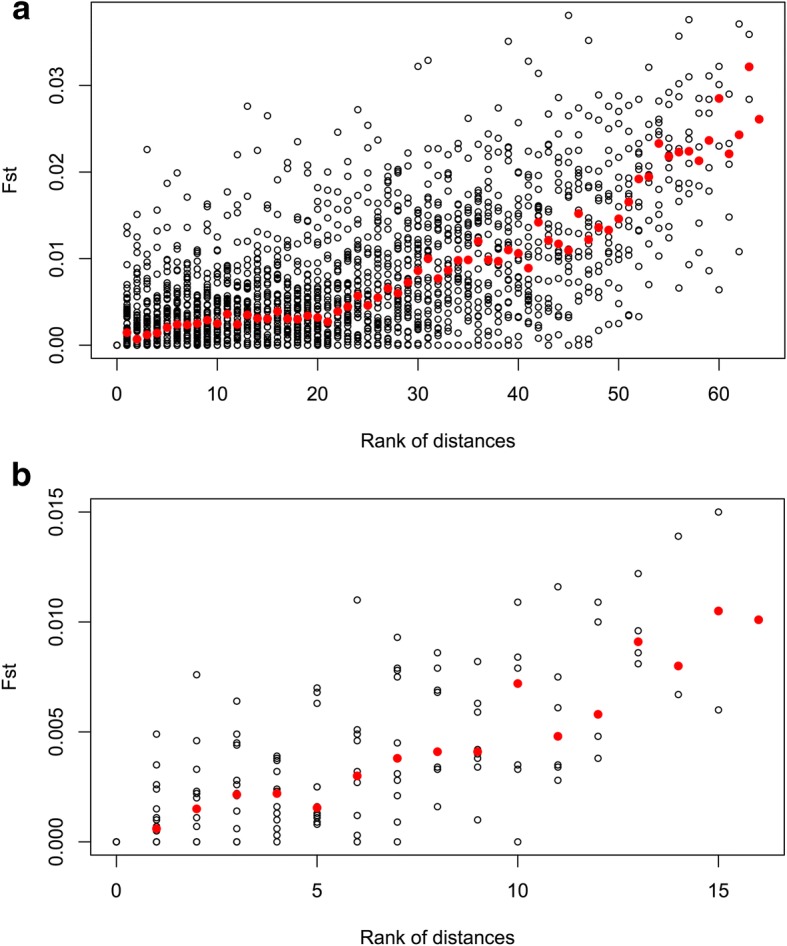
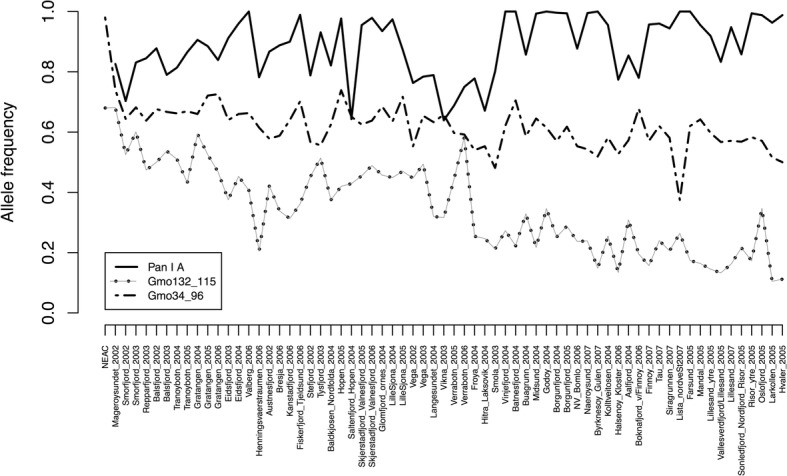
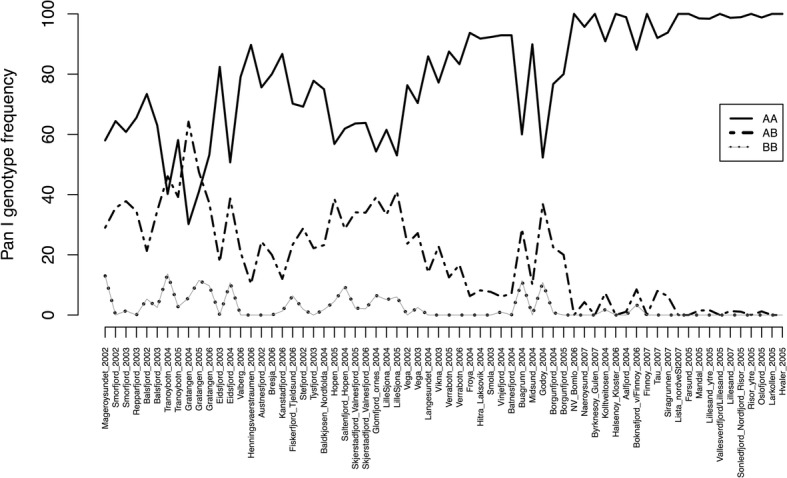
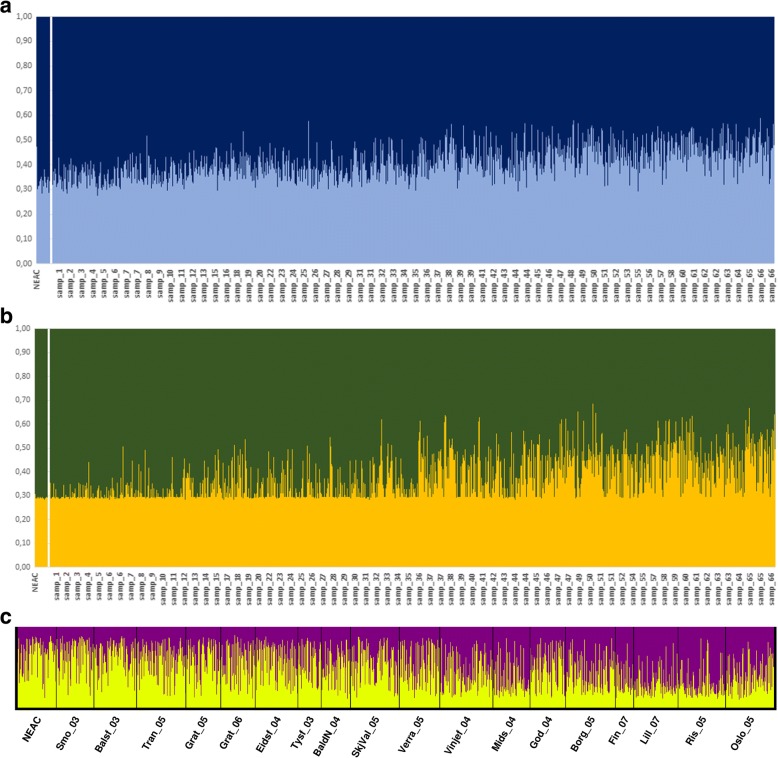
Results: We found no difference in genetic diversity, measured as number of alleles, allelic richness, heterozygosity nor effective population sizes, in the north-south gradient. In both data sets, weak but significant population genetic structure was revealed (Dataset 1: global FST = 0.008, P < 0.0001. Dataset 2: global FST = 0.004, P < 0.0001). While no clear genetic groups were identified, genetic differentiation increased among geographically-distinct samples. Although the locus Gmo132 was identified as a candidate for positive selection, possibly through linkage with a genomic region under selection, overall trends remained when this locus was excluded from the analyses. The most common allele in loci Gmo132 and Gmo34 showed a marked frequency change in the north-south gradient, increasing towards the frequency observed in NEAC in the north.
Conclusion: We conclude that Norwegian coastal cod displays significant population genetic structure throughout its entire range, that follows a trend of isolation by distance. Furthermore, we suggest that a gradient of genetic introgression between NEAC and NCC contributes to the observed population genetic structure. The current management regime for coastal cod in Norway, dividing it into two stocks at 62°N, represents a simplification of the level of genetic connectivity among coastal cod in Norway, and needs revision.
Keywords: Fish; Fishery; NCC; Otolith; Outlier; Population.
Conflict of interest statement
Ethics approval and consent to participate
Sampling (fin clippings) where conducted from dead fish caught in the legal commercial cod fisheries along the Norwegian coast.
Consent for publication
There is no material in the manuscript (personal details, images or videos) that would require any consent to publish.
Competing interests
The authors declare that they have no competing interests.
Publisher’s Note
Springer Nature remains neutral with regard to jurisdictional claims in published maps and institutional affiliations.
Figures
References
-
- Olsen EM, Knutsen H, Gjøsæter J, Jorde PE, Knutsen JA, Stenseth NC. Life-history variation among local populations of Atlantic cod from the Norwegian Skagerrak coast. J Fish Biol. 2004;64(6):1725–1730. doi: 10.1111/j.0022-1112.2004.00402.x. - DOI
-
- Imsland AK, Jónsdóttir ÓDB. Linking population genetics and growth properties of Atlantic cod. Rev Fish Biol Fish. 2003;13(1):1–26. doi: 10.1023/A:1026373509576. - DOI
Publication types
MeSH terms
LinkOut - more resources
Full Text Sources
Other Literature Sources
Molecular Biology Databases
Miscellaneous
