. 2018 Jul 9;15(1):202.
doi: 10.1186/s12974-018-1232-3.

Unveiling anti-oxidative and anti-inflammatory effects of docosahexaenoic acid and its lipid peroxidation product on lipopolysaccharide-stimulated BV-2 microglial cells

Affiliations

Unveiling anti-oxidative and anti-inflammatory effects of docosahexaenoic acid and its lipid peroxidation product on lipopolysaccharide-stimulated BV-2 microglial cells

Bo Yang et al. J Neuroinflammation. .

Abstract

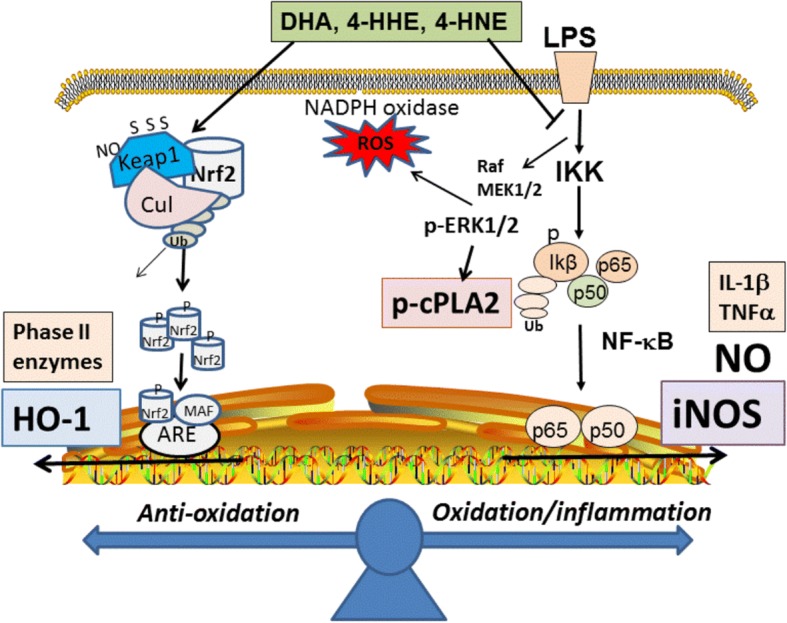
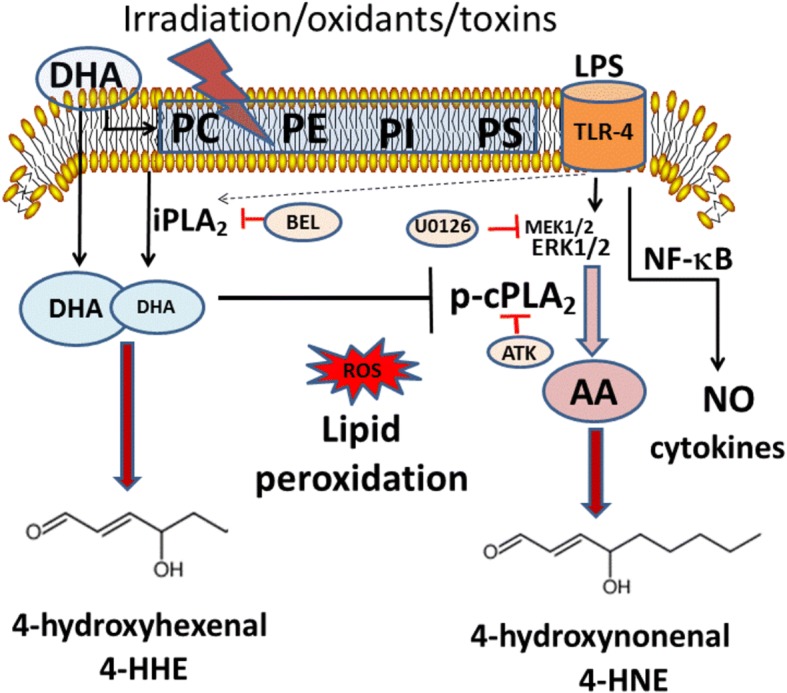
Background: Phospholipids in the central nervous system are enriched in n-3 and n-6 polyunsaturated fatty acids (PUFA), especially docosahexaenoic acid (DHA) and arachidonic acid (ARA). These PUFA can undergo enzymatic reactions to produce lipid mediators, as well as reaction with oxygen free radicals to produce 4-hydroxyhexenal (4-HHE) from DHA and 4-hydroxynonenal (4-HNE) from ARA. Recent studies demonstrated pleiotropic properties of these peroxidation products through interaction with oxidative and anti-oxidant response pathways. In this study, BV-2 microglial cells were used to investigate ability for DHA, 4-HHE, and 4-HNE to stimulate the anti-oxidant stress responses involving the nuclear factor erythroid-2-related factor 2 (Nrf2) pathway and synthesis of heme oxygenase (HO-1), as well as to mitigate lipopolysaccharide (LPS)-induced nitric oxide (NO), reactive oxygen species (ROS), and cytosolic phospholipase A2 (cPLA2). In addition, LC-MS/MS analysis was carried out to examine effects of exogenous DHA and LPS stimulation on endogenous 4-HHE and 4-HNE levels in BV-2 microglial cells.

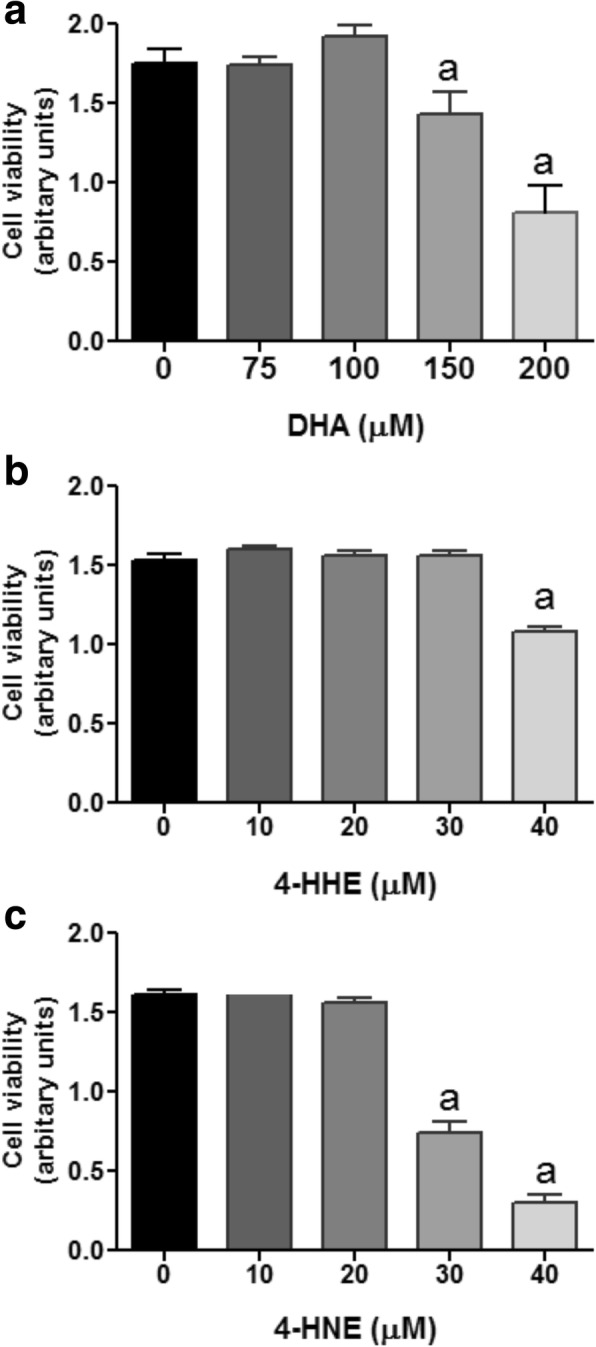
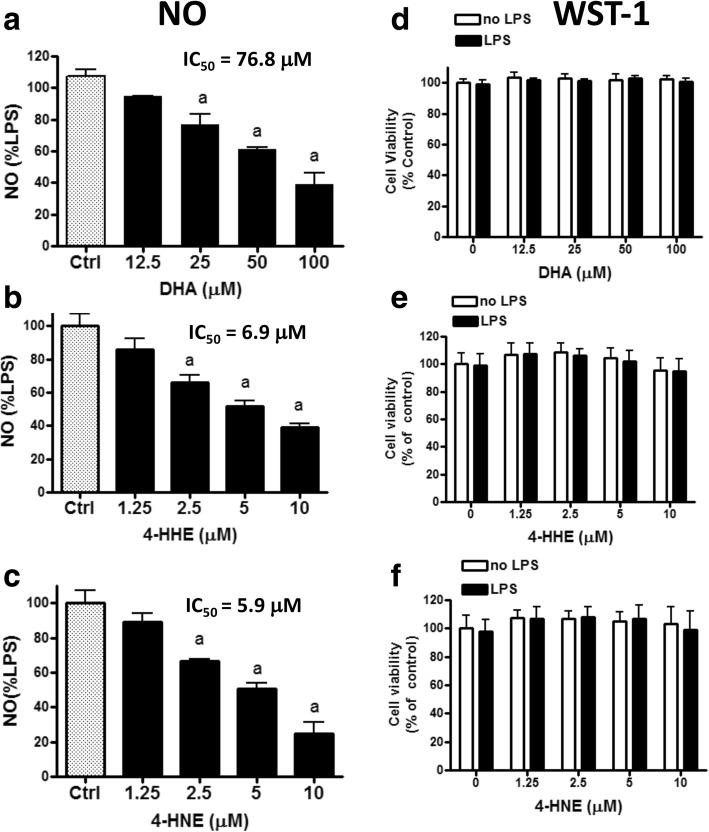
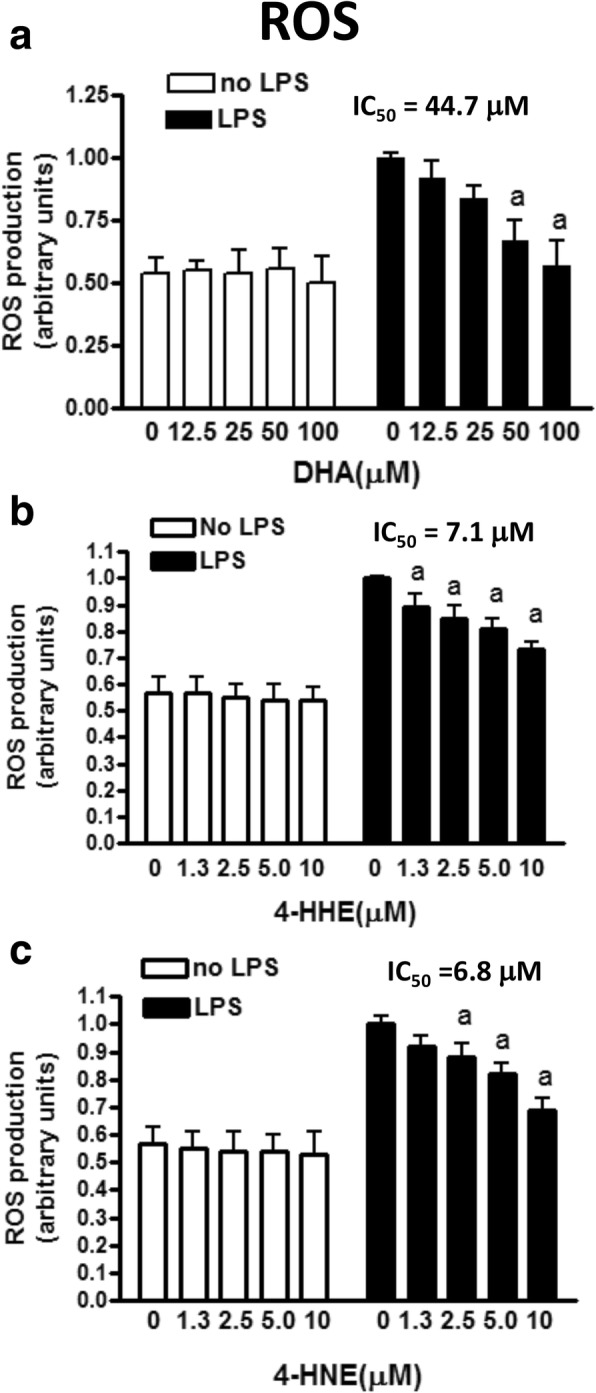
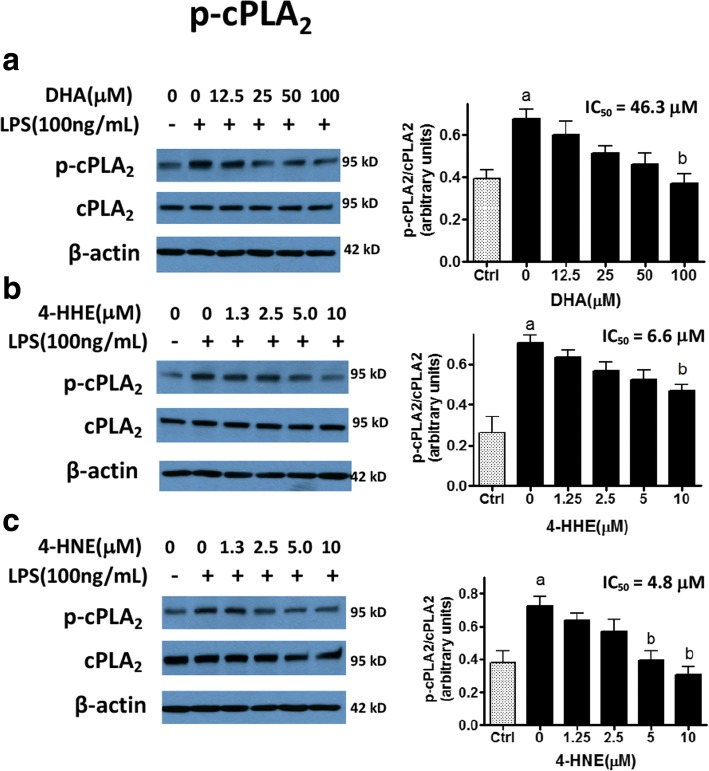
Methods: Effects of DHA, 4-HHE, and 4-HNE on LPS-induced NO production was determined using the Griess reagent. LPS-induced ROS production was measured using CM-H2DCFDA. Western blots were used to analyze expression of p-cPLA2, Nrf2, and HO-1. Cell viability and cytotoxicity were measured using the WST-1 assay, and cell protein concentrations were measured using the BCA protein assay kit. An ultra-high-performance liquid chromatography-tandem mass spectrometry (LC-MS/MS) analysis was used to determine levels of free 4-HHE and 4-HNE in cells.

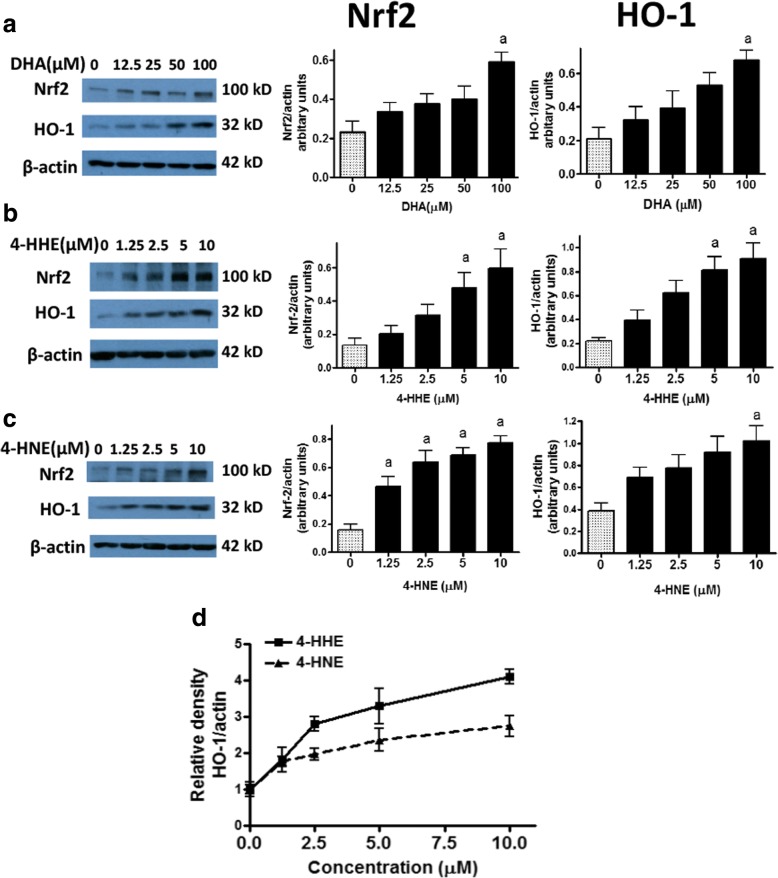
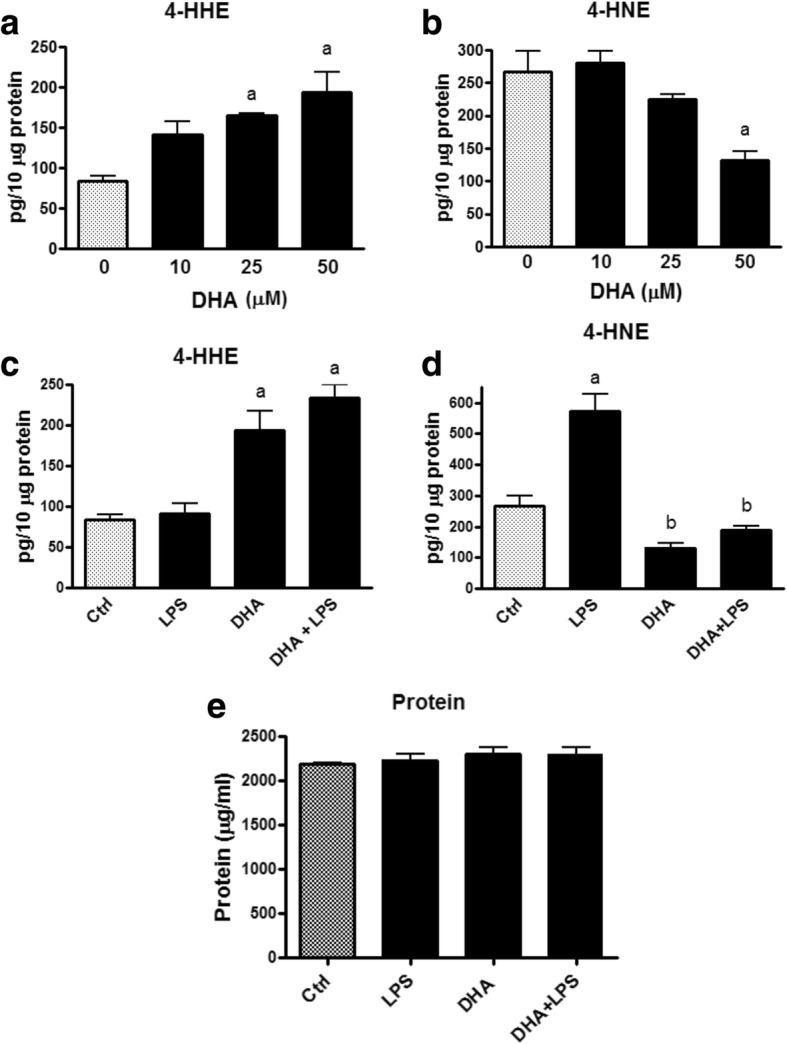
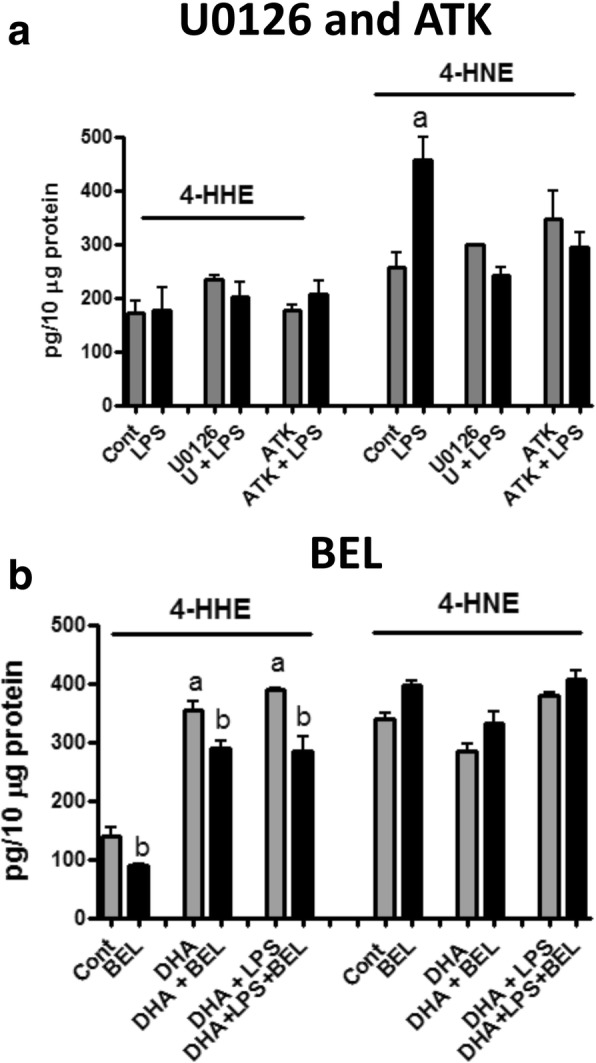
Results: DHA (12.5-100 μM), 4-HHE (1.25-10 μM), and 4-HNE (1.25-10 μM) dose dependently suppressed LPS-induced production of NO, ROS, and as p-cPLA2 in BV-2 microglial cells. With the same concentrations, these compounds could enhance Nrf2 and HO-1 expression in these cells. Based on the estimated IC50 values, 4-HHE and 4-HNE were five- to tenfold more potent than DHA in inhibiting LPS-induced NO, ROS, and p-cPLA2. LC-MS/MS analysis indicated ability for DHA (10-50 μM) to increase levels of 4-HHE and attenuate levels of 4-HNE in BV-2 microglial cells. Stimulation of cells with LPS caused an increase in 4-HNE which could be abrogated by cPLA2 inhibitor. In contrast, bromoenol lactone (BEL), a specific inhibitor for the Ca2+-independent phospholipase A2 (iPLA2), could only partially suppress levels of 4-HHE induced by DHA or DHA + LPS.

Conclusions: This study demonstrated the ability of DHA and its lipid peroxidation products, namely, 4-HHE and 4-HNE at 1.25-10 μM, to enhance Nrf2/HO-1 and mitigate LPS-induced NO, ROS, and p-cPLA2 in BV-2 microglial cells. In addition, LC-MS/MS analysis of the levels of 4-HHE and 4-HNE in microglial cells demonstrates that increases in production of 4-HHE from DHA and 4-HNE from LPS are mediated by different mechanisms.

Keywords: 4-Hydroxyhexenal (4-HHE); 4-Hydroxynonenal (4-HNE); Docosahexaenoic acid (DHA); HO-1; Lipopolysaccharide (LPS); Microglia; NO; Nrf2; ROS; cPLA2; iPLA2.


Conflict of interest statement

Ethics approval and consent to participate

Not applicable.

Consent for publication

Not applicable.

Competing interests

The authors declare that they have no competing interests.

Publisher’s Note

Springer Nature remains neutral with regard to jurisdictional claims in published maps and institutional affiliations.

Figures

Fig. 1
Fig. 1
ac Effects of DHA, 4-HHE, and 4-HNE on viability of BV-2 microglial cells. BV-2 microglial cells were cultured in 96-well plates until reaching 90% confluence. Cells were serum-starved for 3 h, and DHA, 4-HHE, and 4-HNE at different concentrations were added for 1 h. After incubation for 16 h, cells were taken for viability assay by incubating with the WST-1 reagent at 37 °C for 30 min. Color density was read at 450 nm with the plate reader. Results were obtained from triplicate assay from a single passage and expressed as mean ± SE (n = 3). Repeated experiment with different passages showed similar results. Analysis by one-way ANOVA followed by Bonferroni post-tests; “a” represents significant differences (p < 0.05) comparing test compounds with control
Fig. 2
Fig. 2
Effects of DHA, 4-HHE, and 4-HNE on LPS-induced NO production in BV-2 microglial cells. BV-2 microglial cells (106) were subculture in 96-well plates to 80% confluent. At the time of experiment, cells were serum-starved for 3 h and pre-treated with DHA (12.5–100 μM), 4-HHE (1.25–10 μM), and 4-HNE (1.25–10 μM) for 1 h, and followed by stimulation with LPS (100 ng/mL) for 16 h. Data in ac represent inhibition of LPS-induced NO production by DHA, 4-HHE, and 4-HNE using the Griess reagent. Results were obtained from triplicate assay from each cell passage. Concentrations of NO in μM ± SE (n = 5) were as follows: DHA 9.75 ± 1.8, 4-HHE 9.30 ± 0.10, and 4-HNE 10.43 ± 0. 52. Data in df represent cell viability after 16-h incubation using the WST-1 assay. Results are expressed as the mean ± SEM (n = 3–5) and analyzed by one-way ANOVA followed by Bonferroni post-tests; “a” represents significant differences (p < 0.05) comparing test compounds with control (Ctrl) with LPS treatment alone. IC50 values for each test compound were determined using the formula for regression analysis in Microsoft Excel 2016
Fig. 3
Fig. 3
Effects of DHA, 4-HHE, and 4-HNE on LPS-induced ROS production in microglial cells. Cells were cultured in 96-well plates as described in Fig. 2 and harvested at 12 h after LPS treatment. For ROS determination, CM-H2DCFDA was added 1 h prior to the end of incubation. Data in ac represent levels of ROS after pre-treatment of DHA (12.5–100 μM), 4-HHE (1.25–10 μM), and 4-HNE (1.25–10 μM) in the presence and absence of LPS. Results are expressed as the mean ± SEM (n = 4). Analyzed by one-way ANOVA followed by Bonferroni post-tests; “a” represents significant differences (p < 0.05) comparing test compounds with control (Ctrl) with LPS treatment alone. IC50 values for each test compound were determined using the formula for regression analysis in Microsoft Excel 2016
Fig. 4
Fig. 4
ac Effects of DHA, 4-HHE, and 4-HNE on LPS-induced p-cPLA2 expression in microglial cells. Microglial cells were cultured in 12-well plates and pre-treated with DHA (12.5–100 μM), 4-HHE (1.25–10 μM), and 4-HNE (1.25–10 μM) for 1 h prior to stimulation with LPS (100 ng/mL) for 4 h. Protein extracts were used for Western blot analysis of p-cPLA2, total cPLA2, and β-actin as described in text. A representative blot was shown in each set of experiment. Bar graphs represent p-cPLA2/cPLA2 ratios from four experiments with different passages. Results are expressed as the mean ± SEM (n = 4) and analysis by one-way ANOVA followed by Bonferroni post-tests, “a” represents significant differences (p < 0.05) between control versus LPS, and “b” represents significant differences (p < 0.05) comparing test compounds with LPS. IC50 values for each test compound were determined using the formula for regression analysis in Microsoft Excel 2016
Fig. 5
Fig. 5
Effects of DHA, 4-HHE, and 4-HNE on the induction of Nrf2 and HO-1 protein expression in BV-2 microglial cells. Cells were cultured in 12-well plate dish and pre-treated with a DHA (12.5–100 μM), b 4-HHE (1.25–10 μM), and c 4-HNE (1.25–10 μM) for 1 h followed by stimulation with LPS (100 ng/mL) for 6 h. Representative Western blots are shown for effects of DHA, 4-HHE, and 4-HNE on Nrf2 and HO-1 expression with β-actin as loading control. Results are from four experiments with different passages. Bar graphs represent relative densities of Nrf2/β-actin or HO-1/β-actin ratios. Analysis by one-way ANOVA followed by Bonferroni post-tests; “a” represents significant differences (p < 0.05) comparing between control versus test compounds. d Data depict the fold increase in HO-1 protein expression comparing 4-HHE to 4-HNE
Fig. 6
Fig. 6
Effects of DHA and/or LPS treatment on 4-HHE and 4-HNE levels in microglia cells. a, b Cells were cultured in 60-mm dish and serum-starved for 3 h before addition of DHA (10, 25, and 50 μM) for 1 h and LPS (100 ng/mL) for 6 h. After treatment, culture medium was removed and cells were suspended with 0.5 mL of PBS:H2O (1:1, v/v). Cell suspension was vortexed and aliquots taken for LC-MS/MS measurement as well as protein assay as described in the “Methods” section. Results depict levels of 4-HHE (a) and 4-HNE (b) upon treatment with DHA and expressed as picogram per 10 μg of protein. Each value represents the mean ± SEM of three biological replicates with duplicate analysis. Analyzed by one-way ANOVA followed by Bonferroni post-tests; “a” represents significant differences (p < 0.05) comparing DHA groups with control group. Levels of 4-HHE (c) and 4-HNE (d) upon treatment of cells with LPS (100 ng/mL) and/or DHA (50 μM). One-way ANOVA followed by Bonferroni post-tests; “a” significant differences (p < 0.05) comparing test group with control group, and “b” represents significant differences (p < 0.05) comparing LPS group with DHA and DHA + LPS groups. e Protein concentration from four passages of microglia cells indicated no significant changes due to the different treatment conditions
Fig. 7
Fig. 7
Effects of cPLA2 and iPLA2 inhibitors on levels of 4-HHE and 4-HNE in microglia cells treated with DHA and/or LPS. a Effects of cPLA2 inhibitors. Cells were pre-treated with U0126 (5 μM) or ATK (5 μM) for 1 h and followed by LPS (100 ng/mL) for 6 h. 4-HHE and 4-HNE levels were measured using the LC-MS/MS analysis as described in the “Methods” section. Each value represents the mean ± SEM of three biological replicates with duplicate analysis and is normalized to per 10 μg of protein. b Effects of iPLA2 inhibitor. Cells were pre-treated with BEL (5 μM) and /or DHA (50 μM) for 1 h prior to LPS (100 ng/mL) for 6 h. Results are representation of data from one cell passage; experiments repeated with different passages showed similar profiles. Analysis using one-way ANOVA followed with Bonferroni post-tests. In a, “a” represents significant increase (p < 0.001) in 4-HNE due to LPS stimulation as compared with control. In b, “a” represents significant increase (p < 0.01) in 4-HHE due to DHA and DHA + LPS compared with control and “b” represents significant decrease (p < 0.001) in 4-HHE due to BEL
Fig. 8
Fig. 8
A scheme depicting effects of electrophiles on upregulation of the Nrf2/HO-1 pathway and downregulation of NO/ROS/cPLA2 pathways in microglial cells
Fig. 9
Fig. 9
A scheme depicting metabolic pathways for production of 4-HHE and 4-HNE through different enzymatic (cPLA2 and iPLA2) and non-enzymatic (lipid peroxidation) mechanisms

References

    1. Sun GY, Simonyi A, Fritsche KL, Chuang DY, Hannink M, Gu Z, Greenlief CM, Yao JK, Lee JC, Beversdorf DQ. Docosahexaenoic acid (DHA): an essential nutrient and a nutraceutical for brain health and diseases. Prostaglandins Leukot Essent Fatty Acids. 2017. - PMC - PubMed
    1. Salem N, Jr, Vandal M, Calon F. The benefit of docosahexaenoic acid for the adult brain in aging and dementia. Prostaglandins Leukot Essent Fatty Acids. 2015;92:15–22. doi: 10.1016/j.plefa.2014.10.003. - DOI - PubMed
    1. Denis I, Potier B, Vancassel S, Heberden C, Lavialle M. Omega-3 fatty acids and brain resistance to ageing and stress: body of evidence and possible mechanisms. Ageing Res Rev. 2013;12:579–594. doi: 10.1016/j.arr.2013.01.007. - DOI - PubMed
    1. Paterniti I, Impellizzeri D, Di Paola R, Esposito E, Gladman S, Yip P, Priestley JV, Michael-Titus AT, Cuzzocrea S. Docosahexaenoic acid attenuates the early inflammatory response following spinal cord injury in mice: in-vivo and in-vitro studies. J Neuroinflammation. 2014;11:6. doi: 10.1186/1742-2094-11-6. - DOI - PMC - PubMed
    1. Michael-Titus AT, Priestley JV. Omega-3 fatty acids and traumatic neurological injury: from neuroprotection to neuroplasticity? Trends Neurosci. 2014;37:30–38. doi: 10.1016/j.tins.2013.10.005. - DOI - PubMed

MeSH terms

LinkOut - more resources