. 2018 Jul 9;20(1):69.
doi: 10.1186/s13058-018-1002-2.

Intra-operative spectroscopic assessment of surgical margins during breast conserving surgery

Affiliations

Intra-operative spectroscopic assessment of surgical margins during breast conserving surgery

Dustin W Shipp et al. Breast Cancer Res. .

Abstract

Background: In over 20% of breast conserving operations, postoperative pathological assessment of the excised tissue reveals positive margins, requiring additional surgery. Current techniques for intra-operative assessment of tumor margins are insufficient in accuracy or resolution to reliably detect small tumors. There is a distinct need for a fast technique to accurately identify tumors smaller than 1 mm2 in large tissue surfaces within 30 min.

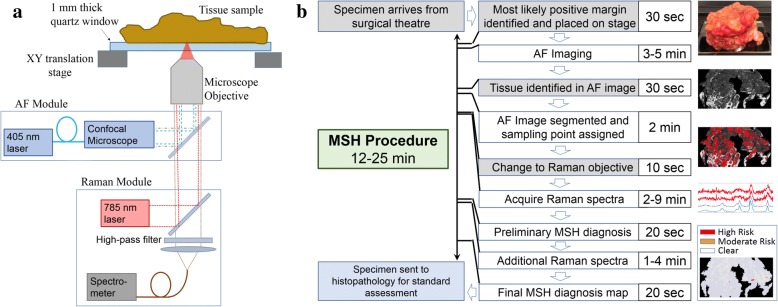
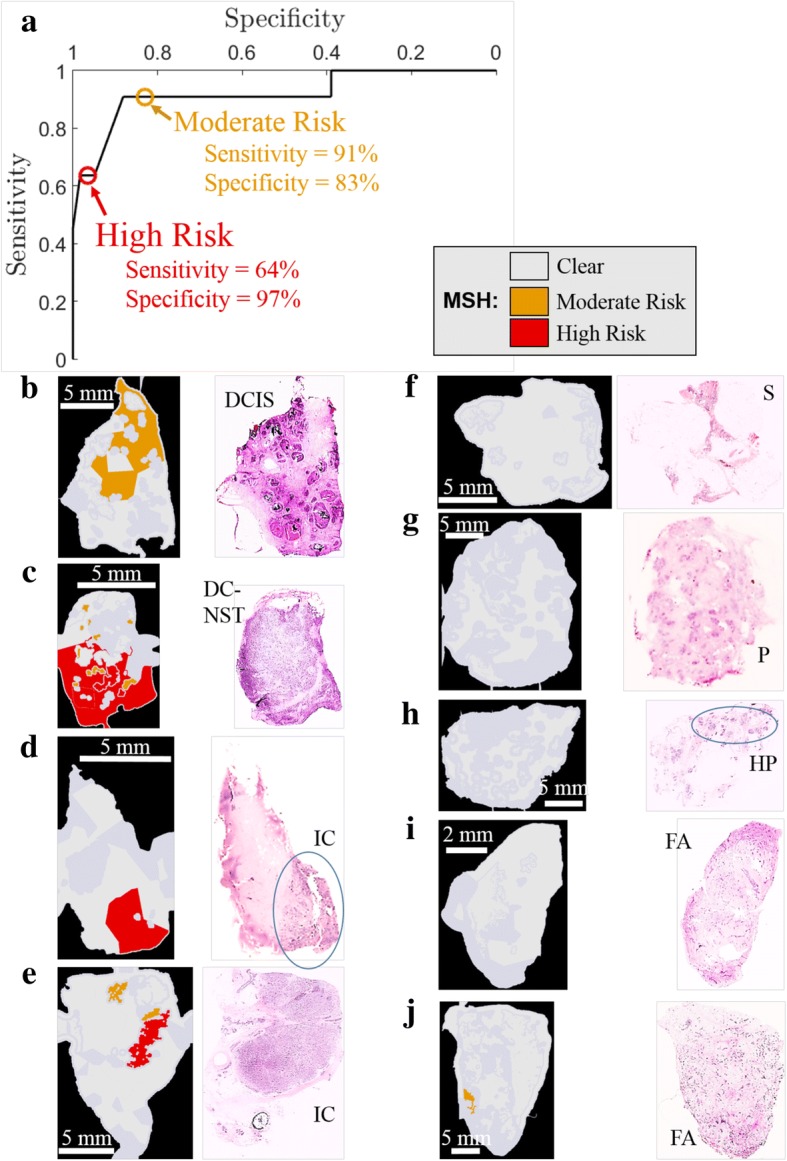
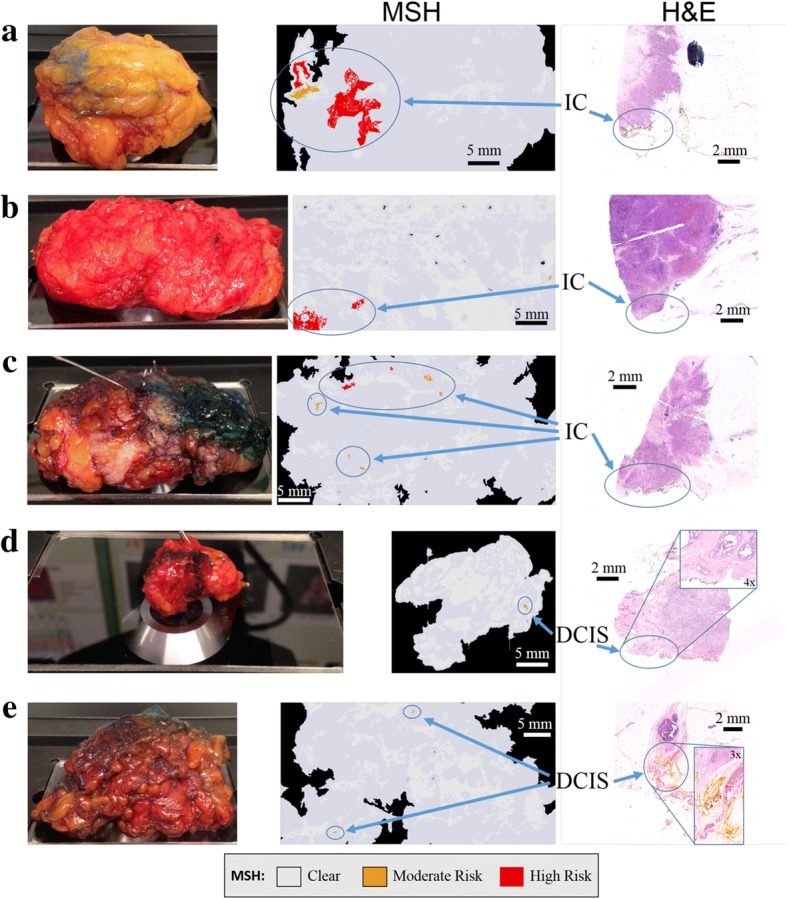
Methods: Multi-modal spectral histopathology (MSH), a multimodal imaging technique combining tissue auto-fluorescence and Raman spectroscopy was used to detect microscopic residual tumor at the surface of the excised breast tissue. New algorithms were developed to optimally utilize auto-fluorescence images to guide Raman measurements and achieve the required detection accuracy over large tissue surfaces (up to 4 × 6.5 cm2). Algorithms were trained on 91 breast tissue samples from 65 patients.

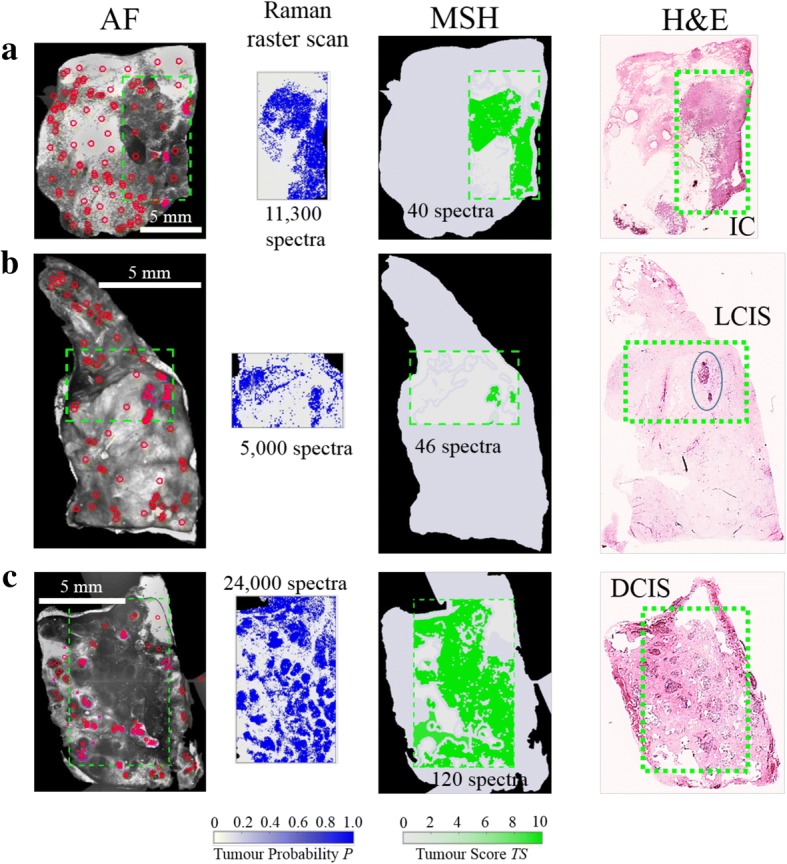
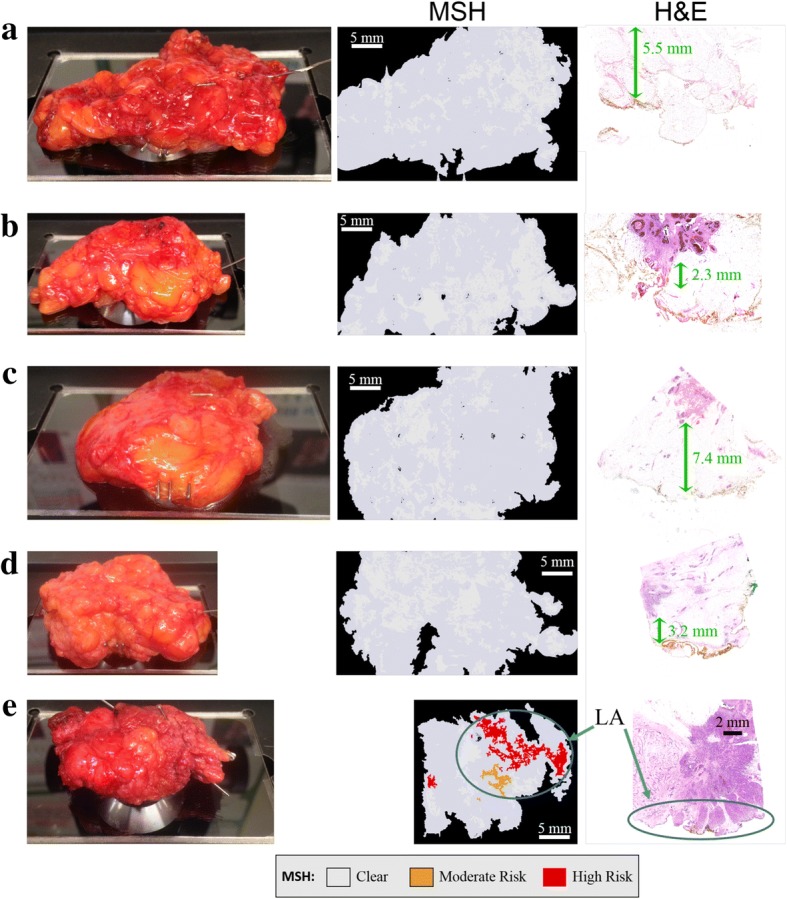
Results: Independent tests on 121 samples from 107 patients - including 51 fresh, whole excision specimens - detected breast carcinoma on the tissue surface with 95% sensitivity and 82% specificity. One surface of each uncut excision specimen was measured in 12-24 min. The combination of high spatial-resolution auto-fluorescence with specific diagnosis by Raman spectroscopy allows reliable detection even for invasive carcinoma or ductal carcinoma in situ smaller than 1 mm2.

Conclusions: This study provides evidence that this multimodal approach could provide an objective tool for intra-operative assessment of breast conserving surgery margins, reducing the risk for unnecessary second operations.

Keywords: Auto-fluorescence; Breast cancer; Intra-operative margin evaluation; Raman spectroscopy.


Conflict of interest statement

Ethics approval and consent to participate

Ethical approval was granted through the Nottingham Health Science Biobank (NHSB, REC reference 15/NW/0685) and informed consent was obtained from all patients.

Competing interests

The authors have no competing interests to declare. IN has filed a patent application related to MSH.

Publisher’s Note

Springer Nature remains neutral with regard to jurisdictional claims in published maps and institutional affiliations.

Figures

Fig. 1
Fig. 1
Instrument and procedure for multimodal spectral histopathology (MSH). a The MSH instrument consists of an inverted optical microscope with integrated Raman spectrometer (excitation 785 nm, detection Raman shift range 600–1800 cm− 1) and confocal auto-fluorescence (AF) module (excitation 405 nm, detection range 450–520 nm). b The MSH measurement procedure can be completed in 12–24 min, depending on tissue size (up to 4 × 6.5 cm2). Steps in white boxes are automated (do not require user input). After MSH analysis, the tissue is returned for normal histopathology analysis
Fig. 2
Fig. 2
Method for unsupervised segmentation of auto-fluorescence (AF) images of breast tissue. a AF intensity images of a typical breast tissue sample containing invasive carcinoma obtained at difference excitation laser powers. b Representation of the total area captured by all segments to total number of segments for each image (A·N) versus the segmentation threshold. c Segmented AF images using the optimized intensity thresholds t5, t11, t25, t45; white dots indicate the sampling points for Raman spectroscopy. Each segment is assigned a unique, arbitrary color in these images. d The computed overlap with segmentation of the 45-mW image; blue, regions captured in segments in both AF images; red, regions were in segments in the 45-mW image but not in the images at lower power; yellow, regions in segments of AF image at lower laser power but not the 45-mW image. e Hematoxylin and eosin (H&E) section. The dense clusters of dark blue dots are tumor cells
Fig. 3
Fig. 3
Raman spectral acquisition and annotation. Tumor regions (clusters of blue dots in the H&E image in (c)) appear darker in the auto-fluorescence (AF) image (a). The region in the green box was measured by a Raman raster scan. K-means cluster analysis of these spectra identifies similar spectra to create a hyperspectral image (b). Single spectra from locations marked in b are shown in d. Based on the information in a-d, pre-processed spectra from green areas (horizontal triangles) are marked as tumor, blue (square/circle) as inflamed stroma, and red (vertical triangles) as fat. Other clusters (cyan, yellow, and magenta) were background or noise and were withheld from the training set. Mean and standard deviation of all spectra in the training set show that the annotated tissue types (e) could be simplified to three classes used by the spectral classifier (f). Spectral features used for classification are marked as shaded areas (peak areas) and magenta lines (peak intensity differences). These peak areas are shaded blue for lipid-associated bands, green for protein-associated bands, and magenta for nucleic acid-associated bands. These features are consistent across all tumor types (g). Classes: IC, invasive carcinoma; OT, other tumor types (includes ductal carcinoma in situ (DCIS), lobular carcinoma in situ (LCIS), malignant phyllodes (MP)); BG, benign growths (includes fibroadenoma, sclerosing adenosis, hyperplasia); IN, inflammation; P, parenchyma; S, healthy stroma; F, fat; F + S, mixture of fat and stroma
Fig. 4
Fig. 4
Multi-modal spectral histopathology (MSH) diagnosis generated using auto-fluorescence (AF) and raster scan Raman measurements of breast samples. Diagnosis for Raman raster scan is presented as tumor probability (P) (output of the classification model), while the diagnosis of each segment in the MSH is presented as tumor score (TS). Segmentation and sampling algorithms use AF images to focus Raman measurements (red circles) to suspicious regions, greatly reducing the number of spectra required for accurate diagnosis. Areas detected as tumor in the first round of MSH measurements are sampled by further Raman measurements (magenta crosses). a) Invasive carcinoma (IC); b) lobular carcinoma in situ (LCIS); c) ductal carcinoma in situ (DCIS)
Fig. 5
Fig. 5
Validation of multi-modal spectral histopathology (MSH) on independent mastectomy breast samples. a Receiver-operator curve (ROC) for independent test samples at varying tumor score thresholds. Results corresponding to the thresholds determined based on training set data are marked with circles. (b-e) Examples of tumor tissue detected by MSH and confirmed by histopathology. DCIS, ductal carcinoma in situ; DC-NST, ductal carcinoma of no special type; IC, invasive carcinoma. f-i Examples of tissue identified as clear by both MSH and histopathology. S, stroma; P, parenchyma; HP, hyperplasia; FA, fibroadenoma. j Example of false positive where MSH marked segments as moderate risk although histopathological assessment identified fibroadenoma
Fig. 6
Fig. 6
Examples of multi-modal spectral histopathology (MSH) measurements of whole breast conserving surgery (BCS) specimens with positive margins confirmed by histopathological assessment. The surface measured by MSH is facing downward in the specimen images. MSH detected tumor on the surface of all specimens in 12–24 min. a-c) invasive carcinoma (IC); d, e) ductal carcinoma in situ (DCIS)
Fig. 7
Fig. 7
Examples of multi-modal spectral histopathology (MSH) measurements of whole breast conserving surgery (BCS) specimens for which histopathological examination identified negative margins. a-d MSH detected no tumor on the surface of 80% of specimens declared clear by histopathological examination. Distances from the measured margin to tumor are marked with green arrows. e MSH detected tumor although only lactation adenoma (LA) was found within 100 μm of the measured surface in sections sampled by histopathological examination

Comment in

References

    1. Kummerow KL, Du L, Penson DF, Shyr Y, Hooks MA. Nationwide trends in mastectomy for early-stage breast cancer. JAMA Surg. 2015;150:9–16. doi: 10.1001/jamasurg.2014.2895. - DOI - PubMed
    1. Jeevan R, Cromwell DA, Trivella M, Lawrence G, Kearins O, Pereira J, et al. Reoperation rates after breast conserving surgery for breast cancer among women in England: retrospective study of hospital episode statistics. BMJ. 2012;345:e4505. doi: 10.1136/bmj.e4505. - DOI - PMC - PubMed
    1. Landercasper J, Whitacre E, Degnim AC, Al-Hamadani M. Reasons for re-excision after lumpectomy for breast cancer: insight from the American Society of Breast Surgeons Mastery Database. Ann Sur Oncol. 2014;21:3185–3191. doi: 10.1245/s10434-014-3905-1. - DOI - PubMed
    1. Moran MS, Schmitt SJ, Giuliano AE, Harris JR, Khan SA, Horton J, et al. Society of Surgical Oncology – American Society for Radiation Oncology consensus guideline on margins for breast conserving surgery with whole-breast irradiation in stages I and II invasive breast cancer. Ann Surg Oncol. 2014;21:704–716. doi: 10.1245/s10434-014-3481-4. - DOI - PubMed
    1. Morrow M, Van Zee KJ, Solin LJ, Houssami N, Chavez-MacGregor M, Harris JR, et al. Society of Surgical Oncology – American Society for Radiation Oncology – American Society of Clinical Oncology consensus guideline on margins for breast-conserving surgery with whole-breast irradiation in ductal carcinoma in situ. J Clin Oncol. 2016;34(33):4040–4046. doi: 10.1200/JCO.2016.68.3573. - DOI - PMC - PubMed

Publication types

MeSH terms