. 2018 Aug 31;293(35):13534-13552.
doi: 10.1074/jbc.RA117.000287. Epub 2018 Jul 9.

Nitric oxide promotes cancer cell dedifferentiation by disrupting an Oct4:caveolin-1 complex: A new regulatory mechanism for cancer stem cell formation

Affiliations

Nitric oxide promotes cancer cell dedifferentiation by disrupting an Oct4:caveolin-1 complex: A new regulatory mechanism for cancer stem cell formation

Arnatchai Maiuthed et al. J Biol Chem. .

Abstract

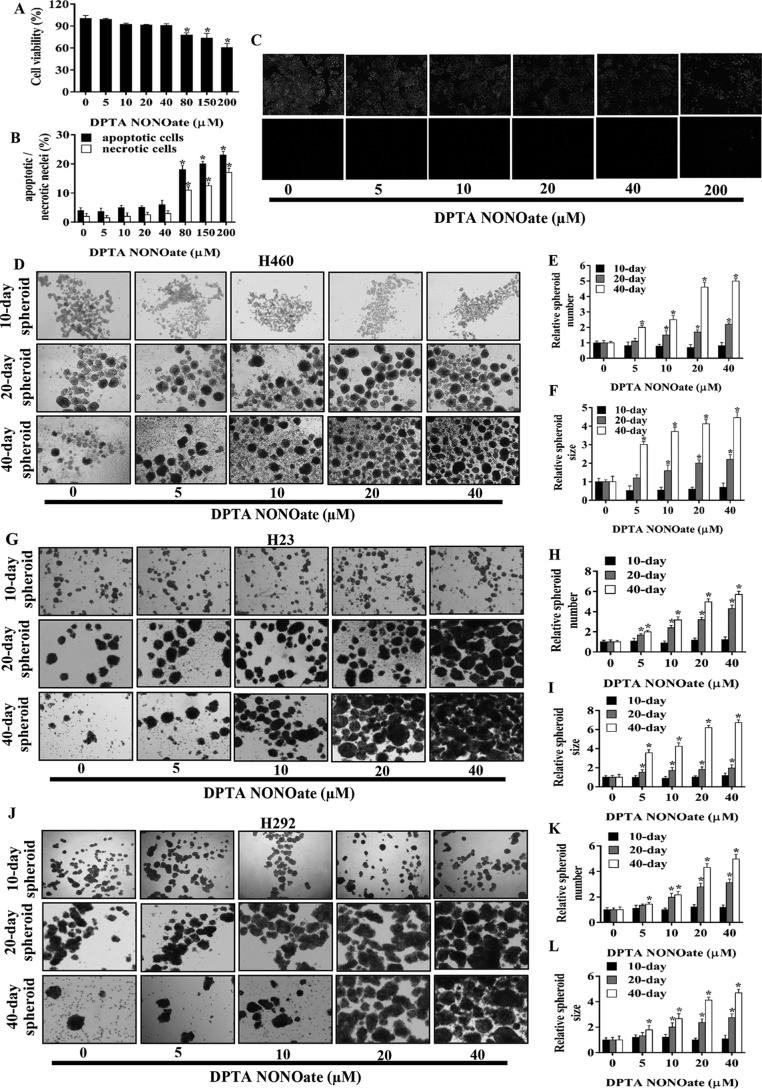
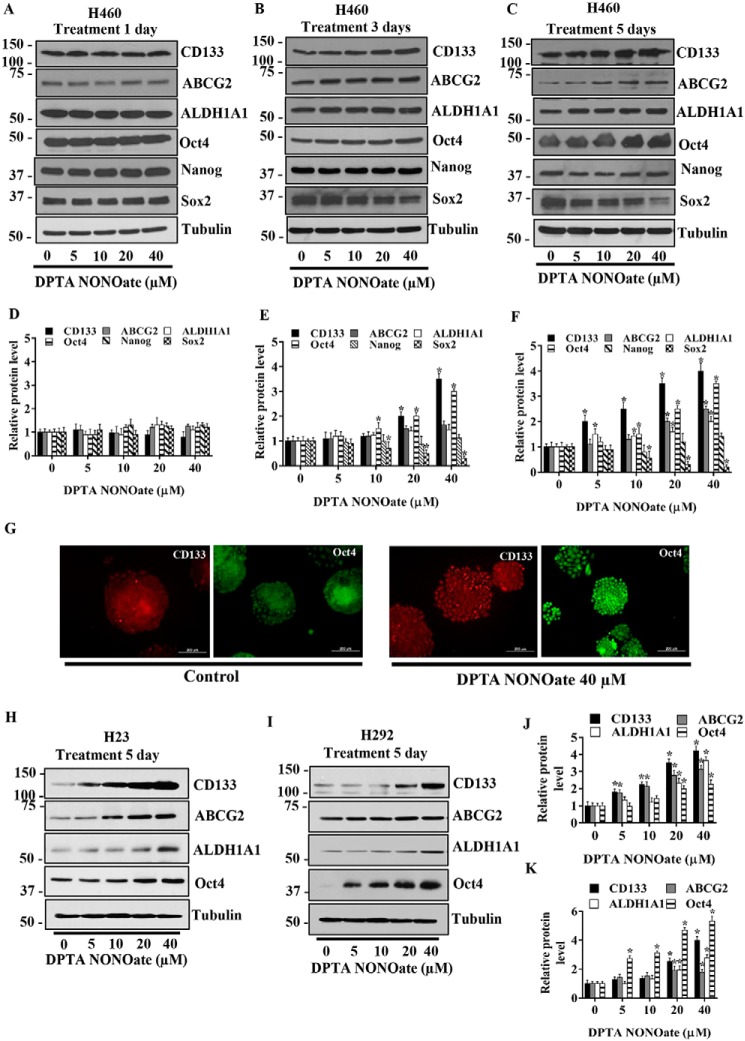
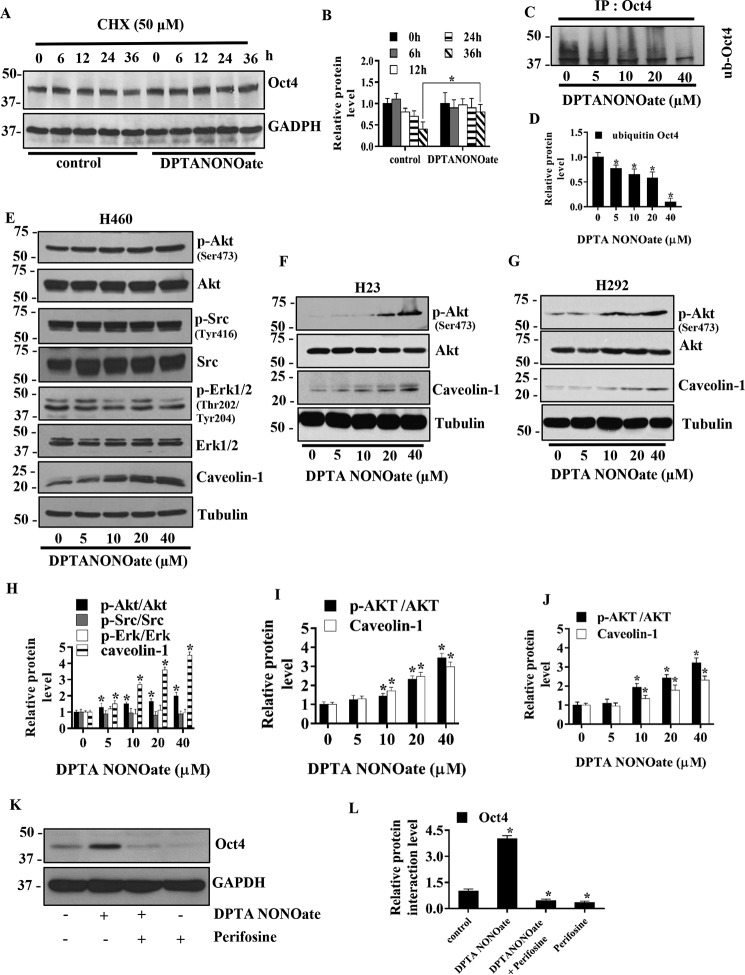
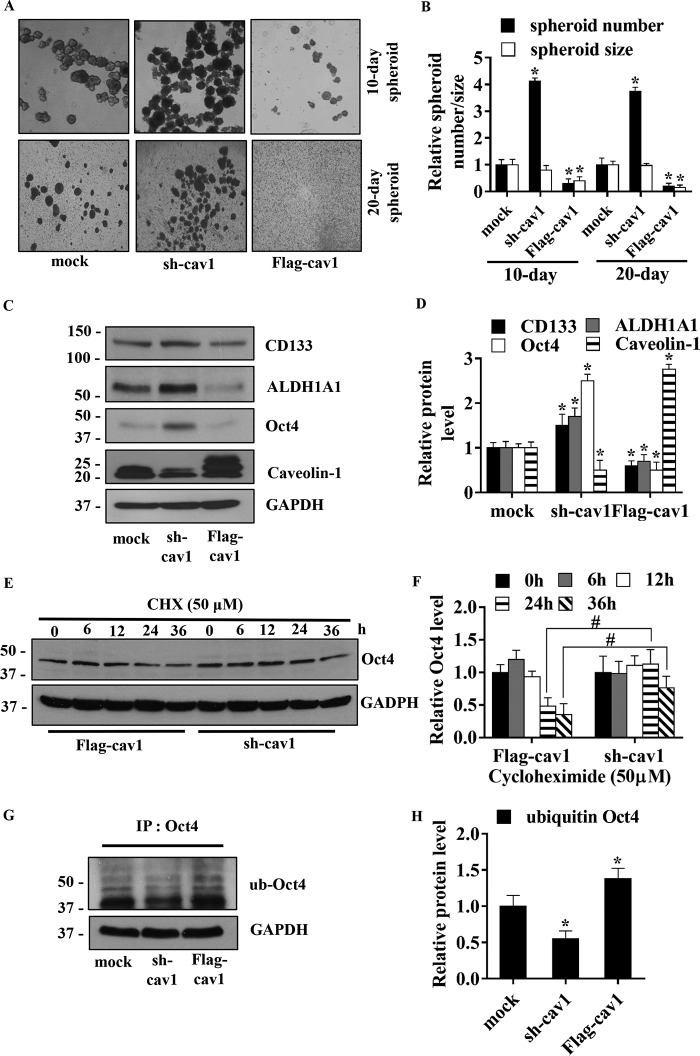
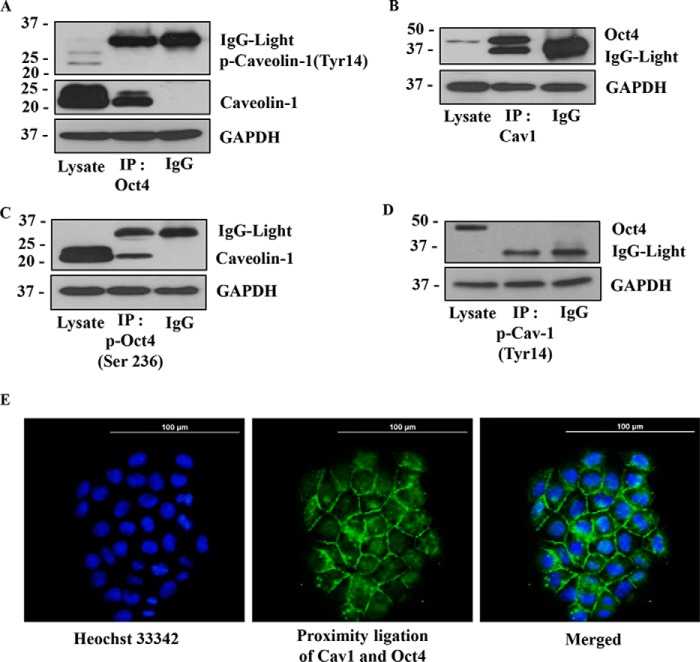
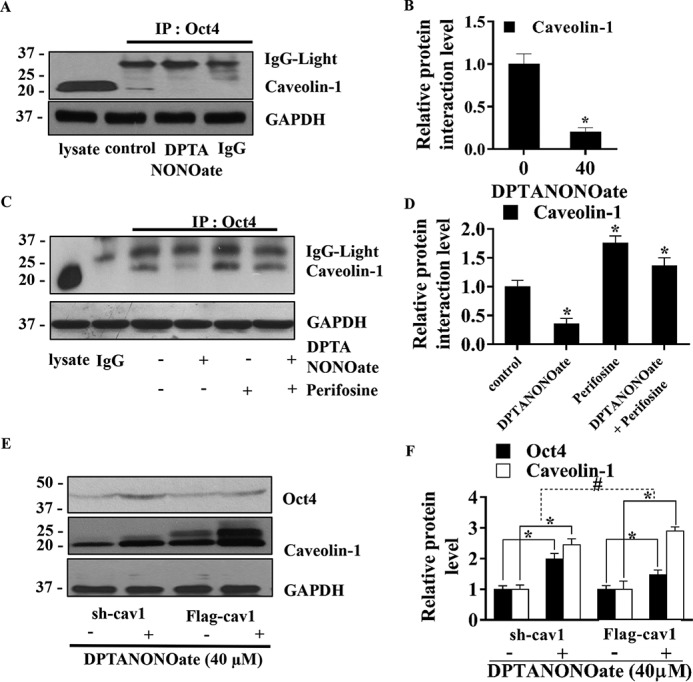
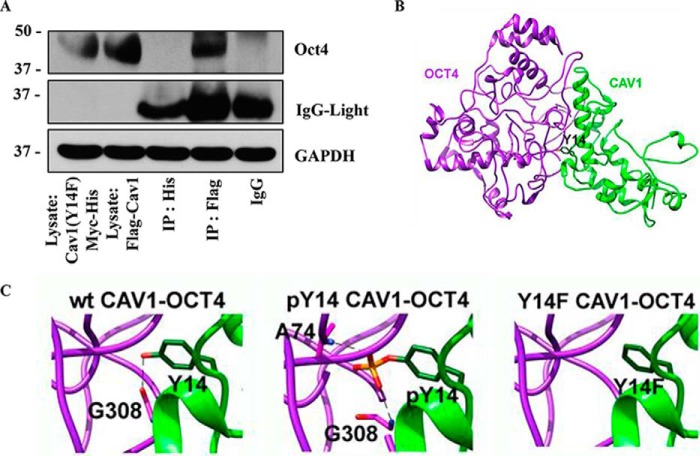
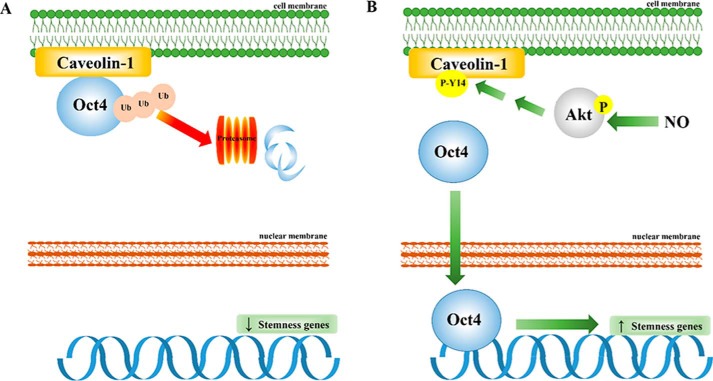
Cancer stem cells (CSCs) are unique populations of cells that can self-renew and generate different cancer cell lineages. Although CSCs are believed to be a promising target for novel therapies, the specific mechanisms by which these putative therapeutics could intervene are less clear. Nitric oxide (NO) is a biological mediator frequently up-regulated in tumors and has been linked to cancer aggressiveness. Here, we search for targets of NO that could explain its activity. We find that it directly affects the stability and function of octamer-binding transcription factor 4 (Oct4), known to drive the stemness of lung cancer cells. We demonstrated that NO promotes the CSC-regulatory activity of Oct4 through a mechanism that involves complex formation between Oct4 and the scaffolding protein caveolin-1 (Cav-1). In the absence of NO, Oct4 forms a molecular complex with Cav-1, which promotes the ubiquitin-mediated proteasomal degradation of Oct4. NO promotes Akt-dependent phosphorylation of Cav-1 at tyrosine 14, disrupting the Cav-1:Oct4 complex. Site-directed mutagenesis and computational modeling studies revealed that the hydroxyl moiety at tyrosine 14 of Cav-1 is crucial for its interaction with Oct4. Both removal of the hydroxyl via mutation to phenylalanine and phosphorylation lead to an increase in binding free energy (ΔGbind) between Oct4 and Cav-1, destabilizing the complex. Together, these results unveiled a novel mechanism of CSC regulation through NO-mediated stabilization of Oct4, a key stem cell transcription factor, and point to new opportunities to design CSC-related therapeutics.

Keywords: GSK3β; OCT4; cancer biology; cancer stem cells; caveolin; cell signaling; differentiation; lung cancer; nitric oxide, caveolin-1; proteasome; protein degradation; protein–protein interaction; regulation.


Conflict of interest statement

The authors declare that they have no conflicts of interest with the contents of this article

Figures

Figure 1.
Figure 1.
NO donor promotes human lung CSC-like phenotypes. A, H460 cells were treated with NO donor (DPTA NONOate) for 24 h and analyzed for cell viability by MTT assay. Apoptotic and necrotic cell death after the treatment was analyzed by Hoechst 33342/PI co-staining assays. B, percentages of apoptotic and necrotic nuclei in NO-treated cells were analyzed and calculated as relative to the control cells. C, ×10 immunofluorescence images of the treated and nontreated cells stained with Hoechst 33342/PI. After being treated with DPTA NONOate (0–40 μm) for 5 days, H460 (D), H23 (G), and H292 (J) cells were suspended and subjected to spheroid formation assay. Spheroid number H460 (E), H23 (H), H292 (K), and size H460 (F), H23 (I), H292 (L) were analyzed and calculated as relative to the control after 10, 20, and 40 days. Plots are means ± S.D. (n = 3). *, p < 0.05 versus nontreated cells.
Figure 2.
Figure 2.
NO donor increases CSC markers in NSCLC cell lines. H460 cells were treated with DPTA NONOate for 1 day (A), 3 days (B), and 5 days (C) after which they were analyzed for CSC markers (CD133, ALDH1A1, and ABCG2) and CSC transcription factors (Oct4, Nanog, and Sox2) by Western blotting. The blots were reprobed with tubulin to confirm equal loading of the protein samples. The immunoblot signals at 1 day (D), 3 days (E), and 5 days (F) after the treatment were quantified by densitometry, and mean data from independent experiments were normalized and presented. The bars are means ± S.D. (n = 3). *, p < 0.05 versus nontreated cells. G, expression of CD133 and Oct4 in H460 cells treated with DPTA NONOate (40 μm) for 5 days were analyzed by fluorescence microscopy (×10). Immunofluorescence was performed using mouse anti-CD133 mAb followed by Alexa-Fluor568–labeled secondary antibody to visualize CD133 expression and using mouse anti-Oct4 mAb followed by Alexa-Fluor488-labeled secondary antibody to visualize Oct4 expression in separated experiments. Cells were stained with Hoechst 33342 dye to aid visualization of the cell nucleus. The CD133 and Oct4 proteins were appeared as red and green fluorescence, respectively. H23 (H) and H292 (I) were treated with DPTA NONOate for 5 days and then were analyzed for CSC markers (CD133, ABCG2, and ALDH1A1) and Oct4. The blots were reprobed with tubulin to confirm equal loading of the protein samples. The immunoblot signals of H23 (J) and H292 (K) were quantified by densitometry, and mean data from independent experiments were normalized and presented. The bars are means ± S.D. (n = 3). *, p < 0.05 versus nontreated cells.
Figure 3.
Figure 3.
Microarray analysis of the effect of nitric oxide on H460 cells. H460 cells treated with DPTA NONOate and untreated control were subjected to analyzing the mRNA expression profile by Affymetrix chips as per the manufacture's procedure. A, gene probes with a significant difference (p < 0.05) between DPTA NONOate-treated and the control group analyzed by CU-DREAM program generated heat maps of genes by the Bioconductor R statistic program. B, results form Enrichr-EhEA-2016 demonstrated the gene list of nitric oxide-mediated gene expression matched with targeted genes of transcription factors evaluated by ChIP-seq assay. C, qRT-PCR was used to verify the microarray results. The mRNA expression of Oct4 downstream targets, including COLEC12, LAMP1, MYH3, PER3, ROS26, and UBE2S, were subjected to RT-PCT analysis. The bars are means ± S.D. (n = 3). *, p < 0.05 versus nontreated cells; **, p < 0.001–0,01; and ***, p < 0.001. D, NO-inducing gene alteration (only form Oct4 axis) and its primer sequences for RT-PCR.
Figure 4.
Figure 4.
NO donor increases Oct4 stability through Akt-dependent mechanisms. A, H460 cells were treated with 40 μm DPTA NONOate and 50 μg/ml CHX for the indicated times and analyzed for Oct4 levels by Western blotting. The blots were reprobed with GAPDH to confirm equal loading of the samples. B, immunoblot signals of Oct4 were quantified by densitometry, and mean data from independent experiments were normalized and presented. The bars are means ± S.D. (n = 3). *, p < 0.05 versus nontreated cells. C, H460 cells were treated with DPTA NONOate (0–40 μm) and lactacystin (10 μm) for 12 h and subjected to immunoprecipitation (IP) of Oct4. The immunoprecipitation complexes were analyzed for ubiquitin level by Western blotting. D, immunoblot signals of ubiquitin were quantified by densitometry, and mean data from independent experiments were normalized and presented. The bars are means ± S.D. (n = 3). *, p < 0.05 versus nontreated cells. E, H460 cells were treated with DPTA NONOate (0–40 μm) for 5 days and analyzed for phosphorylated Akt (Ser-473), Akt, phosphorylated Src (Tyr-416), Src, phosphorylated ERK1/2, Eek (1/2), and Cav-1 by Western blotting. The blots were reprobed with tubulin to confirm equal loading of the samples. H23(F) and H292 (G) were treated with DPTA NONOate (0–40 μm) for 5 days and analyzed for phosphorylated Akt (Ser-473), Akt, and Cav-1 by Western blotting. The blots were reprobed with tubulin to confirm equal loading of the samples. The immunoblot signals H460 (H), H23 (I), and H292 (J) were quantified by densitometry, and mean data from independent experiments were normalized and presented. The bars are means ± S.D. (n = 3). *, p < 0.05 versus nontreated cells. K, H460 cells were treated with 40 μm DPTA NONOate, 40 μm NONOate + 2.5 μm perifosine (specific Akt inhibitor), or 2.5 μm perifosine for 5 days and subjected to Western blot analysis for Oct4 detection. L, Western blotting bands of Oct4 were quantified by densitometry, and mean data from independent experiments were normalized and presented. The bars are means ± S.D. (n = 3). *, p < 0.05 versus control cells.
Figure 5.
Figure 5.
Caveolin-1 diminishes human lung CSC-like phenotypes. A, stable transfection of H460 with short hairpin plasmid (sh-cav1), Cav-1–overexpressing plasmid (FLAG-cav1), and control were suspended and subjected to spheroid formation assay. B, relative spheroid number and size were analyzed and calculated as relative to mock-transfected cells on days 10 and 20 of the assay. All plots are means ± S.D. (n = 3). *, p < 0.05 versus mock cells. C, stable transfections of H460 cells with sh-cav1, FLAG-cav1, or control were analyzed for Cav-1, CSC markers (CD133 and ALDH1A), and CSC transcription factor (Oct4) by Western blotting. Blots were reprobed with GAPDH as a loading control. D, immunoblot signals were quantified by densitometry, and mean data from independent experiments were normalized and presented. The bars are means ± S.D. (n = 3). *, p < 0.05 versus mock cells. E, stable transfections of H460 cells with sh-cav1 and FLAG-cav1 were treated with 50 μg/ml CHX at indicated times and analyzed for Oct4 level by Western blotting. The blots were reprobed with GAPDH to confirm equal loading of the samples. F, immunoblot signals were quantified by densitometry, and mean data from independent experiments were normalized and presented. The bars are means ± S.D. (n = 3). #, p < 0.05 versus FLAG-cav1-transfected cells. G, stable transfected H460 cells were treated with 10 μm lactacystin for 12 h and subjected to Oct4 immunoprecipitation (IP) of Oct4. The immune complexes were analyzed for ubiquitin by Western blotting. H, immunoblot signals were quantified by densitometry, and mean data from independent experiments were normalized and presented. The bars are means ± S.D. (n = 3). *, p < 0.05 versus mock cells.
Figure 6.
Figure 6.
Caveolin-1 exhibits direct protein–protein interaction with Oct4. A, H460 cell lysates were prepared and immunoprecipitated (IP) with anti-Oct4 antibody or control IgG and then analyzed Cav-1 and phosphorylated Cav-1 (Tyr-14) by Western blotting assay. B, H460 cell lysates were prepared and immunoprecipitated with anti-Cav-1 antibody or control IgG and then analyzed Oct4 with Western blotting assay. C, H460 cell lysates were prepared and immunoprecipitated with anti-phosphorylated Oct4 (Ser-236) antibody or control IgG and then analyzed the Cav-1 expression by Western blotting assay. D, H460 cell lysates were prepared and immunoprecipitated with anti-phosphorylated Cav-1(Tyr-14) antibody or control IgG, then evaluated Oct4 protein level by Western blotting. In all experiments, immunoblots were performed on cell lysates used as input for immunoprecipitation (IP) using GAPDH antibody to confirm equal loading of the samples. E, protein–protein interaction of Cav-1 and Oct4 was confirmed by PLA in H460 cells. After plating H460 cells for 24 h, the cells were permeabilized and stained with rabbit anti-Cav-1 and mouse anti-Oct4 for 24 h. The stained cells were subjected to PLA following the manufacturer's instruction. The interaction between Cav-1 and Oct4 was visualized by fluorescence microscopy (×20). Cells were stained with Hoechst 33342 dye to aid visualization of the cell nucleus. The Cav-1:Oct4 complexes appear as green fluorescence.
Figure 7.
Figure 7.
NO-mediated Akt diminishes the interaction between Cav-1 and Oct4. A, after treating with DPTA NONOate (40 μm) for 12 h, the H460 cell lysates were prepared and subjected to immunoprecipitation (IP) with anti-Oct4 antibody or control IgG and then analyzed the Cav-1 level by Western blotting. B, interaction signals were quantified by densitometry, and mean data from independent experiments were normalized and presented. The bars are means ± S.D. (n = 3). *, p < 0.05 versus control cells. C, H460 cells were treated with 40 μm DPTA NONOate, 2.5 μm perifosine (specific Akt inhibitor), or 40 μm NONOate + 2.5 μm perifosine for 12 h, subjected to immunoprecipitation with anti-Oct4 antibody or control IgG, and then evaluated the Cav-1 protein level by Western blotting. D, interaction signals were quantified by densitometry, and mean data from independent experiments were normalized and presented. The bars are means ± S.D. (n = 3). *, p < 0.05 versus control cells. In all experiments, the immunoblots were performed on cell lysates used as input for immunoprecipitation using GAPDH antibody to confirm equal loading of the samples. E, stable transfections of H460 cells with sh-cav1 or FLAG-cav1 were treated with 40 μm NONOate for 5 days, and cell lysates were performed, and measurement of Oct4 and Cav-1 levels was by Western blotting. F, immunoblot signals were quantified by densitometry, and mean data from independent experiments were normalized and presented. The bars are means ± S.D. (n = 3). *, p < 0.05 versus nontreated cells. #, p < 0.05 versus the sh-cav1 means difference of nontreated and treated cells.
Figure 8.
Figure 8.
Effect of Cav-1 (Y14F) mutation on the interaction between Cav-1 and Oct4. A, H460 cells were transfected with Cav1-(Y14F)–Myc–His or FLAG–Cav1. The transfected cells were subjected to co-immunoprecipitation by pulling down the tagged proteins (IP:His for Cav1(Y14F)Myc-His and IP:FLAG for FLAG-Cav1) and measuring the level of Oct4 by Western blotting. B, 3D model of WT Cav-1 (wtCav1) (green) bound with Oct4 (purple), where the Tyr-14 residue is presented as a green stick. C, close-up of the Cav-1 residue 14 on intermolecular hydrogen bond interaction with the Oct4 residues (Gly-308) (dashed line) for the WT, pTyr-14, and Y14F Cav-1:Oct4 complexes.
Figure 9.
Figure 9.
Schematic overview of NO-promoted CSC-like phenotypes through stabilization of Oct4 cellular level by dissociating it from the Cav-1:Oct4 degradation complex. A, in the absence of NO, Cav-1 binds to Oct4 and enhances its degradation through the ubiquitin–proteasome pathway. The reduction of cellular Oct4 level by Cav-1 leads to a decrease in stemness-related gene expression, which diminishes CSC-like phenotypes. B, in the presence of NO, NO promotes phosphorylation of Cav-1 (tyrosine 14) through the activation of Akt signaling. Because Cav-1 is phosphorylated, Oct4 is dissociated from the Cav-1 complex. The liberated Oct4 accumulates in the nucleus and enhances the expression of stemness-related genes, which promote CSC-like phenotypes.

References

    1. Bonnet D., and Dick J. E. (1997) Human acute myeloid leukemia is organized as a hierarchy that originates from a primitive hematopoietic cell. Nat. Med. 3, 730–737 10.1038/nm0797-730 - DOI - PubMed
    1. Salcido C. D., Larochelle A., Taylor B. J., Dunbar C. E., and Varticovski L. (2010) Molecular characterisation of side population cells with cancer stem cell-like characteristics in small-cell lung cancer. Br. J. Cancer 102, 1636–1644 10.1038/sj.bjc.6605668 - DOI - PMC - PubMed
    1. Shackleton M. (2010) Normal stem cells and cancer stem cells: similar and different. Semin. Cancer Biol. 20, 85–92 10.1016/j.semcancer.2010.04.002 - DOI - PubMed
    1. Lobo N. A., Shimono Y., Qian D., and Clarke M. F. (2007) The biology of cancer stem cells. Annu. Rev. Cell Dev. Biol. 23, 675–699 10.1146/annurev.cellbio.22.010305.104154 - DOI - PubMed
    1. Chang J. C. (2016) Cancer stem cells: Role in tumor growth, recurrence, metastasis, and treatment resistance. Medicine 95, S20–25 10.1097/MD.0000000000004766 - DOI - PMC - PubMed

Publication types

MeSH terms