. 2018 Jul 24;115(30):E7005-E7014.
doi: 10.1073/pnas.1806760115. Epub 2018 Jul 9.

Systems genetic analysis of inversion polymorphisms in the malaria mosquito Anopheles gambiae

Affiliations

Systems genetic analysis of inversion polymorphisms in the malaria mosquito Anopheles gambiae

Changde Cheng et al. Proc Natl Acad Sci U S A. .

Abstract

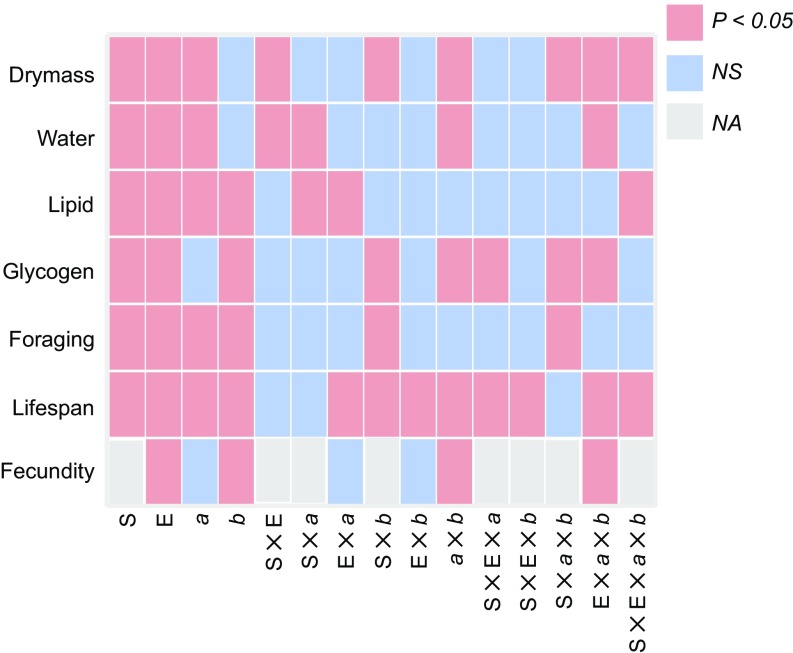
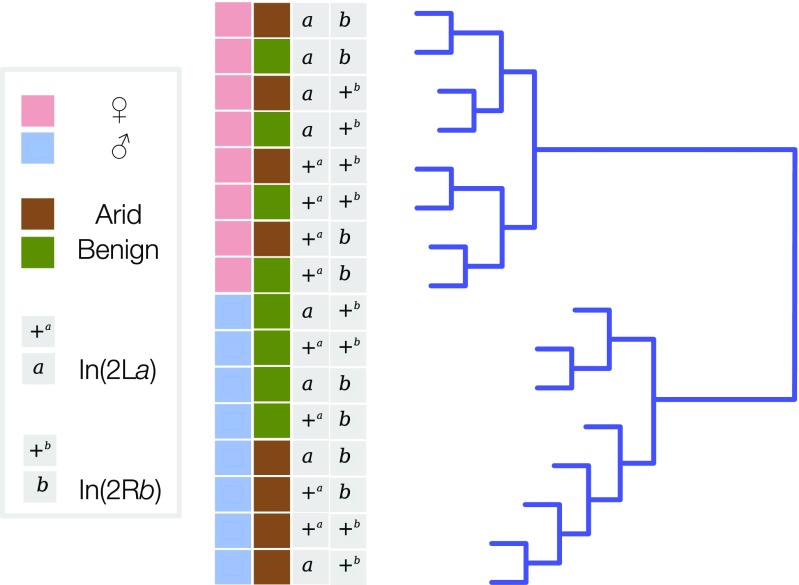
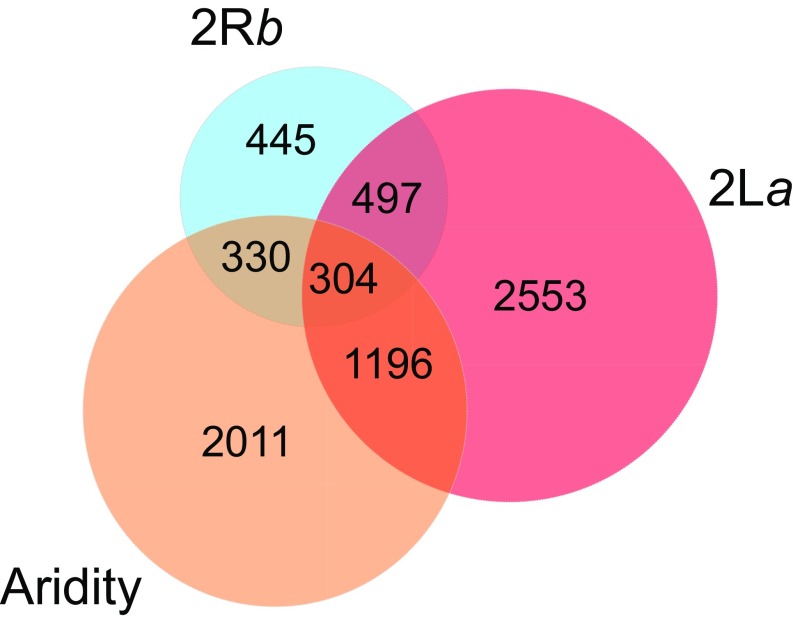
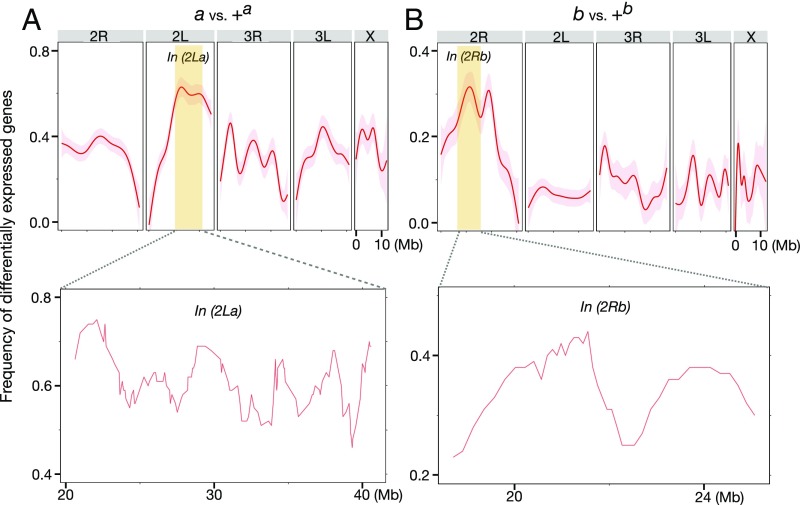
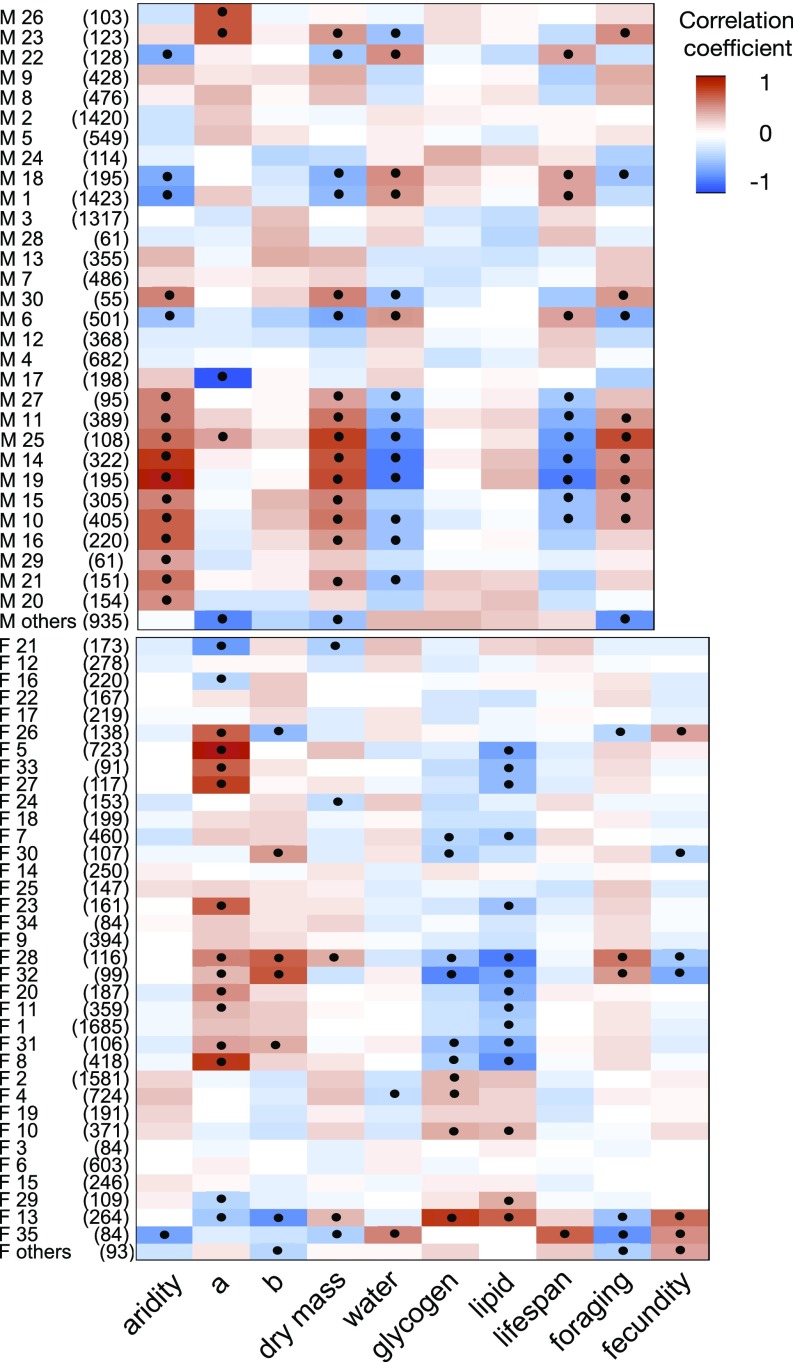
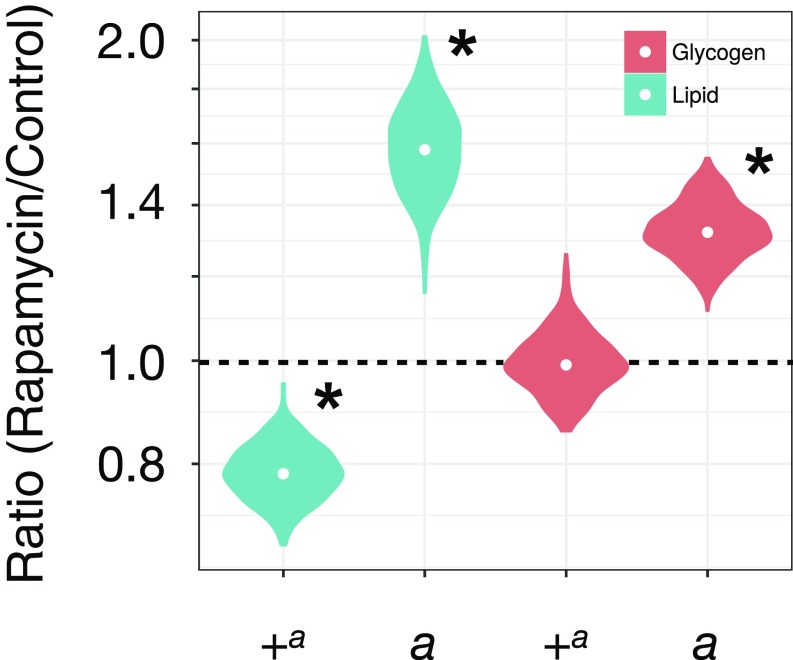
Inversion polymorphisms in the African malaria vector Anopheles gambiae segregate along climatic gradients of aridity. Despite indirect evidence of their adaptive significance, little is known of the phenotypic targets of selection or the underlying genetic mechanisms. Here we adopt a systems genetics approach to explore the interaction of two inversions on opposite arms of chromosome 2 with gender, climatic conditions, and one another. We measure organismal traits and transcriptional profiles in 8-d-old adults of both sexes and four alternative homokaryotypic classes reared under two alternative climatic regimes. We show that karyotype strongly influences both organismal traits and transcriptional profiles but that the strength and direction of the effects depend upon complex interactions with gender and environmental conditions and between inversions on independent arms. Our data support the suppressed recombination model for the role of inversions in local adaptation, and-supported by transcriptional and physiological measurements following perturbation with the drug rapamycin-suggest that one mechanism underlying their adaptive role may be the maintenance of energy homeostasis.

Keywords: Anopheles gambiae; aridity; chromosomal inversion; climate adaptation; systems genetics.


Conflict of interest statement

Conflict of interest statement: J.C.T. is currently affiliated with Roche-Madison, which produced the microarrays used in this study.

Figures

Fig. 1.
Fig. 1.
Summary of ANOVA describing the effects of factors and their interactions on organismal trait means. a, 2La; b, 2Rb; E, environmental condition; NA, not applicable; NS, not significant; S, gender.
Fig. 2.
Fig. 2.
Hierarchical clustering dendrogram of gene-expression data. Terminal branches (samples) are labeled by gender (pink, female; blue, male), environmental condition (green, benign; brown, arid), and inversion status (+, standard; a or b, inverted).
Fig. 3.
Fig. 3.
Venn diagram indicating numbers of genes whose expression was significantly affected by one or more of three factors: 2La, 2Rb, and aridity.
Fig. 4.
Fig. 4.
Enrichment of DEGs inside In(2La) and In(2Rb). (A and B, Upper) Curves (red lines) and 95% CIs (shaded surrounds) showing the frequency of inversion-affected DEGs along each chromosome were generated by the (stat_smooth) function of R package ggplot2. (Lower) For the focused view inside In(2La) and In(2Rb) (yellow panels), the frequency of DEGs was calculated for windows of 100 genes, slid at a step size of 10 genes. The position of each window was defined as the midpoint of the 100-gene segment.
Fig. 5.
Fig. 5.
Correlations between WGCNA modules from gene networks and treatment/traits for (A) males only and (B) females only. Modules (rows) are named alphanumerically at the left of each plot, followed by the number of genes in each module (in parentheses). Heatmap colors and intensities reflect the direction and magnitude of correlations between each module and a given organismal trait (columns). Red and blue indicate positive and negative correlations, respectively; significant correlations (after Bonferroni correction) are indicated within the plot.
Fig. 6.
Fig. 6.
Effect of rapamycin on lipid and glycogen content. Results are shown as the ratio of rapamycin-treated to untreated control. Ratios were assessed for significance by a Wilcoxon rank sum test (*P < 0.05). Circles inside violin plots represent the median.

References

    1. Hoffmann AA, Rieseberg LH. Revisiting the impact of inversions in evolution: From population genetic markers to drivers of adaptive shifts and speciation? Annu Rev Ecol Evol Syst. 2008;39:21–42. - PMC - PubMed
    1. Kirkpatrick M. How and why chromosome inversions evolve. PLoS Biol. 2010;8:e1000501. - PMC - PubMed
    1. Dobzhansky T. Genetics of the Evolutionary Process. Columbia Univ Press; New York: 1970.
    1. Krimbas CB, Powell JR. Drosophila Inversion Polymorphism. CRC; London: 1992.
    1. Puig M, Cáceres M, Ruiz A. Silencing of a gene adjacent to the breakpoint of a widespread Drosophila inversion by a transposon-induced antisense RNA. Proc Natl Acad Sci USA. 2004;101:9013–9018. - PMC - PubMed

Publication types

LinkOut - more resources